
Remember me
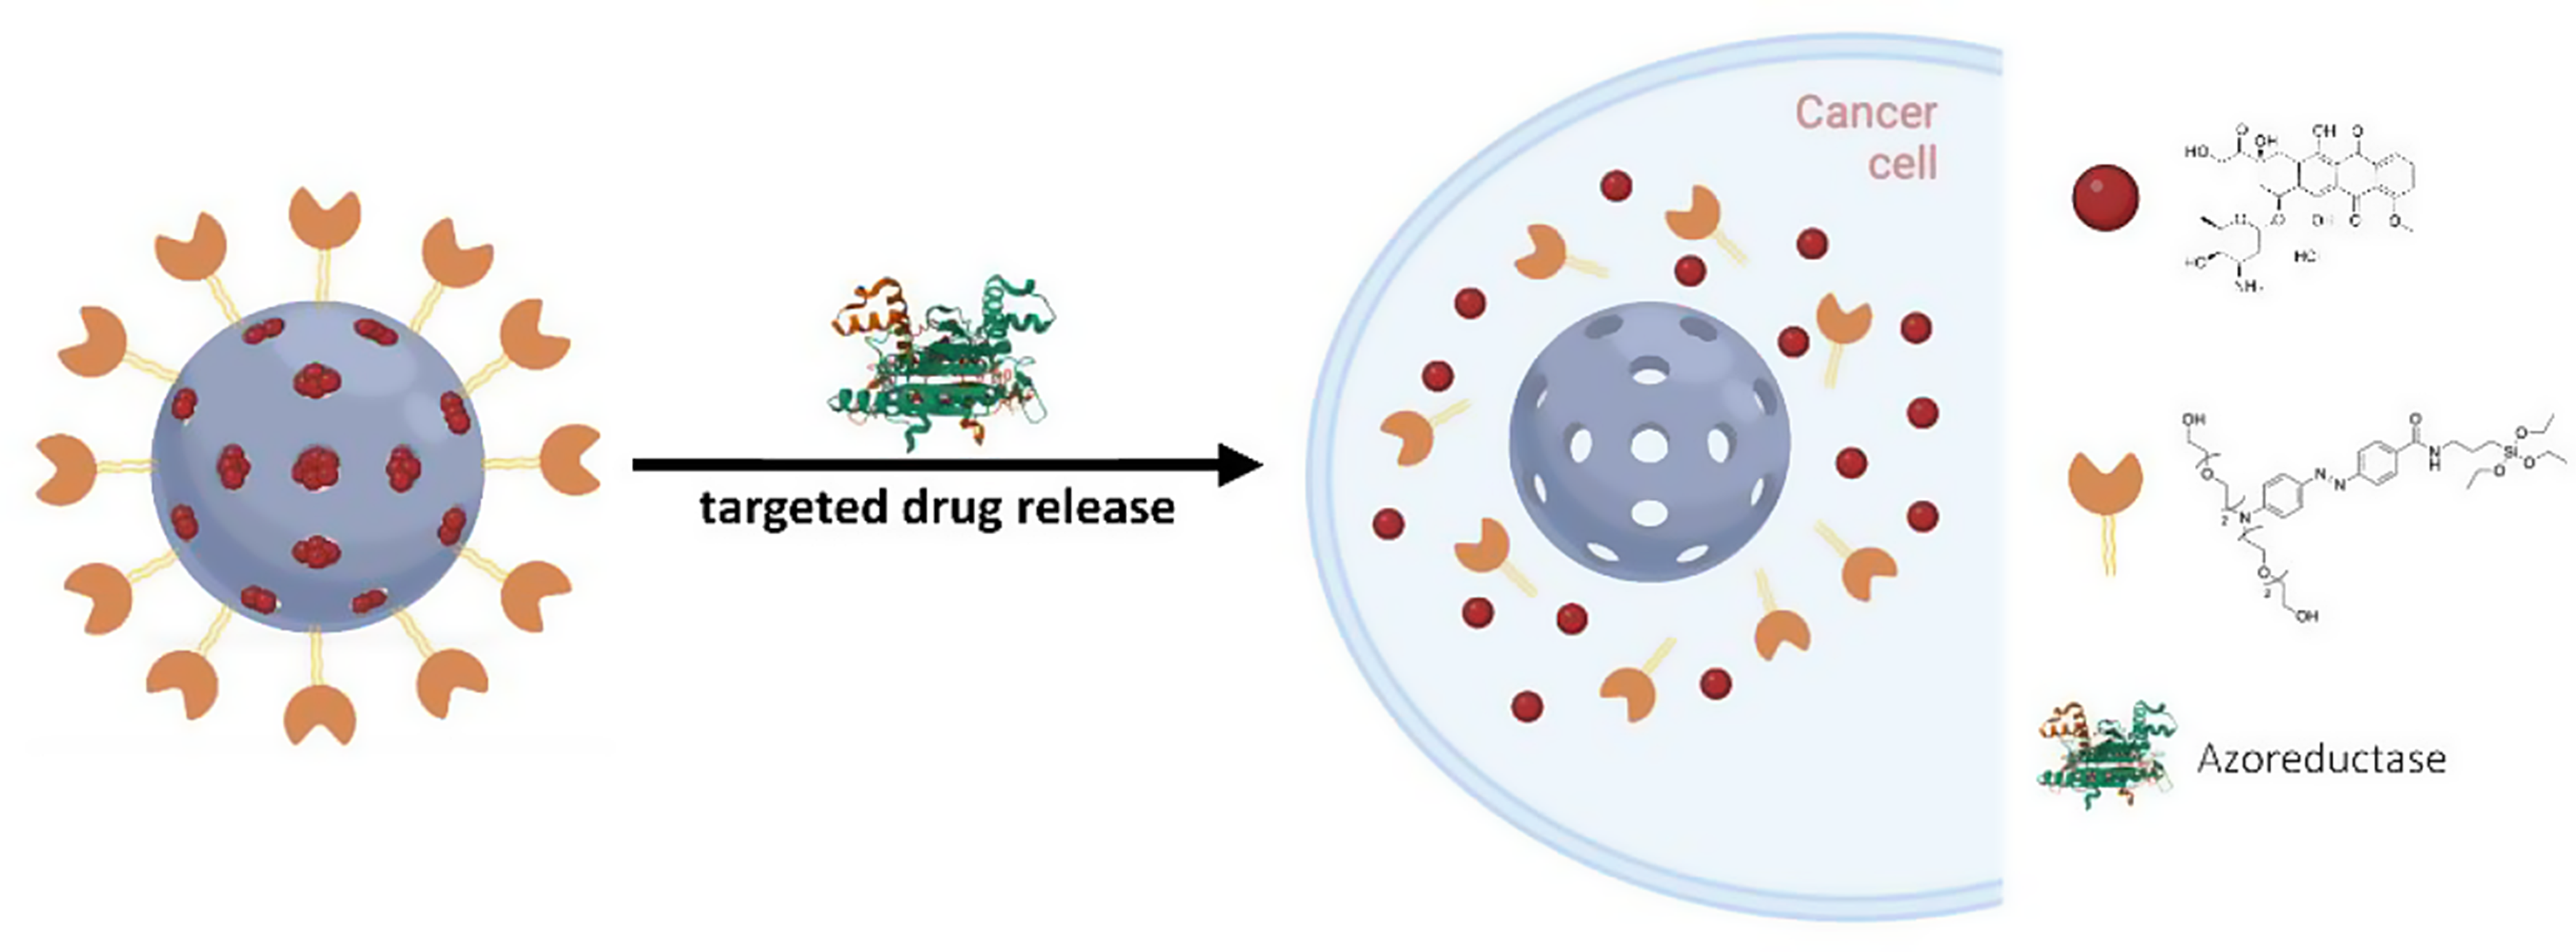
As mentioned above, our goal was the design and synthesis of a nanodevice for drug release at the desired site, based on the overexpression of AZRs in the hypoxic microenvironment. For this purpose, molecular gate 3 (see Scheme 1) incorporating an Azo moiety as the AZR-responsive linker, two oligo(ethylene glycol) chains as bulky and solubilizing groups, and a trialcoxysilane as reactive group to form Si-O-Si bonds with the silanol groups on the silica surface, was designed, to be subsequently anchored to the synthesized MSNs. On the one hand, gatekeeper 3 would block the nanoparticle’s pores, avoiding the release of the cargo; on the other hand, the Azo moiety can be reductively cleaved in the hypoxic microenvironment, releasing the drug. In detail, molecular gate 3 was obtained in a three-step synthesis (Scheme 1), starting with the dialkylation of aniline with an excess of 2-[2-(2-chloroethoxy)ethoxy]ethanol, to obtain product 1. Afterward, 1 underwent a diazotization-coupling reaction [32] with 4-aminobenzoic acid in an acidic solution to yield product 2. Finally, APTES was made to react with product 2 in the presence of DCC and NHS, in an inert atmosphere to give the carbamate bridge, and the complete molecular gate 3. All these compounds were confirmed by nuclear magnetic resonance and mass spectrometry experiments.
Scheme 1
Synthetic route for molecular gate 3
The starting MSNs were synthesized, by a sol-gel condensation of TEOS in the presence of sodium hydroxide and CTAB as a micellar template, following conditions published elsewhere [22]. Once MSNs were calcinated at 550 °C, the pores were loaded with the chemotherapeutic drug Dox, in aqueous solution. After cargo loading, the synthesized molecular gate 3 was anchored onto the external surface of the MSNs, through the condensation reaction between the silanol groups of the MSN and the triethoxysilyl groups of the molecular gate, giving the solid S1, in which the release of the encapsulated cargo is avoided because of pore blockage.
Characterization of the prepared nanomaterialsTo characterize the synthesized nanomaterials, several techniques, such as PXRD, TEM, DLS, N2 adsorption-desorption isotherms, FTIR, and TGA analyses, were used. The particle size and shape of the synthesized nanostructure were studied by TEM (Fig. 2b), showing a high internal porous ordering at the nanoscale for the MSNs observed as black and white stripes; both MSN and S1 show a spherical morphology (See Figure S4). An average diameter of 97.81 ± 7.0 nm (n = 30 particles) was calculated, similar to our previous studies [22] confirming that the siliceous matrix remains unchanged when loading and capping the MSNs. The size of the solid S1 assembly was assessed through DLS measurements (Fig. 2c). In this respect, 162.7 ± 3 nm was obtained as a starting hydrodynamic diameter for the MSNs, and after cargo loading and functionalization, the hydrodynamic diameter increased to 242.1 ± 5 nm. This increase ratifies the expected presence of the anchored molecular gate on the MSN surface. In the XRD diffractograms of MSN-based materials (Fig. 2d), the unmodified MSN shows an intense Bragg peak, corresponding to (100) plane, and three low-intensity diffraction Bragg peaks, corresponding to (110), (200), and (210) planes, respectively. After functionalization, a decrease in the intensity of the (100) peak can be observed, as well as a broadening of the (110) and (200) peaks, due to the loss of contrast by filling the pores with the cargo. The FTIR spectrum of S1 (Figure S6) shows the appearance of signals corresponding to aromatic = C-H bonds (> 3000 cm− 1), C = C bonds and N = N bonds (ca. 1600 cm− 1) and the characteristic peak for Si-O-Si at ca. 1050 cm− 1. Furthermore, the zeta potential values for calcined MSNs and S1 are − 21.6 ± 0.1 mV and + 31.3 ± 0.4 mV, respectively. The negative value for the zeta potential of the calcined MSNs is attributed to the presence of silanolate anions on the surface of the nanoparticle. However, after functionalization with molecular gate 3, zeta potential becomes positive in S1. From the N2 adsorption-desorption isotherms, a BET-specific surface area of 1060 m2 g− 1 for the calcinated MSNs was measured, and an average pore size of ca. 2.85 nm (See Figure S5).
The cargo loading was determined from delivery studies and thermogravimetric analyses (Fig. 2e). In this respect, solid S1 contains 62.5 mg of Dox per gram of solid, which corresponds to a drug loading content (DLC) of 6.25% w/w. We found in the literature that for similar gated MSNs, Dox DLC values range from approximately 5–15% w/w, depending on the functionalization and loading methods used [40,41,42]. Thus, our DLC falls within the typical range for similar systems. This level of drug loading is considered suitable for effective drug delivery, as it balances therapeutic efficacy with reduced cytotoxicity and supports system stability and controlled release.
Fig. 2
Physicochemical characterization of MSNs and hypoxia-responsive nanocarrier S1. (a) Schematic synthetic procedure for S1; (b) TEM images of (A) calcinated MSNs and (B) S1; (c) Hydrodynamic diameter distribution determined by DLS for calcinated MSN (black line) and S1 (orange line); (d) Powder X-ray diffraction patterns of the MSN (black line) and S1 (orange line); (e) Thermogravimetric analysis for MSN (black line) and S1 (orange line)
Reduction of molecular gate 3 under mimicked hypoxic environmentThe effective reduction of the Azo moiety requires the presence of AZR and nicotinamide adenine dinucleotide phosphate (NADPH) as cofactor, both present in hypoxia tumor environments. For in vitro experiments, we selected hydrazine monohydrate as the chemical reducing agent to test the successful reduction of Azo. The expected mechanism for the reduction of 2 is shown in Fig. 3a. In the presence of hydrazine, a decrease in the characteristic UV-Vis band of Azo moiety is observed in Fig. 3b. The extent of this decrease is proportional to the concentration of the reducing agent, achieving a total reduction of the Azo moiety at 50 equivalents of hydrazine, as can be seen in Fig. 3c. This reduction can also be observed with the naked eye since the Azo is bright orange, and color loss is observed by adding hydrazine (See Figure S7).
Fig. 3
(a) Proposed mechanism of hydrazine-induced reduction of molecule 2; (b) UV-vis absorbance spectra changes of molecule 2 (10 mM in EtOH) after treatment with increasing concentrations of hydrazine monohydrate (0–75 equiv.); (c) Changes in absorbance intensity at 417 nm as a function of hydrazine concentration
Drug release of Dox from S1 under reducing conditionsAzo moiety in the molecular gate 3 can be rapidly reduced by the AZRs present in hypoxic tumor environments allowing the release of the Dox contained in MSN mesopores. To examine the Dox release profile of S1 under simulated hypoxic conditions, we used hydrazine monohydrate in PBS solution (500 µL, at pH 6.4). To confirm our strategy, cargo delivery from S1 in the absence of reducing agent (blank) was also studied in PBS solution (pH 6.4) comparing the obtained results (see Materials and methods section). As can be observed in Fig. 4, in the absence of hydrazine, a low cargo delivery can be seen. In contrast, in the presence of hydrazine, a remarkable release of Dox is found after 2 h. This cargo release is due to the reduction of Azo into two amine groups, leaving enough space for the Dox to come out of the mesopores.
Fig. 4
Delivery profiles of Dox from the solid S1 after 6 h in PBS at pH 6.4 in the absence (black line) and in the presence (orange line) of hydrazine monohydrate (1 µL/mL)
Cytotoxic activity in azoreductase overexpressed cancer cells compared to monocyte-macrophage cellsAfter verifying that nanocarriers S1 preferentially release their cargo in a reducing microenvironment, we evaluated the efficacy of the nanodevice for the targeted release of anti-cancer drugs to azoreductase-overexpressing cells. In a first stage, azoreductase overexpressed cells, A549 (human nonsmall cell lung carcinoma cell line), and THP-1 cells (human monocytic cell-line with low expression of AZR) were employed for cell viability assay under normoxic conditions. THP-1 cell line presents an additional interest to study since free Dox significantly affects monocyte and macrophage survival, function, and differentiation in cancer patients, producing some side effects like immune system suppression [43].
First, it is of the greatest importance to test the cell viability of the gated nanoparticle itself. For that, the cells were individually treated with variable concentrations of empty nanoassemblies S2 (MSNs capped with the Azo gatekeeper, but without cargo) and incubated for 24 h. The cell viability was measured using the MTT assay. Interestingly, the nanoparticle itself exhibits high cell viability in both cell lines (Fig. 5, blue columns). This implies that the nanoparticle has a high biocompatibility and is a potential material for chemotherapeutic applications in cancer. Next, cytotoxicity of the Dox-loaded nanoassemblies S1 toward A549 cancer cells and THP-1 cells, was tested by incubation for 24 h. As expected, results revealed a significant and concentration-dependent cell death for azoreductase overexpressed cancer cells (A549, Fig. 5a) even at low concentrations (3 µg/mL), while there is no significant cell death for THP-1 cells (Fig. 5b). This confirms that the azoreductase enzyme plays a major role in reducing the azo bond in the molecular gate, leading to the release of Dox molecules to the cytosol of the cancer cells while showing a benign nature toward normal cells, making the system very interesting and promising in the field of targeted therapeutic applications. Besides, the lack of S1 cytotoxicity in THP-1 cells, even at the highest concentration, would suggest the absence of an unspecific passive doxorubicin release from the loaded nanoparticles.
Fig. 5
Cell viability of unloaded (blue, S2), and Dox-loaded (orange, S1) nanoparticles in (a) A549 lung cancer cells and (b) THP-1 human monocyte cells. Results are expressed as mean ± SD (n = 15). *p < 0.05, ****p < 0.0001 versus control untreated cells (Blank). One-way ANOVA followed by Dunnet’s test
Confocal microscopy imagingThe A549 cells were used to evaluate the cellular uptake of the Dox-loaded NPs S1 by confocal laser scanning microscope. Two concentrations (25 and 50 µg/mL) and two incubation times (4 and 24 h) were used to perform a comparative analysis. As shown in Figure S8, a strong and concentration-dependent red fluorescence was observed after 4 h-incubation with the NPs, indicating their internalization and accumulation into the cells, mainly near the mitochondria and around the nucleus (merged image). After 24 h of incubation, the concentration-dependent red fluorescence was accompanied by cellular death with nuclear damage and mitochondrial fragmentation, which can be observed easily with the 50 µg/mL treatment (Figure S9). These results were also confirmed by quantitative analysis of images, which showed a significant increase of Dox fluorescence in the 50 µg/mL treatment compared to the 25 µg/mL treatment; the fluorescence intensity is maintained in the time (See Figure S10).
Despite the mitochondrial and nuclear damage observed in the confocal images, the uptake of doxorubicin into the nucleus was not clearly observed under our experimental normoxic conditions. Thus, we decided to perform new experiments under hypoxia conditions (2% O2) to enhance azoreductase overexpression in A549 cells and consequently increase the gate opening of nanoassemblies.
Cytotoxicity studies in A549 cancer cells under hypoxia conditionsIn this set of experiments, A549 cells were incubated with S1 (Dox-loaded) and S2 (unloaded) during 24 h under hypoxia conditions (2% O2). As shown in Fig. 6a, results of MTT assay confirmed the absence of cytotoxicity of empty nanoassemblies. In contrast, S1 produced a clear increase in cytotoxicity compared to normoxic conditions, with an IC50 value near 100 µg/ml.
Since the loading of Dox into the NPs was approximately 6%, a new study was performed by incubating the cells during 24 h with free doxorubicin at 1.5, 3 and 6 µg/ml (concentrations equivalent to 25, 50 and 100 µg/ml of Dox-loaded nanoassemblies). Results showed a concentration-dependent cytotoxic effect for free Dox in a similar range to Dox-loaded nanoparticles S1, although free doxorubicin only reduced cell viability to 35% at the highest concentration tested (which is equivalent to 100 µg/ml of Dox entrapped in S1) (Figure S11).
A possible explanation for the somewhat lower activity of free Dox respect to DOX-loaded nanoparticles is that nanoparticles are more readily internalized by an endocytosis mechanism compared to a passive diffusion mechanism of Dox into cells [44].
Figure6 shows confocal images of cells treated with S1 (25 and 50 µg/ml) under hypoxia conditions. After 24 h of incubation, we observed a concentration-dependent red fluorescence into the cells, which was confirmed by quantitative analysis of images (Figure S12). In addition, a clear increase of nuclear uptake of Dox into the nucleus was detected, mainly at 50 µg/mL. These results confirm that hypoxia conditions in A549 cells enhance the release of Dox from the loaded NPs due to the increase of azoreductase overexpression and the consequent gate opening.
Fig. 6
(a) Cytotoxicity of unloaded blank (blue S2) and Dox-loaded (orange, S1) in A549 lung cancer cells after 24 h-incubation under hypoxic conditions (2% O2). Results are expressed as mean ± SD (n = 3). **p < 0.01, ****p < 0.0001 versus Blank untreated cells (B). One-way ANOVA followed by Dunnet’s test. (b) Confocal microscope images of A549 cells after 24-incubation with S1 (25 and 50 µg/mL). B: untreated cells. Cell nuclei were stained with DAPI. Pink stain: colocalization of Dox within the nuclei. Representative image from three independent experiments. Untreated Scale bar 20 μm
Comments (0)