Materials
The humanized monoclonal antibody bevacizumab was kindly donated by mAbxience (Spain). Polyglutamic acid (PGA, nBuPGA(100)[Na]; molecular weight (Mp) determined by SEC-RI-MALS: 14.7 kDa; polydispersity index (Mw/Mn) by SEC-RI-MALS: 1.05) was provided by Curapath (Valencia, Spain). PGA-PEG (PEG (5 kDa)-b-PGA (10) [Na]) (polyethylene glycol (5 kDa)-block-poly(α-glumatic acid) (10u)sodium salt) was obtained from Polypeptide Therapeutic Solutions (Valencia, Spain). 1,2-dioleoyl-3-trimethylammonium-propane chloride (DOTAP) was obtained from Avanti Polar Lipids (Alabaster, AL, USA). Polysorbate 80 (Tween® 80), vitamin E (D, L-α-tocopherol), Accutase® solution, formaldehyde, penicillin/streptomycin solution, Amicon centrifuge filters (30–100 kDa), and glial fibrillary acidic protein (GFAP, 1:500, MAB360) were obtained from Merck (Darmstadt, Germany). Phosphatidylcholine from soybean (Lipoid S100) and N-(Carbonyl-methoxypolyethylene glycol-2000)-1,2-distearoyl-sn-glycero-3-phosphoethanolamine (DSPE-PEG2K) were purchased from Lipoid GmbH (Germany). Dulbecco’s Modified Eagle Medium (DMEM) and Opti-MEM were obtained from Gibco (Gaithersburg, MD, USA). Fetal bovine serum (FBS) and 24-well plates were purchased from Corning (New York, NY, USA). AlamarBlue Cell Viability Reagent and goat anti-human IgG FITC conjugate were obtained from Invitrogen (Massachusetts, MA, USA). NeuN antibody (clone A60, MAB360) and donkey serum, and Hoechst 33,342 (62249)were purchased from Sigma-Aldrich (San Luis, MO, USA). Ionized calcium-binding adaptor molecule 1 (Iba-1; ab178846) was obtained from Abcam (Cambridge, UK). Alexa Fluor 568-conjugated donkey anti-rabbit IgG or donkey anti-mouse IgG were purchased from Molecular Probes (Eugene, OR, USA). Oriole fluorescent gel stain was obtained from Bio-Rad (USA). Glial fibrillary acidic protein (GFAP, MAB360) was purchased from Merk Millipore (MA, USA).
GMP-grade zirconium-89 as [89Zr]Zr-oxalate in 1 M oxalic acid was purchased from PerkinElmer (BV Cyclotron, VU Amsterdam, Netherlands). Isothiocyanate derivative of Deferoxamine was obtained from CheMatech (Dijon, France). Oxalic acid (98%) and Immu-Mount were purchased from Thermo Fisher Scientific (Waltham, MA, USA). PD Imaging studies were conducted using a Bruker BioSpec 3T PET/MRI scanner (bore diameter: 17 cm) equipped with actively shielded gradients (450–900 mT/m). Centrifugal devices (300 kDa) were purchased from Pall Life Sciences (Port Washington, NY, USA).
Preparation of BVZ-loaded nanosystemsPreparation of PGA-PEG NCs
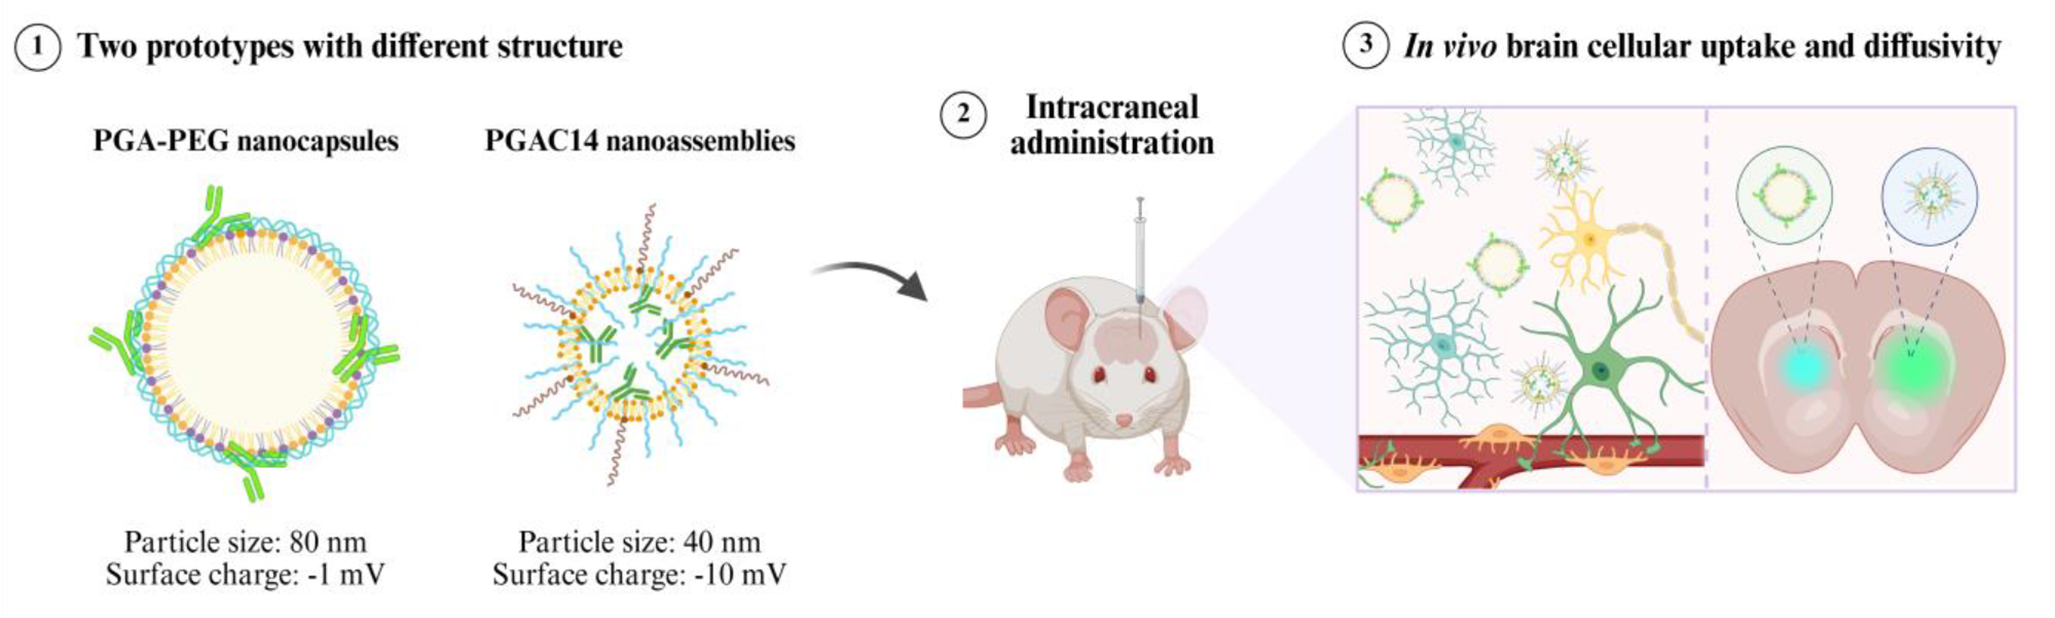
NCs were formulated using a microfluidic approach (NanoAssemblr) in two steps. First, the organic phase, consisting of vitamin E (6.75 mg/mL), Tween® 80 (1 mg/mL), and DOTAP (0.25 mg/mL), all dissolved in ethanol, was mixed with an aqueous phase containing BVZ (0.5 mg/mL in water). Subsequently, PGA-PEG (4 mg/mL) was added to the preformed formulation to complete the NCs formation. Finally, BVZ-loaded NPs were concentrated up to a final BVZ concentration of 1 mg/mL using a nitrogen source.
Preparation of PGAC14 NAs
Self-assemblies incorporating the PGAC14 amphiphilic polymer were prepared by adding 125 µL of an aqueous solution of BVZ (4 mg/mL) to 500 µL of an aqueous solution of PGAC14 (1 mg/mL) under magnetic stirring at 1100 rpm and RT. Subsequently, 50 µL of an ethanolic solution containing Lipoid S100 (20 mg/mL) and DSPE.PEG2K (2 mg/mL) in a ratio 1:1 v/v were added over the above mixture. Finally, BVZ-loaded NPs were concentrated up to a final BVZ concentration of 1 mg/mL using a nitrogen source.
Physicochemical characterization of nanosystems
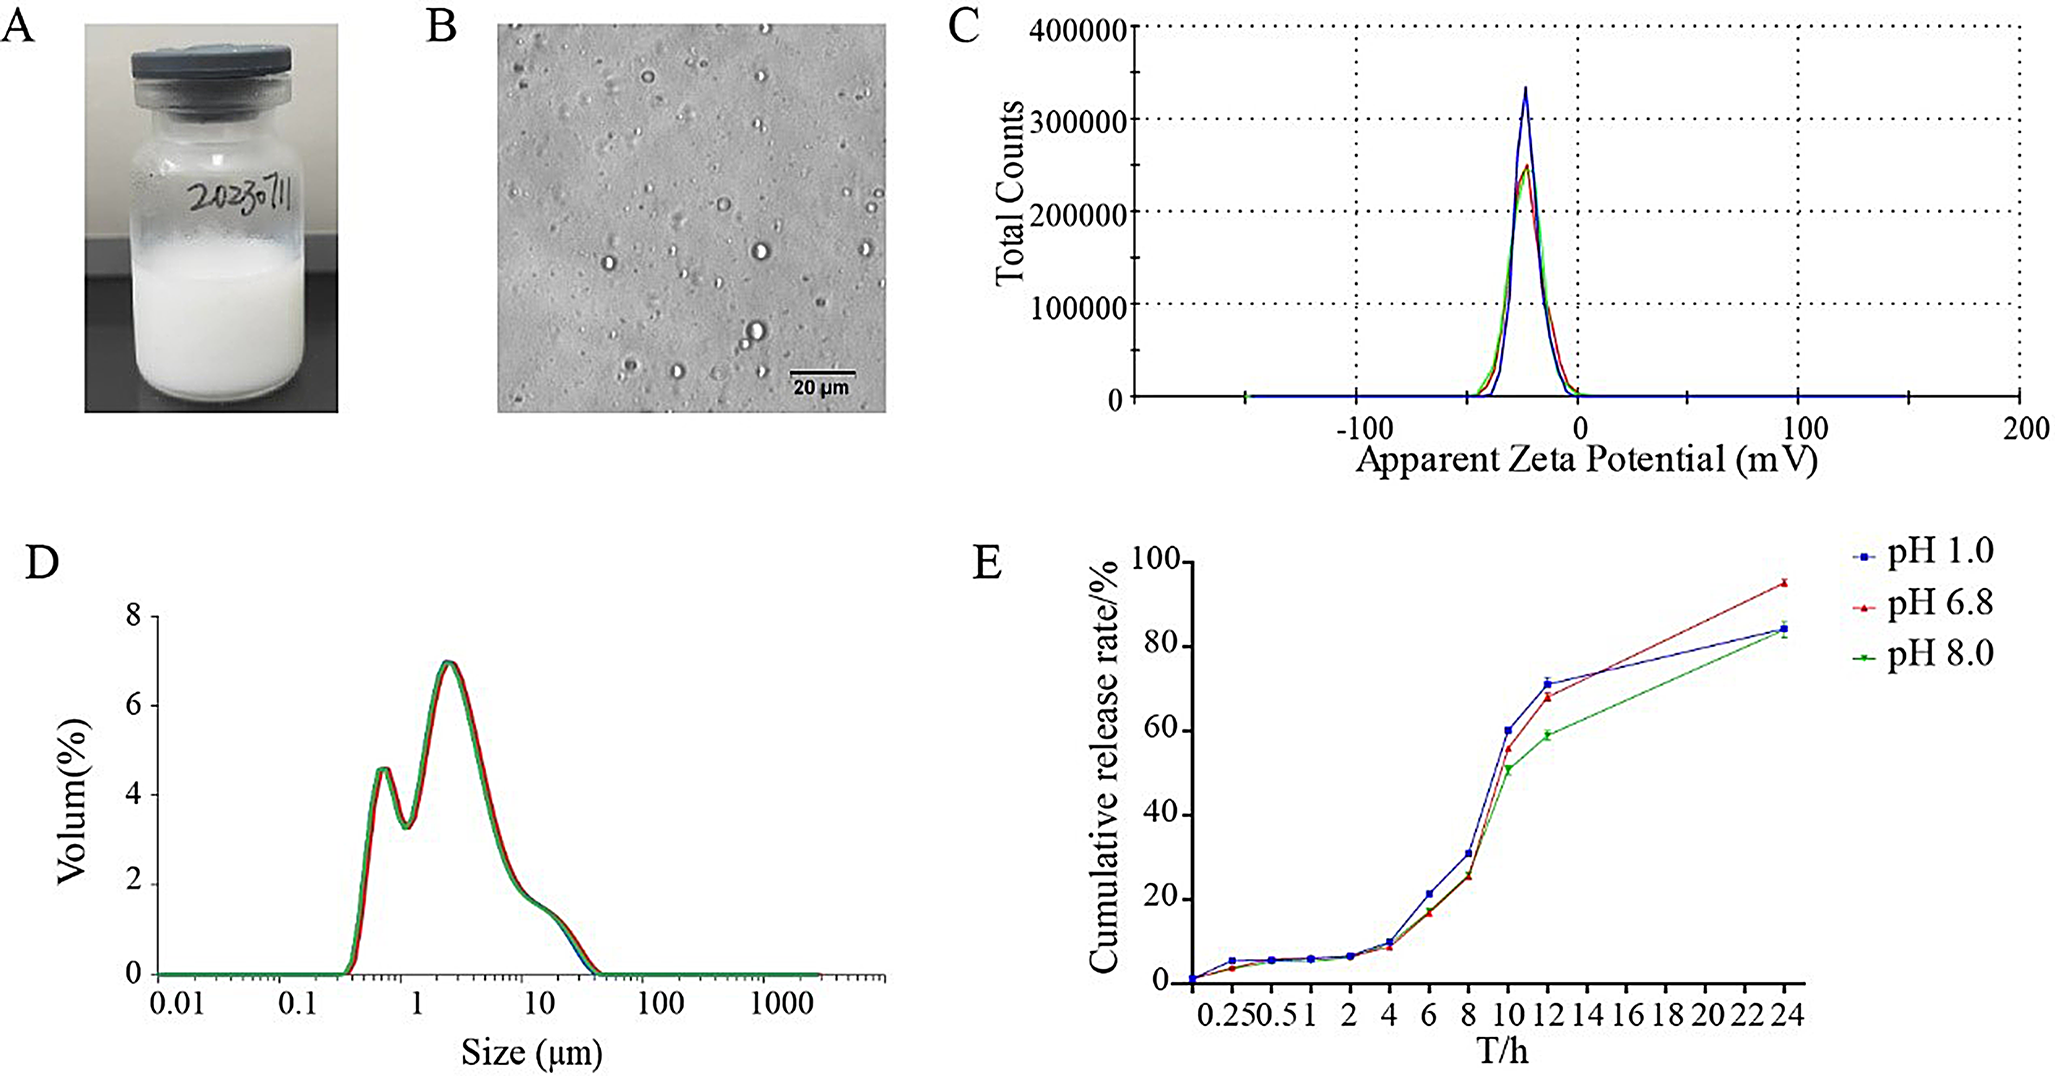
The physicochemical properties of all the prototypes were performed with a Malvern Zeta-Sizer (NanoZS, ZEN 3600, Malvern Instruments, Worcestershire, United Kingdom). The particle size and polydispersity index (PDI) were determined using Dynamic Light Scattering (DLS) after diluting accordingly the samples in H2O. The zeta potential was measured after dilution in PBS by Laser Doppler Anemometry (LDA), using the same device. For a further physicochemical characterization, PGA-PEG NCs were analyzed by Nanoparticle Tracking Analysis (NTA) after diluting the samples 10,000 times in H2O (NanoSight NS3000, Amesbury, United Kingdom).
Quantification of the Mab association efficiency (AE) and loading capacity (LC) by using sodium dodecyl-sulfate polyacrylamide gel electrophoresis (SDS-PAGE)
The amount of associated mAb was determined by SDS-PAGE for separation under reducing conditions. PGA-PEG NCs were isolated by ultracentrifugation following the previously described conditions (i.e., 35000 rpm – 1.5 h – 15 °C). Then, the amount of non associated mAb present in the supernatant was quantified. Briefly, the supernatant was diluted accordingly to fit in the calibration curve. The mAb standard solutions of known concentrations (from 1 to 0.2 µg/lane) were prepared in PBS. Treated samples were diluted in a volume ratio 1:1 with 2X Laemmli buffer and vortexed for several seconds. Then, the samples were boiled at 99.5 °C for 5 min. 20 µL of the denatured samples were resolved using stacking and resolving polyacrylamide gels of 4 and 12%, respectively, in the presence of 0.1% SDS in the running buffer. After 1 h with variable milliamps and a voltage ranging from 100 to 120 V. Finally, samples were stained using Oriole fluorescent gel stain solution for 1 h at RT in head-to-tail rotation. Prior to analysis, the gel was washed twice with ultrapure water.
GelAnalyzer 19.1 software (www.gelanalyzer.com) by Istvan Lazar Jr., PhD and Istvan Lazar Sr., PhD, was used to process and analyze the samples. Total bands areas of the calibration curve were referred to the theoretical value and those ranging between 80 and 120% were considered. Samples’ bands intensities referred to the calibration curve. The AE and LC were determined as follows:
AE (%) = [1- (mass of free mAb) / theoretical mass of mAb] x 100.
LC (%) = [mass of associated mAb / total theoretical mass of the nanosystems] x 100.
Dot blot for evaluation of antigen recognition
Several 4 µL droplets of Mili-Q water, recombinant antigen VEGF (0.05 µg) or the mAb BVZ (0.04 µg) were dispensed onto a pre-cut nitrocellulose membrane. Then, the membrane was blocked with blocking buffer (1× TBS with 5% w/v nonfat dry milk) for 1 h, washed three times with PBS/0.1% Tween 20, and incubated with free BVZ BVZ-loaded PGA-PEG NCs, BVZ-loaded PGA14 NAs or blank nanosystems for 1 h. Prior to the assay, the nanoparticles were disrupted to allow the release of the encapsulated antibody for antigen binding. After washing three times with PBS/0.1% Tween 20, the membrane was incubated with goat anti-human IgG FITC conjugate (1:500) for 1 h. Finally, the membrane was washed two times with TBS/0.1% Tween 20 and rinsed in PBS. Images were obtained by scanning the membrane with the ChemiDoc imaging system (Bio-Rad).
Stability in simulated biological media
The colloidal stability of the PGA-PEG NCs and PGAC14 NAs was evaluated by diluting them 3-fold in PBS, followed by incubation at 37 °C under orbital shaking at 300 rpm. At specific time points (0, 2, 4, 8, and 24 h), the particle size and PDI were measured using DLS.
AlexaFluor488 - BVZ conjugation
A total of 250 µL of BVZ (25 mg/mL) was mixed with AlexaFluor488 (10 mg/mL) in a molar ratio of 8:1 (AlexaFluor488: BVZ), using 1 M NaHCO₃ buffer (pH 8.5) to achieve a final volume of 300 µL. The reaction was mixed at RT for 5 min under low magnetic stirring, followed by overnight incubation at 4 °C. The conjugate was purified using Centripure MINI Desalt Z-50 columns (1000 g, 2 min) with 1x PBS, followed by concentration with 10 kDa MWCO centrifugal filters (14,000 g, 10 min, 15 °C) to a final volume of 100 µL. Samples were stored at 4 °C for short-term use or at -20 °C for long-term storage. The protein concentration (M) was determined by measuring absorbance (A) at 280 nm and 495 nm using a Beckman Coulter® Du730 UV/VIS spectrophotometer, following the instructions from the supplier.
DFO-BVZ conjugation
For radiolabeling the mAb, a first conjugation reaction was done between the mAb and the DFO [27]. Briefly, 1 mL of PBS containing 5 mg of mAb was mixed with 0.1 M Na2CO3 for an acceptable pH range of 8.9–9.1 and homogenized by vortex. Over this solution, 20 µL of 5 mM DFO dissolved in DMSO were added in 5µL steps. After 30 min at 37 °C, the final product was purified by 30–100 kDa centrifugal filters and washed with ultrapure water. Finally, the purified DFO-mAb conjugate was made up to 1 mL with ultrapure water.
Radiolabeling with 89ZrRadiolabeling of PGA-PEG NPs
A solution of 89Zr in oxalic acid 1 M was transferred into a metal-free tube, followed by the addition of Na2CO3 2 M to increase the pH until 4–5. Then, an appropriate amount of HEPES 0.5 M (pH 7.4) buffer was added to neutralize the pH to 7 [28]. A solution of 150–200 µL of NCs was slightly added over the 89Zr solutions and the reaction mixture was kept under orbital stirring at 550 rpm for 1 h at 25 °C. The final product was purified using Amicon® Ultra 0.5 mL Centrifugal Filters 100 K to remove free 89Zr.
Radiolabeling of PGAC14 NAs
The chelation of 89Zr to the DFO-BVZ was performed following a previously described method [27], which was adapted accordingly. 200 µL of 1 M oxalic acid containing 89Zr were neutralized with 90 µL of 2 M Na2CO3 pH 7–8 and incubated for 3 min at RT. Then, 500 µL of 0.5 M HEPES buffer pH 7.2, 700 µL of DFO-BVZ, and 500 µL of 0.5 M HEPES buffer pH 7.2 were consecutively added over the previous solution and mixed at RT under horizontal agitation at 350 rpm. After 1 h of incubation, the 89Zr radiolabeled-BVZ was concentrated using 30–100 kDa centrifugal filters to its original volume.
The 89Zr radiolabeled-BVZ entrapment into the nanoassemblies was performed as described in the section “Preparation of PGAC14 NAs”. Briefly, a non-radiolabeled BVZ was shifted by 89Zr radiolabeled-BVZ. Afterwards, the NAs were concentrated to a final mAb concentration of 1 mg/ by using a centrifugal device of 300 kDa (12000 g, 1.5 min, RT).
Radiochemical characterization
After radiolabeling with 89Zr, the radiochemical yield (RCY%) was calculated as the percentage of radioactivity retained in the 89Zr-labeled nanosystems after purification compared to initial radioactivity used in the reaction (Figure S2A).
The percentage of radiochemical purity (RCP%) was assessed using instant thin-layer chromatography (iTLC) (Figure S2B). Briefly, 1.5 µl of 89Zr-labeled nanosystems was added in a glass microfiber chromatography paper impregnated with silica gel (instant TLC-SG Chromatography paper, Agilent, Santa Clara, CA, USA) and the paper was eluted with a solution of citric acid 20 mM + 60 mM EDTA: Acetonitrile (9:1 v/v). The radioactivity was measured by a TLC radioactivity detector system (RITA, Elysia-Raytest, Angleur, Belgium). Gina Star Software (RITA, Elysia-Raytest, Angleur, Belgium) was used to determine the 89Zr-labeled nanosystems which remained at the bottom of the paper and the free 89Zr, which is chelated by the EDTA and eluted with the eluents.
To evaluate radiochemical stability (RCS%), 89Zr-labeled nanosystems were incubated in PBS supplemented with 10% of FBS at 37 °C for 4, 24 and 48 h (Figure S2C). Following incubation, RCS% was determined as the percentage of radioactivity retained in the 89Zr-labeled nanosystems compared to free radioactivity after purification.
Release profile of BVZ
The amount of released 89Zr-BVZ was quantified by gamma counter. The samples were radiolabeled with 89Zr and diluted 3 times in PBS at pH 7.4 and incubated under orbital agitation at 37 °C. Each time point was prepared in an independent low binding Eppendorf and at different time points, 500µL of the samples were centrifuged (10000 g, 15 min, 20 °C). The free antibody in the permeate and the BVZ-entrapped into the nanosystems were recovered and quantified by Gamma counter.
As control, free BVZ was treated in the same conditions and quantified. The release pattern was expressed as the % of cumulative BVZ released calculated as follows:
Cumulative BVZ released (%) = free BVZ at t1 - free BVZ at t0.
t0 indicates the condition before incubation, t1 corresponds to the condition at the time point.
under study.
Cell viability assays
The toxicity profile of both prototypes was evaluated using the Resazurin assay (AlamarBlue Cell Viability Reagent). Primary monolayer cultures of astrocytes were kindly provided by Miguel López group [29]. Neurons (GT1-7 cells) and astrocytes were seeded in a 24-well plate at a density of 7 and 5 × 10⁴ cells per well and allowed to adhere overnight for 24 h at 37 °C with 5% CO2. Dulbecco’s Modified Eagle Medium (DMEM) (high glucose) containing 10% fetal bovine serum, and 5% penicillin/streptomycin was used as the cell culture medium. When the cells reached 70–80% confluence, the culture medium was removed and replaced with 400 µL of BVZ loaded nanosystems at various concentrations in DMEM. Cells co-cultured with nanosystems were incubated for 4 hours. Finally, Resazurin (1.22 mg/mL) was diluted in the cell culture medium to a final concentration of 12.2 µg/mL and added to each well. After 45 min of incubation, the fluorescence was measured using a microplate reader (Promega, Madison, WI, USA). Untreated cells served as positive controls, while cells treated with 0.5% (v/v) Triton X-100 diluted in cell culture medium were used as negative controls. The percentage of cell viability was calculated by subtracting the values of negative control from those of the samples and dividing by the fluorescence of the positive control.
$$\begin&\text\:\text\left(\%\right)\cr&=\frac}}\end$$
Cell uptake
Neurons (GT1-7 cells) and primary cultures of astrocytes were seeded in a 24-well plate at densities of 7 and 5 × 10⁴ cells and allowed to adhere overnight for 24 h at 37 °C with 5% CO2. DMEM (high glucose) containing 10% fetal bovine serum, and 5% penicillin/streptomycin was used as the cell culture medium. When the cells reached 70–80% confluence, the culture medium was removed and replaced with 400 µL of BVZ loaded nanosystems at various concentrations in DMEM. Cells co-cultured with nanosystems were incubated for 4 hours. After 4 h of incubation, the cell supernatant was discarded, and cells were washed with cold PBS three times. Then, cells were detached from the wells with Accutase for 5 min at 37 °C and collected in FACS tubes. Thereafter, cells suspensions were washed with 3mL of cold FACS washing buffer (PBS 2% FBS) and centrifugated at 1000 rpm for 5 min. Finally, cells were fixed with 100µL of paraformaldehyde (PFA 4%) for 30 min. Treated cells were analyzed by flow cytometry in a FACScalibur instrument (10000 events) and resulting data were analyzed by FlowJo software BDLifescience.
Animal studies
The animal study protocol was carried out following the European Communities Council Directive 2010/63/EU, Directive 86/609/EEC, and Spanish RD 526/2014, and was approved by the corresponding committee at the University of Santiago de Compostela (protocol 14,715,012/2021/012; last version 16 April 2021).
Immunofluorescence study after intracranial administration
BVZ, PGA-PEG NCs, and PGAC14 NAs were administered intrastriatally to male Sprague-Dawley rats (8–10 weeks old, n = 6). Four animals were assigned to the PGA-PEG NCs/PGAC14 NAs group, receiving a PGA-PEG NCs injection in one striatum and a PGAC14 NAs injection in the contralateral striatum. Meanwhile, two animals were included in the control group, receiving BVZ in one striatum and PBS in the other. Before the surgical procedure, the animals were deeply anesthetized with ketamine (50 mg/kg) and medetomidine (0.4 mg/kg) and positioned in a stereotaxic frame (Kopf Instruments, CA, USA). A total volume of 2 µL of 1 mg/mL AlexaFluor488-BVZ, either encapsulated in PGA-PEG NCs, PGAC14 NAs, or in free form, was injected using a 10-µL Hamilton syringe attached to a motorized injector (Stoelting) at a rate of 0.5 µL/min. The stereotaxic coordinates used for the injections were A/P: 0.8 mm; M/L: 3.0 mm (right striatum) or -3.0 mm (left striatum) and D/V: 5.0 mm from dura. To minimize reflux, the needle was left in place for an additional 5 min before withdrawal. After 48 h, the animals were euthanized with an anesthetic overdose, followed by transcardial perfusion with 4% paraformaldehyde. Their brains were rapidly removed, cryoprotected, and cut into 30-µm thick coronal tissue sections using a cryostat. Brain tissue sections were collected as five series of adjacent sections, which were processed for histological analysis.
For diffusion quantification studies, one series of equally spaced (120 μm) sections covering the entire rostro caudal extent of the striatum were mounted on gelatin-coated slides and cover-slipped with Immu-Mount (Thermo-Shandon). Fluorescence images of each striatum were captured using a Nikon Optiphot-2 microscope with a 4x objective, a digital camera DXM1200 and ACT-1software.
For double immunofluorescence labeling, free-floating tissue sections were pre-incubated in KPBS-1% BSA containing 5% normal donkey serum and 0.03% Triton X-100 for 60 min at room temperature. Tissue sections were then incubated overnight at 4 °C with the corresponding primary antibody: NeuN antibody as a neuronal marker; GFAP, 1:500) as astrocytic marker; and Iba-1; 1:500) as microglial marker. The immunoreaction was visualized with the corresponding fluorescent secondary antibodies: Alexa Fluor 568-conjugated donkey anti-rabbit IgG (1:200) or donkey anti-mouse IgG (1:200). Finally, tissue sections were incubated for 30 min at RT with the DNA-binding dye Hoechst 33342 (1:2000) mounted on gelatin-coated slides, coverslipped with Immu-Mount and were visualized with a confocal laser-scanning microscope (AOBS-SP5X; Leica Microsystems Heidelberg GmbH, Mannheim, Germany).
Quantification of fluorescence images
For diffusion quantification studies, a series of equally spaced (120 μm) sections covering the entire rostrocaudal extent of the striatum (30 μm thickness) were analyzed. The fluorescence area in each consecutive brain slice was precisely outlined and quantified using ImageJ. The total diffusion volume was then calculated using the following formula:
$$\begin&Volume\:of\:distribution\:\left(^\right)\cr &=\mathop \sum \limits^Area\:of\:fluorescence\:\left(^\right)\cr &*150\left(\mu\:m\right)*n\:\:\end$$
Assessment of inflammation in peri-injection regions
To quantitatively assess astrocytic and microglial responses in peri-injection areas, we conducted an immunofluorescence analysis combined with standardized image acquisition and semi-automated quantification. Coronal brain images processed for immunofluorescence for GFAP and Iba1 were acquired using a Nikon optiphot-2 microscope equipped with a Nikon Digital camera DXM 1200. For astrocyte analysis, images were taken at 4× magnification; for microglia, 10× magnification was used. Per animal, a minimum of five non-overlapping fields were selected from anatomically matched peri-injection regions.
Quantification was performed using ImageJ software (NIH, Bethesda, MD, USA). Images were converted to 8-bit grayscale, and a consistent threshold was applied to isolate immunopositive signal. Cell counts were obtained semi-automatically using the ‘Analyze Particles’ function, with defined size and circularity parameters to exclude artifacts and background noise. Data are presented as the number of immunopositive cells per square millimeter (cells/mm²). All image acquisition and analyses were performed by investigators blinded to the experimental groups.
Statistical analysis
All statistical analyses were conducted using GraphPad Prim version 9.3.0. Gaussian distribution was determined using a Shapiro-Wilk test. The differences were considered significant for * p < 0.05, ** p < 0.01, *** p < 0.001, and **** p < 0.0001 with a confidence level of 0.05. The statistical analysis details are provided in the corresponding figure legends.

Comments (0)