Chemical materials
O-Carboxymethyl Chitosan (O-CMCS, Molecular weight in the range of 100–300 kDa, deacetylation degree, 90%; substitution degree 88%, according to the technical sheet) was purchased from DBA (Milan, Italy). D2O, Ethyl-dimethyl-aminopropylcarbodiimide hydrochloride (EDC), dopamine hydrochloride (DA), Quercetin (QUE, free base), DMSO and phosphate buffer saline (PBS) were purchased from Sigma-Aldrich (Milan, Italy). Dialysis tubes with a MWCO 12–14 kDa and 3.5–4.5 kDa were purchased from Spectra Labs (Milan, Italy). Throughout this work, double distilled water was used. All other chemicals used were of reagent grade. Methanol for high-performance liquid chromatography (HPLC) grade was acquired from Levanchimica (Bari, Italy).
Biological materials, cell line and culture
SHSY5Y cells (kindly provided by Dr. Maria Lasalvia, University of Foggia) were grown in Dulbecco’s Modified Eagle’s Medium Nutrient Mixture F-12 Ham (Sigma-Aldrich, Cat# D8062), 20% FBS, 1% non-essential amino acids, 2 mM L-glutamine, 1% penicillin and streptomycin, and 25 µg/mL amphotericin B. Cells were maintained at 37 °C and 5% CO2 in a humidified incubator and the culture medium was refreshed every other day.
MethodsApparatus
Fourier transform infrared (FT-IR) spectra of the conjugates prepared were obtained in KBr discs using a Perkin Elmer 1600 FT-IR spectrometer (Perkin Elmer, Milan, Italy). The range examined was 4,000–400 cm− 1 with a resolution of 1 cm− 1. Proton nuclear magnetic resonance (1H NMR) spectra of the conjugates prepared were recorded on a Bruker spectrometer (Billerica, Massachusetts, US) operating at 600 MHz and the analyses were performed at 293 K on dilute solutions of each conjugate using D2O as solvent. In particular, to allow the determination of the substitution degree of O-CMCS-g-DA via1H-NMR spectrometry, dispersions in D2O were prepared for conjugates at a concentration of 5 mg/mL adding 0.05 mL of HCl 10% in water (v/v) before the analysis. Chemical shifts are reported in parts per million (δ). Spectra were processed using Mnova (Mestrelab Research, A Coruna, Spain). For UV analysis, a Schimadzu 1900i UV-VIS spectrophotometer (Shimadzu, Milan, Italy) was used. Differential Scanning Calorimetry (DSC) runs were conducted using a Q2000 TA instrument (New Castle, DE, US) equipped with a TA Software.
Thermogravimetric analysis (TGA) was carried out on a Perkin-Elmer Pyris 6 TGA instrument in the range 30–600 ◦C under inert nitrogen flow (40 mL/min) at the heating rate of 20 ◦C/min.
HPLC analysis of DA was carried out with an instrument constituted by a Waters Model 600 pump (Waters Corp., Milford, MA), a Waters 2996 photodiode array detector and a 20 µL loop injection autosampler (Waters 717 plus).
The hydrodynamic mean diameters, polydispersity indexes and zeta potential values of O-CMCS-g-DA based polymeric micelles were determined by using a Zetasizer NanoZS, ZEN 3600 (Malvern Instruments, Worcestershire, U.K.) instrument according to photon correlation spectroscopy (PCS) mode.
Synthesis of O-carboxymethylchitosan-grafted-dopamine 1a-d
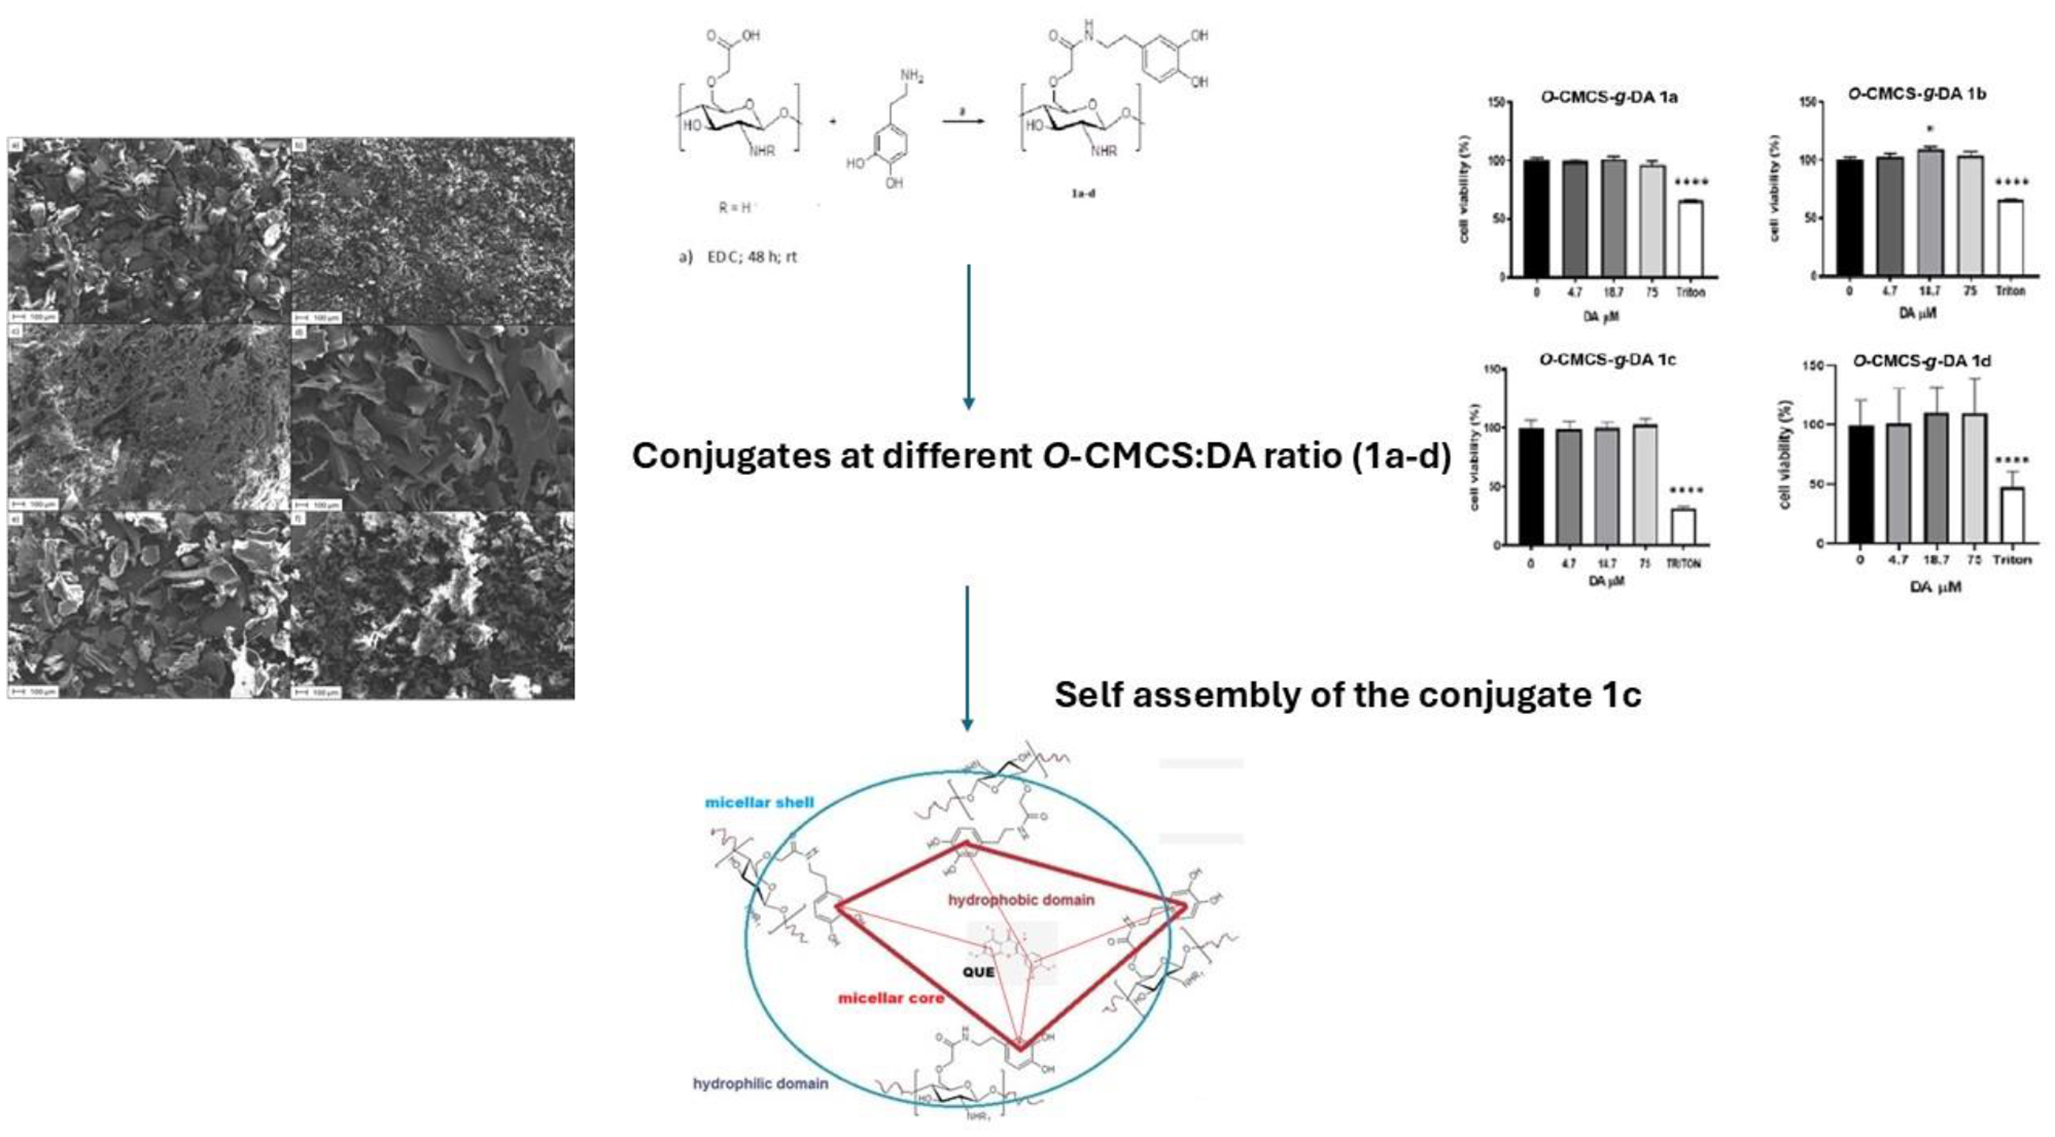
The synthesis of O-CMCS-g-DA conjugates 1a-d was carried out through a carbodiimide mediated reaction in aqueous environment as showed in Scheme 1 and using the protocol described in the previously work [17]. Briefly, as for the preparation of conjugate 1a, to a solution at pH 6 constituted of diluted HCl (0.1 N, 50 mL), 200 mg of O-CMCS were added, afterwords DA (200 mg) and EDC (50 mg) were also put in the reaction mixture. This last was left under magnetic stirring and under argon atmosphere for 48 h at room temperature (r.t.). Afterwards, the product was dialyzed in distilled water for three days and then lyophilized (Lio Pascal 5P, Milan Italy) and the obtained product (i.e., O-CMCS-g-DA conjugate 1a) was collected. Conjugates 1b-d were similarly prepared. Conjugates 1a-c after lyophilization were obtained as powders, while conjugate 1d was obtained as sponge-like solid.
Characterization of O-carboxymethylchitosan-grafted-dopamine conjugates 1a-d
The characterization of O-CMCS-g-DA amphiphilic polymers was performed by FT-IR, 1H-NMR, degree of substitution (DS), TGA, DSC, SEM microscopy and, for the conjugate at highest DS 1c only, by critical micelle concentration (CMC) evaluation.
Determination of substitution degree (DS) of each O-CMCS-g-DA conjugates 1a-d by 1H-NMR spectroscopy, or by hydrolysis under strong acidic or basic conditions
The percentage of monomeric units substituted with DA (DAsubst) (i.e. DS value), was determined by 1H-NMR spectroscopy comparing the integral of the signals in the aromatic region (6.55–7.25 ppm) with that of the multiplets in the region 3.22–4.50 ppm. The latter region accounts for the H3, H4, H5, and 2 × H6 protons for both O-CMCS bonded with DA and free O-CMCS. The calculation used the following Eq. (1):
$$}}_}}}}}}_}}}}} \over }}_}\,}\,}\,}}}}}$$
(1)
where IntegralH−Ar is the sum of the integrals for the signals in the region 6.55–7.25 ppm divided by three, and IntegralH3,H4,H5,H6 is the intensity of the signals for H3, H4, H5, and both H6 protons. All the determinations of DS by 1H-NMR spectroscopy were carried out on each 1a-d conjugates in triplicate and the obtained results are reported in as mean ± standard deviation (SD).
According to the hydrolysis under strong acidic conditions previously described [19], DS% in DA of each O-CMCS-g-DA conjugate 1a-d was also measured. Briefly, 2 mg of each O-CMCS-g-DA conjugate were weighed and dissolved in HCl 1 N (pH 1) under stirring and light protection at r.t. for 3 h. Then, the solution was centrifuged (16,000× g, for 45 min, Eppendorf 5415D, Germany) and the obtained supernatant was analysed by HPLC to obtain the DA amounts. The DS% was calculated as mg DA/mg O-CMCS-g-DA conjugate x 100 [19]. All the determinations of DS by hydrolysis under strong acidic conditions were carried out on each 1a-d conjugates in triplicate and the obtained results are reported in as mean ± SD.
In the case of O-CMCS-g-DA conjugate 1c, the substitution degree (DS) was also determined by potentiometric titration after alkaline hydrolysis according to a procedure previously described with slight modification [20, 21]. O-CMCS-g-DA conjugate 1c (50 mg) was dissolved in 5 mL of a solution 0.25 N of NaOH in ethanol and the mixture was stirred at reflux for 24 h. Then, at r. t. an acid-base potentiometric titration on the dark-yellow mixture (1 mL) was performed by the use of the automatic titrator (TITREX-1000, Wertheim, Germany) with a pH meter employing a standardized solution of HCl (0.1 N). The potentiometric titration was carried out in triplicate.
During titration, two equivalent points were determined. The first point referred headline in excess of NaOH (V1 equivalent point); the second equivalent point referred to the neutralization of the acid salt present (V2 equivalent point). The moles of HCl occurring between the first and the second equivalent point corresponding to the moles of free amide and the DS% were, therefore, determined by the following Eq. (2):
$$}\left[ }\left(}} \right)}\left(}} \right)} \right]}\left(}} \right)$$
(2)
where mass (sample) corresponds to 1 mL (10 mg) of each conjugate sample before alkaline hydrolysis; moles of free amide are equal to: (V2 equivalent point - V1 equivalent point) x [HCl] determined by potentiometric titration as the average of three titrations.
Thermal analysis
Thermal analysis on the herein examined conjugates encompassed both studies of TGA and DSC.
Thermogravimetric analysis (TGA) was carried out on a Perkin-Elmer Pyris6 TGA instrument in the range 30–600 ◦C under inert nitrogen flow (40 mL/min) at the heating rate of 20 ◦C/min. For each sample, after weighting 5–10 mg, thermograms (TG) and corresponding derivative curves (DTG) were elaborated with the TGA Pyris software (version 8.0.0.0172 Waltham, USA) before plotting.
Differential Scanning Calorimetry (DSC) runs were conducted using a Q2000 TA instrument (New Castle, DE, US) equipped with a TA Software. Aliquots of about 5 mg of each analyte (i.e., pure DA, pure O-CMCS, O-CMCS-g-DA conjugates at different w/w ratios) were placed in an aluminum pan and hermetically sealed. The scanning rate was set at 5 °C/min under a nitrogen flow of 50 cm3/min and the temperature range was from 25 to 320 °C. The calorimetric system was calibrated in transition temperature by using indium (99.9% purity) and following the procedure of the TA Software. Each DSC thermogram was acquired in triplicate to check the reproducibility.
Morphology of O-CMCS-g-DA conjugates 1a-d by SEM analysis
The morphology of the 1a-d conjugates and controls DA and O-CMCS was analysed by scanning electron microscopy (SEM) coupled with energy dispersive X-ray spectroscopy (EDX) using a Zeiss Σigma 300VP electron microscope equipped with an Oxford C-MaxN SDD detector with an active area of 20 mm2. Prior to the analysis, a metallization with gold was carried out on all samples. To enhance conductivity and prevent charging artifacts during SEM imaging, gold for sputter coating was selected, due to its excellent electrical conductivity and chemical inertness, which also preserves the sample morphological details. In details, all tested 1a-d conjugates and controls DA and O-CMCS were subjected to gold sputtering layer using a Quorum Q150R ES sputter coater. The process was conducted in a high-purity (99.998%) nitrogen atmosphere.
In vitro DA release from O-CMCS-g-DA conjugates 1a-d in simulated nasal fluid (SNF)
In view of an intranasal administration, the in vitro DA release in SNF [22] (pH 6.0, without enzymes) from all tested conjugates was carried out starting from a weighted amount of each conjugate corresponding to 1-1.2 mg of DA and dispersing it in 2.5 mL of SNF containing 0.05% (v/v) of DMSO. The assay was performed at 37 ± 0.1 °C in an agitated (40 rpm/min) water bath (Julabo, Milan, Italy) for 14 days. At scheduled time points, 0.25 mL of the receiving medium were withdrawn and replaced with 0.25 mL of fresh medium. Then, each sample was centrifuged at 16,000 × g for 45 min, (Eppendorf 5415D, Germany), and the amounts of the delivered DA were quantified in the resulting supernatants by HPLC, as below described, and plotted against the time. All the release experiments in SNF were carried out in triplicate for each conjugate.
The DA quantitative determination was performed by HPLC apparatus above mentioned and employing the previously reported conditions [23, 24]. Briefly, the mobile phase was formed by 0.02 M potassium phosphate buffer, pH 2.8: CH3OH 70:30 (v/v), and the elution of the column in isocratic mode occurred at the flow rate of 0.7 mL/min. Data were processed by the Empower™ Software Build. For analysis, the stationary phase was a Synergy Hydro-RP (25 cm 4.6 mm, 4 μm particles; Phenomenex, Torrance, CA) column in conjunction with a precolumn C18 insert. Standard calibration curves for DA determination were obtained at 280 nm wavelength dissolving DA in the eluent above mentioned. Under such chromatographic conditions, DA retention time was of 5.5 min, whereas the retention time of the examined conjugates was of 4.9 min.
For O-CMCS-g-DA conjugate 1c, the in vitro DA release was also carried out in PBS (pH 7.2) over 7 days upon the same conditions above described for the assay in SNF.
Preparation of unloaded O-CMCS-g-DA micelles from O-CMCS‐g-DA conjugate 1c
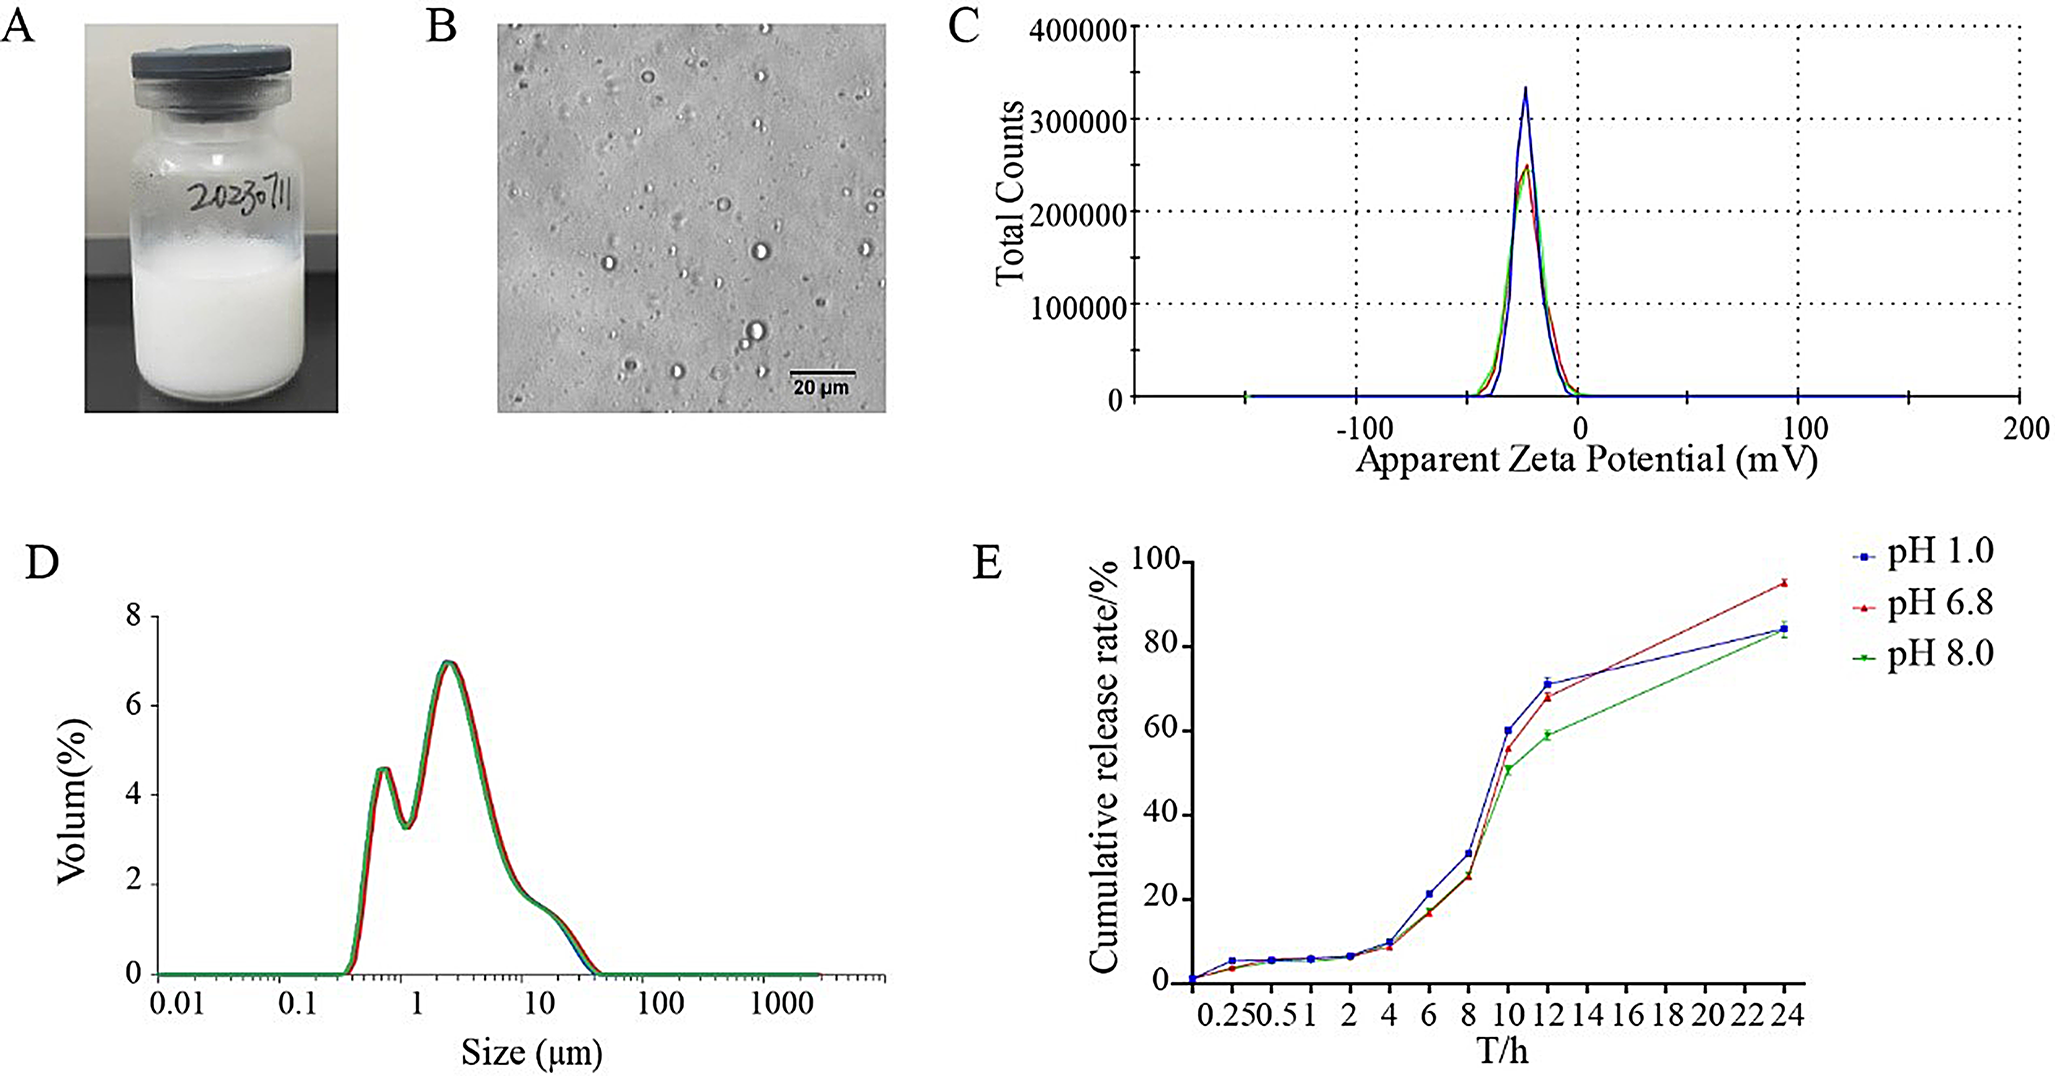
Unloaded polymeric micelles starting from O-CMCS-g-DA conjugate 1c were prepared according to the dialysis method [25,26,27]. Briefly, 20 mg of the O-CMCS-g-DA conjugate 1c were dispersed in 20 mL of SNF under stirring at r.t. for 24 h. Then, the mixture was introduced in a dialytic bag (MWCO 3.5–4.5 KDa) and let to dialyze against double distilled water over 48 h. Once finished, the mixture in the dialysis bag was centrifuged at 13,200 rpm for 45 min (Eppendorf 5415D, Germany) and the pellet was discarded, the corresponding supernatant was isolated to measure particle size and zeta potential values by using the ZetasizerNanZS (ZEN 3600, Malvern, UK) apparatus. Particle size and polydispersion index (PDI) values of the unloaded O-CMCS-g-DA micelles were measured at 25 °C by redispersing each of them in 1 mL of double distilled water followed by a brief sonication. Then, the samples underwent to a further dilution in double distilled water (1:20, v/v) prior to be analyzed for particle size. For zeta-potential measurements laser Doppler anemometry technique was adopted (ZetasizerNanoZS, ZEN 3600, Malvern, UK) by using the same dilution as above described for size analysis.
Determination of the critical micelle concentration (CMC) for the O-CMCS-g-DA conjugate 1c
The CMC of the O-CMCS-g-DA conjugate 1c was determined by conductimetric titration (CON110/Handheld Conductivity/TDS/Temperature/RS232C Meter; Eutech Instruments, Thermo Fisher Scientific, Milan, Italy) performed at 25 °C [28, 29]. The procedure is based on the conductivity measurement of various conjugate concentrations in double distilled water in the range between 1 × 10− 2 and 1 × 10− 7 mg/mL. The CMC corresponds to the concentration at which there is an abrupt change of slope of the curve plotted by the specific conductivity against the logarithm of the concentration of the conjugate.
Preparation of quercetin-loaded O-CMCS-g-DA micelles from O-CMCS‐g-DA conjugate 1c
As above, 20 mg of the O-CMCS-g-DA conjugate 1c were dispersed in 20 mL of SNF under stirring at r.t. for 24 h. Once the O-CMCS-g-DA conjugate 1c mixture filled, as above, the dialysis bag, it was let to dialyze over 48 h versus a medium composed of ethanol: water 1:1 (v: v) containing QUE at the concentration of 1 mg/mL. Afterwords, once dialysis was finished, the mixture in the dialysis bag was centrifuged, as above, in order to isolate QUE-loaded O-CMCS-g-DA conjugate 1c based micelles. Particle size and polydispersion index (PDI) values of QUE-loaded O-CMCS-g-DA micelles were measured at 25 °C by diluting them in double distilled water (1:20, v/v) prior to be analyzed for particle size by PCS.
Quantitative determination of quercetin
The quantitative determination of QUE was carried out by spectrophotometric analysis using a calibration curve obtained by dissolving QUE in ethanol (concentration range 11–0.11 µg/mL, R2 > 0.999). The measurements were performed at the wavelength of 375 nm. The encapsulation efficiency of QUE in the conjugate O-CMCS-DA 1c based micelles (E.E.%) was calculated by Eq. (3):
$$\eqalign}}} \cr & }\,}\,}\,}\,}\,}\,}\,} \cr} $$
(3)
where total QUE is intended as the starting amount of the antioxidant. The study was performed in triplicate.
Biocompatibility evaluation of O-CMCS-g-DA conjugates 1a-d with SH-SY5Y cell model line
SH-SY5Y cells were grown as previously described [30]. Briefly, cells were plated in a 96-well plate (BD, USA) at a density of 1 × 10⁴ per well in 100 µL of complete medium and incubated overnight to allow cell attachment. Then, the culture medium was replaced with 100 µL of fresh medium containing different dilutions of O-CMCS-g-DA conjugates 1a-d (final concentrations of DA: 75 µM, 18.75 µM and 4 µM). In each experiment, untreated cells were used negative controls, whereas 1% Triton-X100-treated cells were used as a positive control. Under these conditions cells were grown at 37 °C for 24 h. After treatments, cell viability was evaluated by MTT (3-(4,5-dimethylthiazol-2-yl)-2,5 diphenyl tetrazolium bromide), as previously described [22]. The cell viability was calculated as follows:
%viability = [(Optical density of treated cell – OD of blank)/(OD of vehicle control – OD of blank)×100 ], considering untreated cells as 100%.
Cytokines detection by quantitative real time-PCR (qRT-PCR)
SH-SY5Y cells were plated in a 6-well plate (Vazyme, Red Maple Hi-tech Industry Park, Nanjing, PRC, Cat# CCP01006) at a density of 5 × 10⁵ per well in 2 mL of complete medium and incubated overnight to allow cell attachment. Then, the culture medium was replaced with 2 mL of fresh medium containing different O-CMCS-g-DA conjugates 1a, 1b, 1c and 1d at the final concentration of dopamine 75 µM, corresponding to 11.5 µg/mL. Under these conditions cells were grown at 37 °C for 24 h. After treatments, RNA extraction was performed using the standard TRIzol reagent method (Thermo Fisher Scientific, Waltham, MA, USA, Cat# 15596018), following the manufacturer’s recommended protocol. Subsequently, RNA concentration and quality were evaluated using the NanoDrop 1000 spectrophotometer (Thermo Fisher Scientific, Italy). The absorbance ratio at OD260/OD280 was employed to assess RNA purity. Reverse transcription was performed using a High-Capacity cDNA Reverse Transcription Kit (Thermo Fisher Scientific, Cat# 4366596) according to the manufacturer’s instructions. TaqMan-based real-time PCR reactions were performed using AceQ Universal U + Probe Master MiX V2 (Vazyme, Cat# Q513-02) and TaqMan probes (ThermoFisher Scientific, Cat# 4331182, Italy) according to the manufacturer’s instructions, with the following program: (i) 37 °C for 10 min; (ii) 95 °C for 5 minutes; (iii) 95 °C for 10 s and 60 °C for 30 s, repeated for 45 cycles. Real-time PCR reactions were carried out in duplicate for each sample using 96-well plates and the reactions were performed on the ABI-PRISM 7300 instrument (PE Applied Biosystems, Waltham).
Relative quantification was conducted using the comparative 2 − ΔΔCt method, with β-actin serving as a normalizer. A list of genes with the relative primers code is reported in Table 1.
Table 1 Probes used for qRT-PCRStatistical analysis
Statistical analyses were carried out by Prism v. 5, GraphPad Software Inc., USA. Results were expressed as mean ± SD. Multiple comparisons were based on one-way analysis of variance (ANOVA) with Bonferroni or Tukey post hoc test and differences were considered significant when p < 0.05.

Comments (0)