
Remember me
Between June 2019 and April 2020, 3672 patients were registered from 612 Japanese facilities nationwide (Fig. S1 in the electronic supplementary material). In total, 3610 patients were included in the safety analysis set (excluding patients who violated registration [n = 16] and patients without any follow-up visits [n = 39]). The efficacy analysis set comprised 3462 patients, excluding 148 patients without efficacy data. Most patients (2921/3610; 80.9%) completed the 24-month observation period. The observation period (mean ± SD) was 94.1 ± 27.9 weeks and the main reason for treatment discontinuation was loss to follow-up (Table S2 in the electronic supplementary material).
Baseline patient characteristics of the safety analysis set are shown in Table 1; 68.1% of patients were male, mean age was 60.8 years, mean BMI was 26.6 kg/m2, 37.8% of patients had previously received another therapeutic agent for dyslipidemia before switching to pemafibrate (defined as the switched group), and secondary prevention was 12.9%. Comorbidities included hypertension in 67.5%, diabetes in 52.8%, hepatic dysfunction in 34.0%, and renal dysfunction in 15.4% of patients. Concomitant drugs were prescribed for dyslipidemia at baseline in 41.1% of patients, including statins in 31.7%, ezetimibe in 9.4%, and polyunsaturated fatty acids in 6.5%. At the time of treatment initiation, pemafibrate was prescribed at 0.1 mg/day in 7.9% of patients, 0.2 mg/day in 87.5%, and 0.4 mg/day in 4.5%. The TG level (mean ± SD) at baseline was 382.0 ± 317.6 mg/dL in the mixed state of fasting and non-fasting. The LDL-C level (mean ± SD) was 109.1 ± 34.3 mg/dL at baseline.
Table 1 Baseline patient characteristics (safety analysis set)SafetyIn total, 147 patients experienced ADRs (187 events); the incidence was 4.07% (Table 2). According to the SOC, abnormalities in laboratory tests were most common (n = 60; 1.66%), followed by hepatobiliary disorders (n = 24, 0.66%), musculoskeletal and connective tissue disorders (n = 14, 0.39%), and metabolic and nutritional disorders (n = 14, 0.39%) (Table S3 in the electronic supplementary material). The most frequent PT components were blood CPK increased and glycosylated hemoglobin increased, both in 14 patients (0.39%), followed by cholelithiasis in 11 patients (0.30%). Fourteen serious ADRs were reported in 8 patients (0.22%). Serious ADRs became mild or had recovered in 7 patients; one patient who had experienced emphysema complicated by pulmonary fibrosis did not recover.
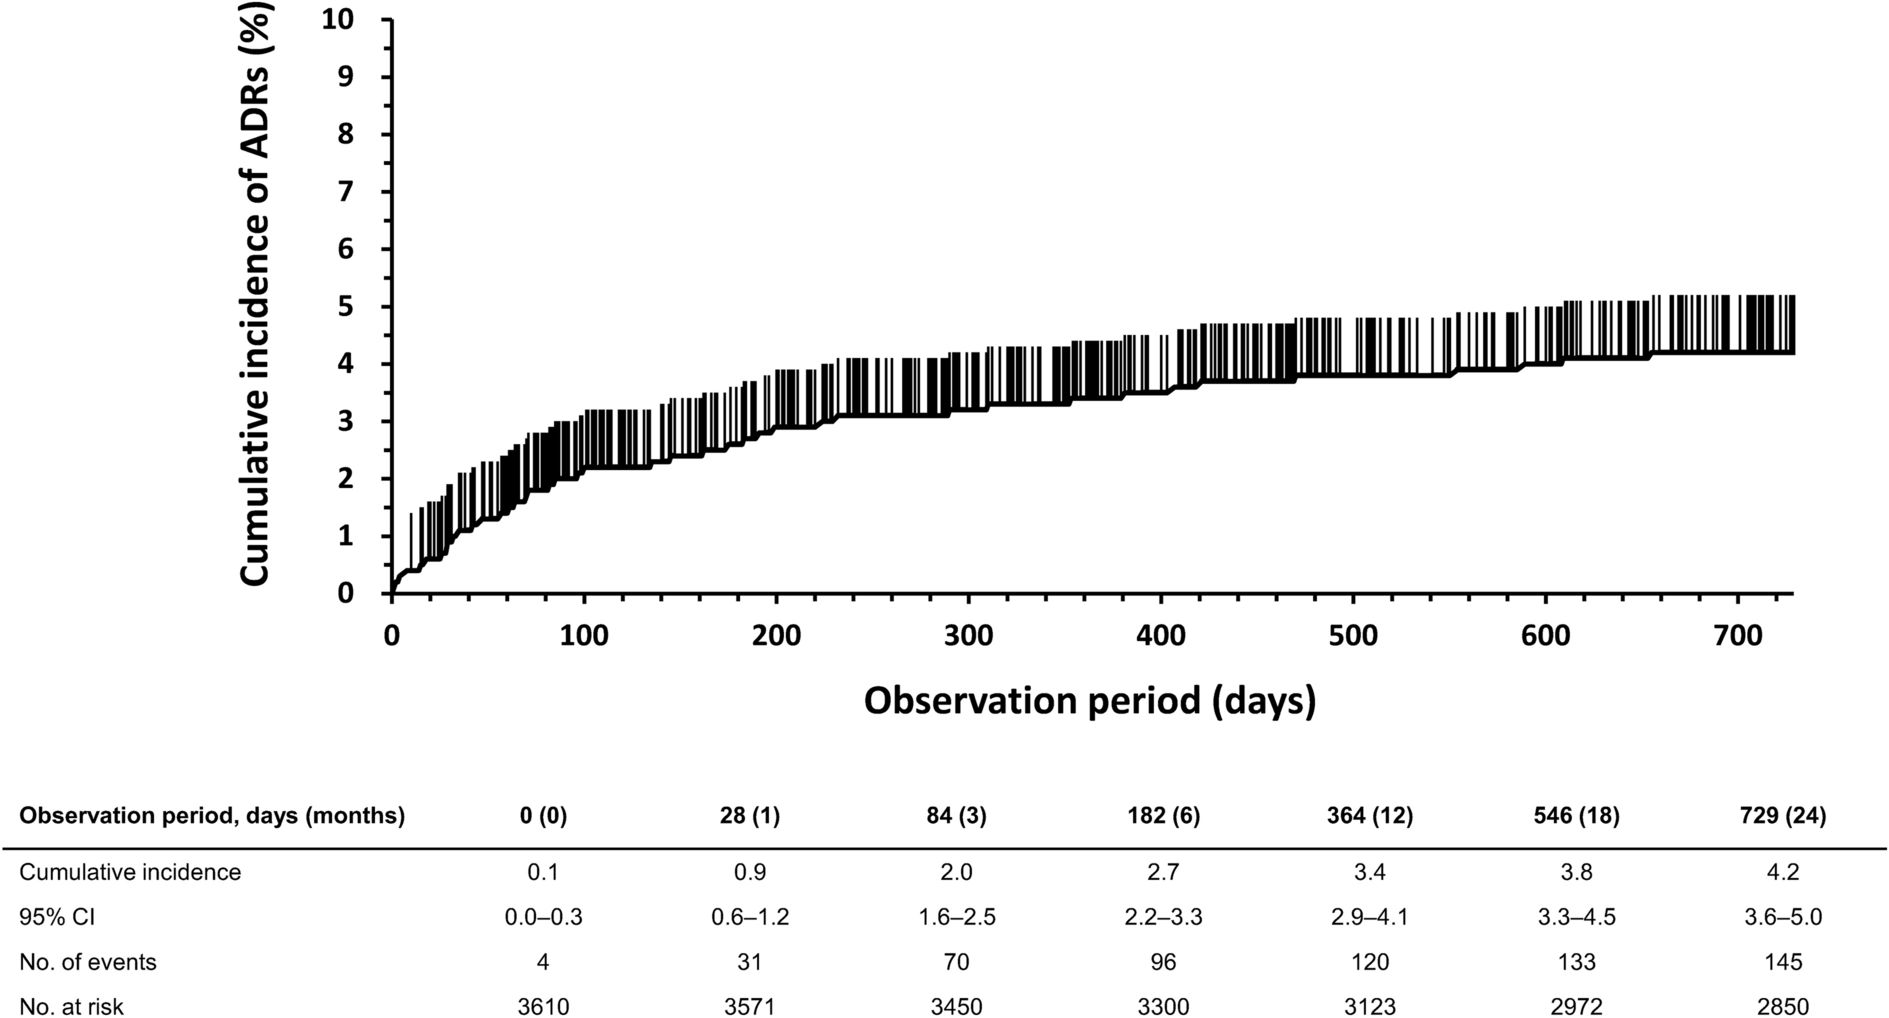
Table 2 Incidence of adverse drug reactions (ADRs) by subgroup analysisOf the 105 patients who had discontinued administration because of AEs, 60 patients (1.66%) had experienced ADRs as deemed by study physicians, of which the major PTs were myalgia (n = 7; 0.19%), blood CPK increased (n = 7; 0.19%), pruritus (n = 6; 0.17%), cholelithiasis (n = 6; 0.17%), dyspepsia (n = 3; 0.08%), and renal impairment (n = 3; 0.08%). The cumulative incidence of ADRs in days is shown in Fig. 1. The cumulative incidence of ADRs was high for the first 3 months of treatment, and then slowed down.
Fig. 1
Time course of the cumulative incidence of adverse drug reactions (ADRs). CI confidence interval
Although rhabdomyolysis did not occur in this study, 37 (1.02%) patients experienced rhabdomyolysis-related ADRs, including blood CPK increased (n = 14; 0.39%), myalgia (n = 8; 0.22%), renal impairment (n = 6; 0.17%), glomerular filtration rate (GFR) decreased (n = 4; 0.11%), blood creatinine increased (n = 3; 0.08%), myositis (n = 1; 0.03%), and muscle weakness (n = 1; 0.03%) (Table S3 in the electronic supplementary material). Elevation of LDL-C was observed in 10 patients (0.28%) following laboratory testing and in 1 patient (0.03%) who had developed hypercholesterolemia. Renal-related ADRs occurred in 13 patients (0.36%); renal impairment in 6 patients (0.17%), GFR decreased in 4 patients (0.11%), and blood creatinine increased in 3 patients (0.08%). We also investigated ADRs that were observed as AEs in the PROMINENT trial [15]; CKD, AKI, DN, VTE, PE, and DVT did not occur.
Table 2 shows the incidence of ADRs subdivided by patient characteristics, concomitant disease and drugs, and the dosage of pemafibrate at baseline. The subgroup analysis of ADR by patient age showed that ADRs occurred in 5.8% (33/571) of patients ≥ 75 years old and 3.8% (114/3039) of those < 75 years old. In the subgroup analysis of pemafibrate daily dose at baseline, the percentage of patients who experienced ADRs was 5.6% (16/285) in patients on a dose of pemafibrate 0.1 mg/day, 4.1% (128/3159) in those on pemafibrate 0.2 mg/day, and 1.8% (3/164) in those on pemafibrate 0.4 mg/day. The percentage of patients with ADRs according to their concomitant disease at presentation was 3.2% (39/1229) with hepatic impairment, 4.5% (108/2381) without hepatic impairment, 5.6% (31/557) with renal impairment, and 3.8% (116/3053) without renal impairment. The number of patients with ADRs according to the presence or absence of prior drugs for hyperlipidemia was 4.7% (54/1144) with statins, 3.8% (93/2466) without statins, 4.7% (16/339) with ezetimibe, and 4.0% (131/3271) without ezetimibe. When subdivided by baseline eGFR, the number of patients with ADRs according to CKD severity classification in each subgroup was 3.3% (17/519) in G1 (eGFR ≥ 90 mL/min/1.73 m2), 4.3% (78/1830) in G2 (eGFR ≥ 60 to < 90 mL/min/1.73 m2), 4.8% (43/905) in G3 (eGFR ≥ 30 to < 60 mL/min/1.73 m2), and 5.4% (2/37) in G4 and 5 (eGFR < 30 mL/min/1.73 m2). There were no significant differences in the frequency of ADRs by patient characteristic or parameter other than age.
Table S4 in the electronic supplementary material shows the changes in safety parameters in the safety analysis set at baseline, after 24 months, and at the last observation carried forward (LOCF). There were no significant changes in CPK throughout the study period. There were significant decreases in AST, ALT, γ-GT, and total bilirubin. After 24 months and at the LOCF, significant increases in SBP and decreases in DBP were noted. The eGFR transition from baseline to 24 months and at the LOCF is shown in Fig. S2 of the electronic supplementary material.
EfficacyMixed TG levels, including fasting and non-fasting values (mean ± SD), decreased from 380.5 ± 302.7 mg/dL at baseline to 232.0 ± 214.2 mg/dL after 1 month, and then fluctuated slightly, reaching the numerically lowest value of 200.4 ± 184.2 mg/dL (− 36.1%, P < 0.001) after 24 months (Table S5 in the electronic supplementary material; Fig. 2). The HDL-C and LDL-C levels (mean ± SD) both increased significantly from 47.2 ± 12.9 mg/dL and 109.2 ± 34.3 mg/dL at baseline to 51.6 ± 14.1 mg/dL and 111.1 ± 31.1 mg/dL at the LOCF (% changes were 11.4%, P < 0.001 and 9.3%, P < 0.001), respectively. TC and non-HDL-C levels decreased significantly by − 4.9% (P < 0.001) and − 7.0% (P < 0.001) at the LOCF, respectively.
Fig. 2
Changes in serum triglyceride levels at baseline, months 1, 3, 6, 12, 18, and 24, and at the last observation carried forward (LOCF). One-sample t tests were performed for percent changes before administration and at each measurement point. P < 0.001 at each time point. SD standard deviation, TG triglyceride
The change from baseline to LOCF in mixed TG in patients who had received prior treatment for dyslipidemia (switched group) was − 20.8 ± 51.2% (Table S6 of the electronic supplementary material), and for those who received additional pemafibrate (add-on group) it was − 44.1 ± 37.1%. Mixed TG change at the LOCF was − 37.3 ± 39.9% and − 34.3 ± 46.4% in patients with and without statins at baseline, respectively; mixed TG levels were significantly reduced in both these groups. We observed that the higher the baseline TG, the greater the rate of TG decrease. According to baseline LDL-C levels, LDL-C increased significantly in the baseline LDL-C < 140 mg/dL group and decreased significantly in the baseline LDL-C ≥ 140 mg/dL groups (Table S7 of the electronic supplementary material).
Comments (0)