
Remember me
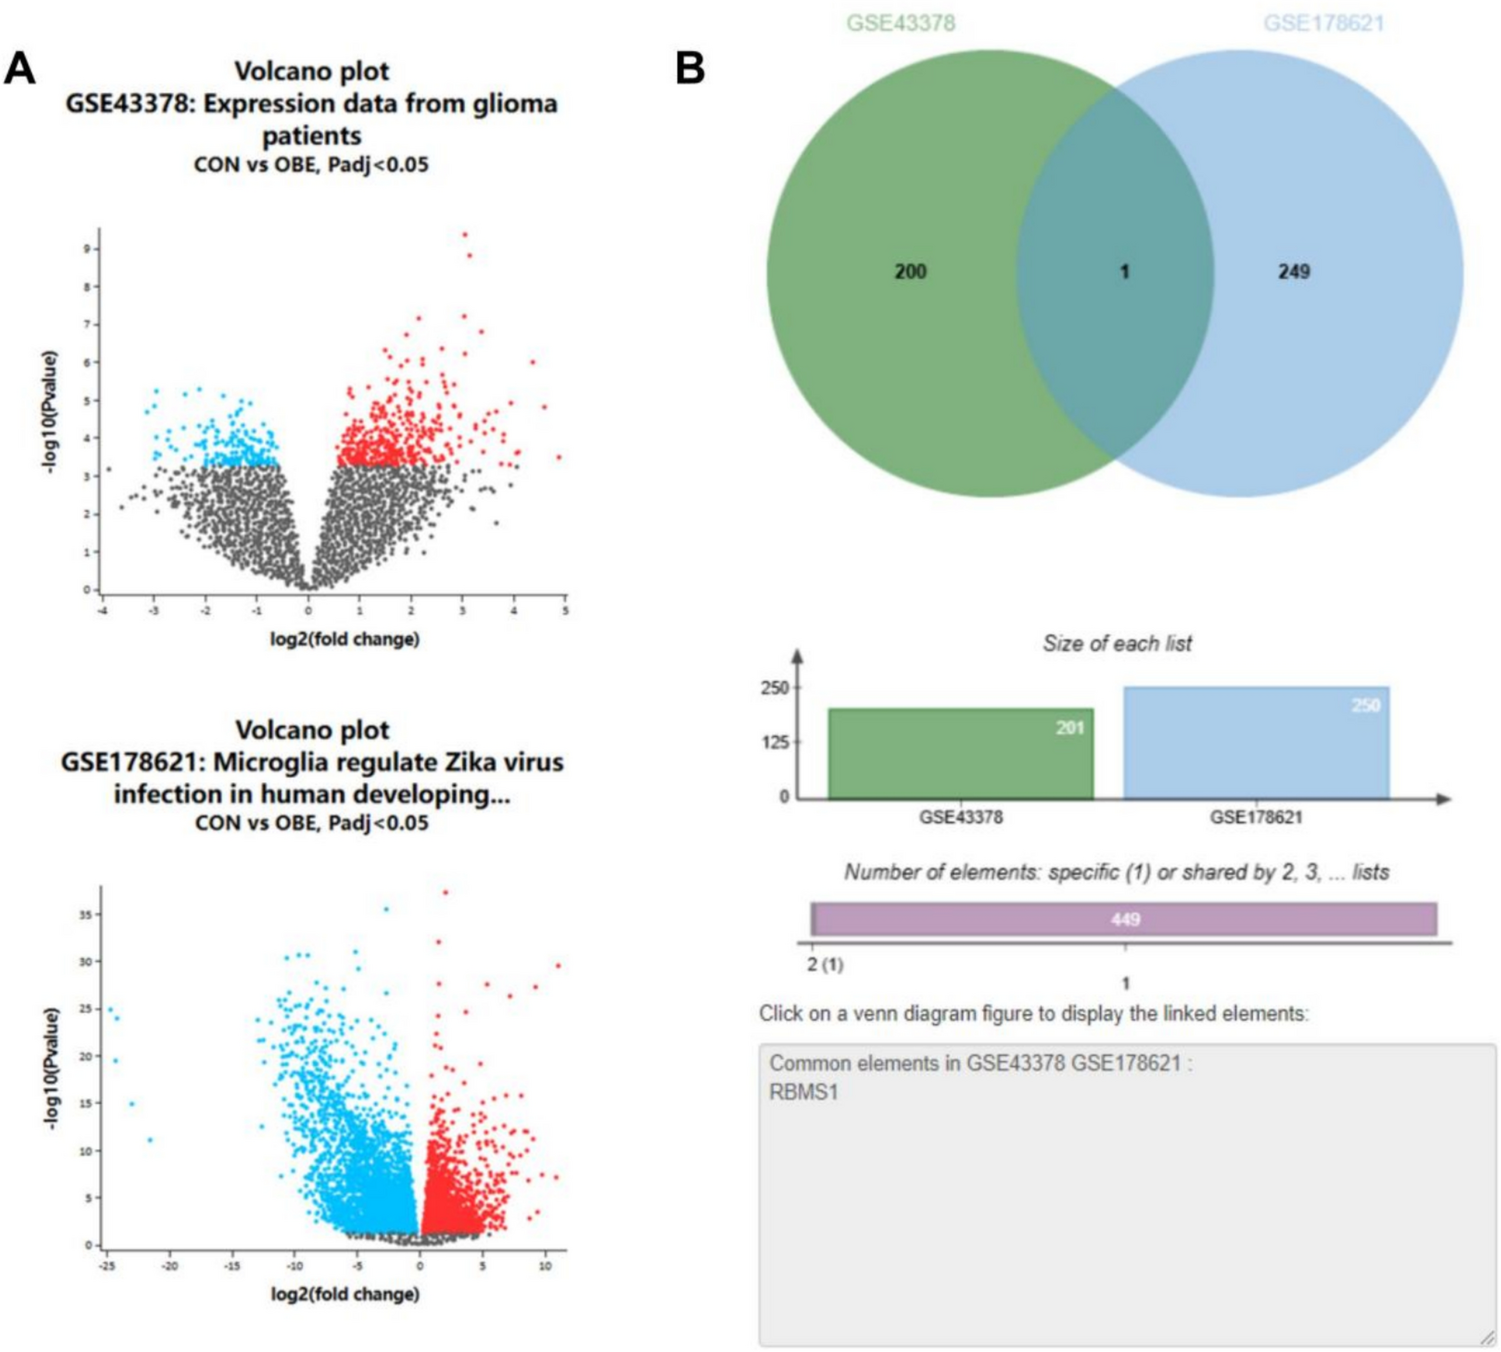


To identify immune infiltration-related genes associated with glioma prognosis, transcriptomic datasets GSE43378 and GSE178621 (Table S1-S2) were retrieved from the GEO database using the search terms “glioma” and “single-cell immune infiltration”. Differential expression analysis with thresholds of P < 0.05 and|logFC) > 1 revealed a single statistically significant DEG, RBMS1, through intersection analysis of both datasets (Fig. 1A-B).
Fig. 1
Identification of glioma-associated DEGs. Note: A Volcano plots showing DEGs in GSE43378 and GSE178621 datasets. Genes with|log₂FC|> 1 and adjusted P < 0.05 were considered significant. Red dots indicate upregulated genes, blue dots indicate downregulated genes; B Venn diagram demonstrating the overlap between the two datasets, with RBMS1 identified as the only intersecting DEG
RBMS1 expression in gliomasTo validate the aberrant expression of RBMS1 in gliomas, further analysis was conducted using the TCGA and GEPIA databases. Both platforms consistently demonstrated significant upregulation of RBMS1 in glioma tissues compared to normal brain tissues (Fig. 2A-B).
Fig. 2
Aberrant overexpression of RBMS1 in gliomas. Note: A Differential RBMS1 expression in gliomas versus normal tissues from TCGA (Normal, n = 5; Tumor, n = 156); B Independent validation using GEPIA (Normal, n = 207; Tumor, n = 163). Both analyses revealed significantly increased RBMS1 levels in gliomas (P < 0.05)
Impacts of differential RBMS1 expression on RFS and OS in glioma patientsTo evaluate the prognostic impact of RBMS1 in gliomas, K-M survival analysis was performed using the GEPIA database. The analysis revealed no significant difference in OS between patients with high RBMS1 expression and those with low expression (P > 0.05). However, RFS was significantly shorter in the high RBMS1 expression group compared to the low-expression cohort (P = 0.018), as seen in Fig. 3A-B.
Fig. 3
Associations of RBMS1 expression with overall survival (OS) and relapse-free survival (RFS) in glioma patients. Note: Kaplan–Meier survival curves showing A overall survival (OS) and B relapse-free survival (RFS) stratified by RBMS1 expression using GEPIA. Higher RBMS1 expression was associated with shorter RFS (P = 0.018), but not with OS (P > 0.05)
Expression profiling of RBMS1 across pan-cancer typesPan-cancer analysis revealed that RBMS1 exhibited low expression levels or no significant alterations across most cancer types. Strikingly, RBMS1 expression was markedly elevated in GBM, a highly aggressive glioma subtype (Fig. 4).
Fig. 4
Pan-cancer expression profile of RBMS1. Note: Analysis of RBMS1 expression across multiple tumor types using the UALCAN portal. RBMS1 showed notable overexpression in glioblastoma (GBM) compared to other cancers
Correlation of TISIDB with immune cell infiltrationSubsequent analysis using the TISIDB revealed significant positive correlations between RBMS1 expression and immune cell infiltration in gliomas. Specifically, RBMS1 levels positively correlated with infiltration of T effector memory CD4+ T cells (Tem-CD4; r = 0.255, P = 0.001), immature dendritic cells (iDCs; r = 0.311, P < 0.001), T central memory CD8+ T cells (Tcm-CD8; r = 0.464, P < 0.001), Tregs (r = 0.461, P < 0.001), NKTs (r = 0.505, P < 0.001), and Th1 (r = 0.451, P < 0.001) (Fig. 5A-G). These findings suggest that RBMS1 may play a pivotal role in glioma occurrence and progression by modulating tumor-associated immune infiltration, highlighting its potential as a prognostic biomarker.
Fig. 5
Correlation between RBMS1 expression and immune cell infiltration in gliomas via TISIDB. Note: A Heatmap illustrating the correlation between RBMS1 expression and various immune cell subtypes across cancers via TISIDB. B–G Scatter plots showing moderate positive correlations between RBMS1 expression and infiltration of Tem-CD4⁺ cells, iDCs, Tcm-CD8⁺ cells, Tregs, NKTs, and Th1 cells in gliomas (r = 0.255–0.505, all P < 0.001)
Correlation between the target DEG RBMS1 and immune checkpoint molecules, costimulatory genes, and chemokinesUsing the GEPIA database, we analyzed the correlations between RBMS1 expression and several key immune-related genes, including immune checkpoint molecules (PDCD1 [PD-1], CD274 [PD-L1], CTLA4, LAG3, TIGIT, and HAVCR2 [TIM-3]), costimulatory genes (CD28, TNFRSF9 [4-1BB], and ICOS), and chemokines (CXCL9, CXCL10, and CCL5). The results revealed significant positive correlations between RBMS1 and PDCD1 (r = 0.27, P < 0.001), CD274 (r = 0.38, P < 0.001), CTLA4 (r = 0.32, P < 0.001), LAG3 (r = 0.16, P < 0.05), and TIGIT (r = 0.25, P < 0.01); as well as CD28 (r = 0.41, P < 0.001), TNFRSF9 (r = 0.47, P < 0.001), and ICOS (r = 0.34, P < 0.001); and chemokines CXCL9 (r = 0.21, P < 0.01), CXCL10 (r = 0.24, P < 0.01), and CCL5 (r = 0.35, P < 0.001) (Fig. 6A-C). These bioinformatic findings suggest that RBMS1 may be involved in the activation of immune regulatory networks. Furthermore, they reinforce the strong association between RBMS1 and immune cell infiltration, indicating a potential immunomodulatory role for RBMS1 in the tumor microenvironment.
Fig. 6
Correlation between the target DEG RBMS1 and immune checkpoint molecules, costimulatory genes, and chemokines. Note: Correlation analyses of RBMS1 with immune checkpoint molecules (A), costimulatory genes (B), and chemokines (C) (both P < 0.05)
RBMS1 expression in clinical specimensIn clinical specimen analysis, the positive expression rate of RBMS1 was significantly higher in the glioma group compared to the control group (59.39% vs. 16.13%, χ2 = 33.822, P < 0.001; Table 1). This pronounced differential expression underscores a potential association between RBMS1 dysregulation and glioma pathogenesis, suggesting its candidacy as a diagnostic biomarker or therapeutic target.
Table 1 Expression of RBMS1 in clinical specimensAssociation of RBMS1 with clinicopathological characteristics in glioma patientsThe expression of RBMS1 exhibited significant associations with clinically aggressive features in glioma patients. Specifically, RBMS1 positivity strongly correlated with higher WHO grades (P < 0.001) and increased distant metastasis rates (P = 0.021). Among RBMS1-positive patients, grade III / IV gliomas accounted for 75.51% of cases compared to 41.79% in the RBMS1-negative group, while distant metastasis rate was markedly elevated (30.62% vs. 14.93%, respectively). In contrast, no significant correlations were observed between RBMS1 expression and patient age (P = 0.449), sex (P = 0.673), tumor diameter (P = 0.732), extent of resection (P = 0.164), tumor location (P = 0.799), differentiation status (P = 0.102), or histological subtype (P = 0.241). (Table 2) These findings suggest that RBMS1 predominantly influences glioma malignancy and metastatic progression, with pronounced effects in high-grade tumors.
Table 2 Association between RBMS1 expression and clinicopathological characteristics in glioma patients [Mean ± SD, n (%)]Prognostic significance of RBMS1 in glioma patientsAmong 165 glioma patients followed for 3 years postoperatively, 84 deaths were recorded, yielding a 3-year OS rate of 49.09% (81/165). K-M survival analysis demonstrated significantly worse outcomes in patients with RBMS1-positive expression compared to the RBMS1-negative group: 3-year OS rates were 34.69% (34/98) and 70.15% (47/67), respectively (P < 0.001). Similarly, RFS at 3 years was markedly reduced in the RBMS1-positive group relative to the RBMS1-negative group, with statistical significance (P < 0.001, Fig. 7). These findings underscore the prognostic relevance of RBMS1 overexpression in gliomas.
Fig. 7
Impact of RBMS1 expression on survival outcomes in glioma patients. Note: Kaplan–Meier survival curves based on 3-year follow-up data from 165 glioma patients. RBMS1-positive group showed significantly worse overall survival and relapse-free survival than the RBMS1-negative group (both P < 0.001)
Univariate analysis of the influencing factors affecting prognosisAnalysis of clinicopathological features between the survival and death groups revealed that WHO grade (P < 0.001), extent of resection (P = 0.006), tumor location (P = 0.046), distant metastasis (P = 0.002), and RBMS1 (P < 0.001) were significantly associated with patient prognosis. Specifically, patients in the survival group were more likely to have lower-grade tumors (G1/G2), undergo gross total resection, and present without distant metastasis. The number of RBMS1-positive patients was significantly higher in the death group (64 patients) than in the survival group (34 patients). (Table 3) These findings suggest that RBMS1 is closely associated with glioma malignancy and metastatic potential, particularly in high-grade gliomas, and may serve as a potential biomarker for poor prognosis.
Table 3 Univariate analysis of the influencing factors affecting prognosis [Mean ± SD, n (%)]Cox was used to analyze the independent influencing factors affecting the prognosis of patients with gliomaVariables with statistical significance in the univariate analysis were included in the Cox regression model. Cox proportional hazards regression analysis identified WHO grade (P < 0.001, HR = 14.167, 95% CI: 5.528–36.309), distant metastasis (P = 0.015, HR = 1.822, 95% CI: 1.126–2.949), and RBMS1 expression (P = 0.028, HR = 1.845, 95% CI: 1.068–3.188) as independent prognostic factors for overall survival in glioma patients. Notably, patients with positive RBMS1 expression had a 1.85-fold increased risk of mortality compared to those with negative expression. In contrast, extent of resection (P = 0.450) and tumor location (P = 0.800) were not significantly associated with prognosis. (Table 4) These findings indicate that RBMS1 serves as an independent molecular predictor of poor prognosis in glioma and may reflect underlying tumor aggressiveness.
Table 4 Cox analysis of the independent influencing factors affecting the prognosis of glioma patients
Comments (0)