
Remember me


Our cohort consisted of 124 patients with complete clinical profiles and follow-up data. Among them, 117 underwent combination therapy, with 68 (54.84%) receiving ICIs with taxane-platinum based chemotherapy (ICIs + TP) and 49 (39.52%) being administered ICIs with other chemotherapy (ICIs + other), while 7 (5.65%) received ICIs monotherapy. The patients in our cohort were 18 to 80 years of age, with 44 patients (35.48%) aged more than 60 years old. Most patients were male (72.58%), and 31.45% of them had a history of smoking. Other patient and disease characteristics are summarized in Table 1. To identify the primary tumor, 84.68% of them underwent PET/CT, and one patient underwent PET/MR, while the remaining patients were mainly diagnosed through CT, MRI, and endoscopy. Patients received ICIs approved by the FDA or National Medical Products Administration of China, including sintilimab (25.81%), pembrolizumab (21.77%), and tislelizumab (17.74%). The details of the combination regimens are provided in Table S1. Regarding local treatments post-ICIs, 6 patients underwent surgery, and another 28 received radiotherapy.
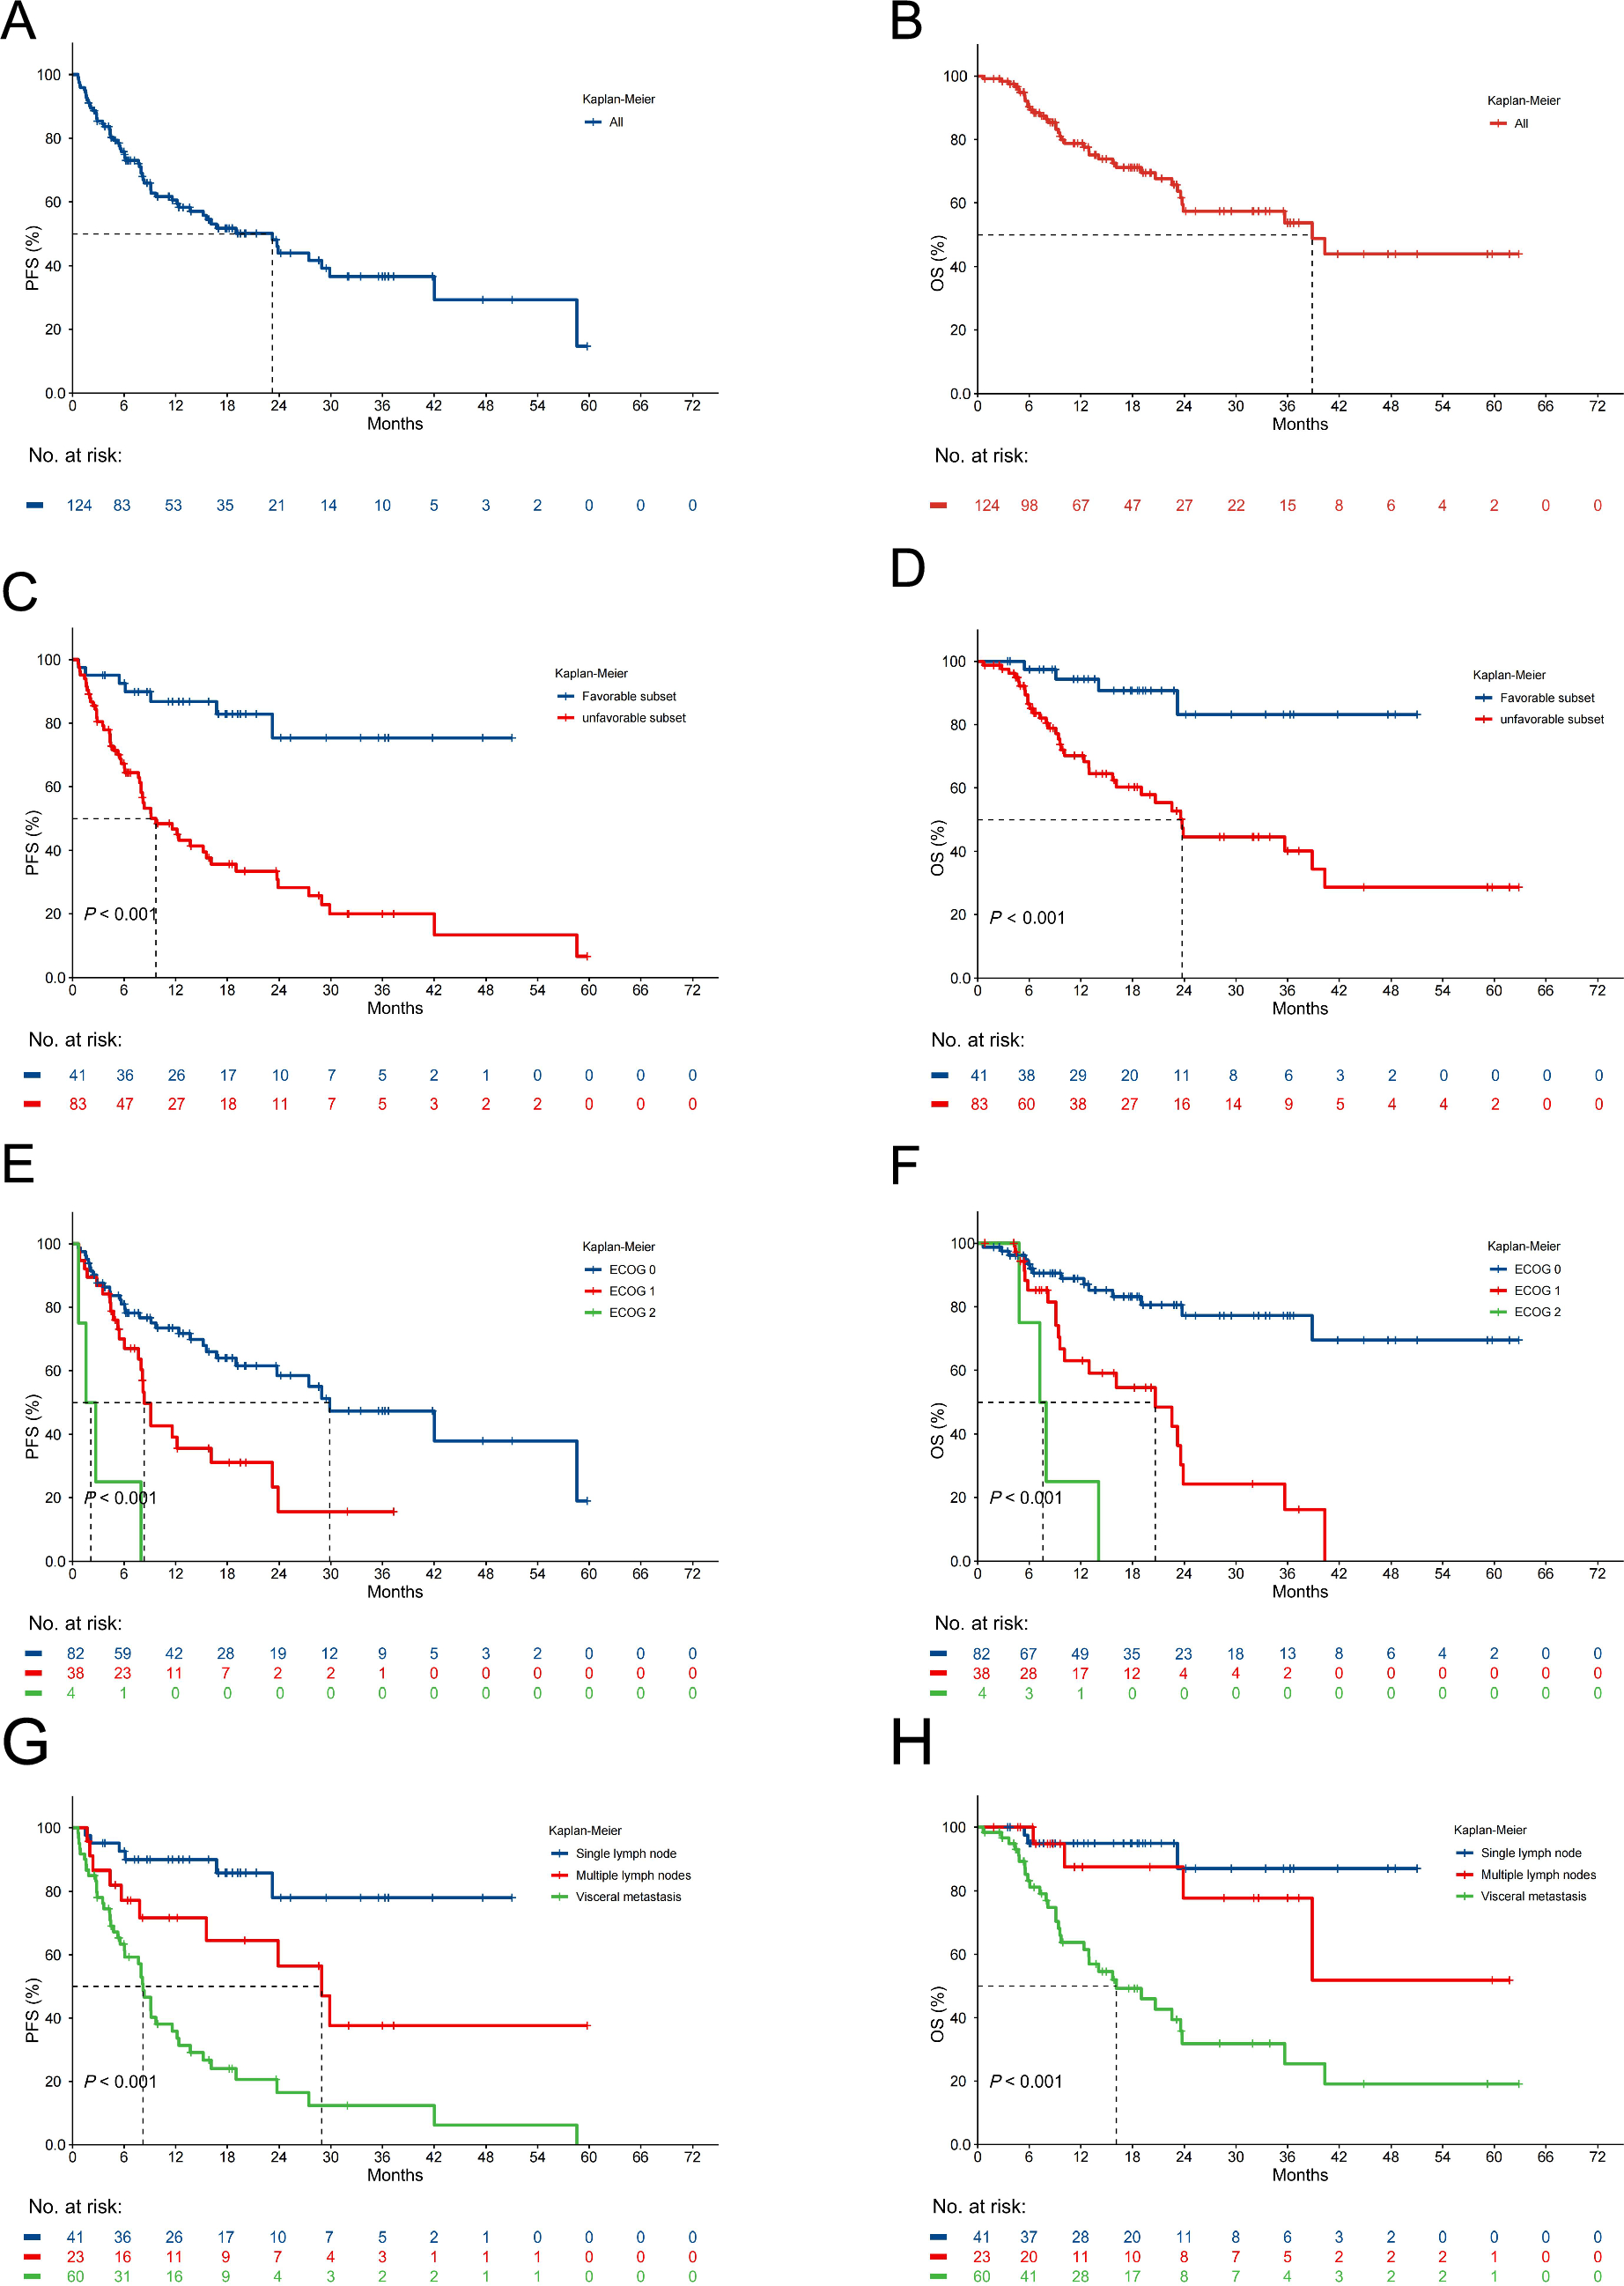
Table 1 Baseline characteristicsEfficacy outcomeAt the data cut-off for this analysis, the median follow-up duration was 18.6 months (95% confidence interval [CI] 16.97–23.63). Among all patients, 19 (15.32%) individuals had a confirmed CR and 50 (40.32%) had a confirmed PR, yielding an ORR of 55.65%. Furthermore, the ORR was 80.49% in the favorable subset, compared to 43.37% in the unfavorable subset (Table S2). Treatment was ongoing in twenty patients (16.13%). Notably, 16 individuals (12.9%) maintained ICIs for more than 1 year, with 3 were continuing for 2 years. Although 60 patients experienced progression on the treatment, 25 of them continued ICIs beyond progression. Among all included patients, the one-year PFS and OS rates were 59.1% and 77.6%, respectively. The median PFS was 23.20 (95% CI 12.37—not reach[NR]) months, while the median OS was 38.86 (95% CI 23.73—NR) months (Fig. 1A, B). Both PFS and OS were significantly longer in patients within the favorable subset compared to the unfavorable subset (median PFS NR vs. 9.7 months, P < 0.001; median OS NR vs. 23.73 months, P < 0.001; Fig. 1C, D). Notably, lower ECOG status was substantially associated with superior PFS and OS (median PFS 29.87 vs. 8.33 vs. 2.13 months, P < 0.001; median OS NR vs. 20.67 vs. 7.60 months, P < 0.001; Fig. 1E, F). Additionally, the presence of visceral metastasis demonstrated a higher risk for progression and death in comparison to multiple lymph nodes metastasis or single lymph node metastasis (median PFS 8.2 vs. 28.93 months vs. NR, P < 0.001; median OS 16.13 months vs. NR vs. NR, P < 0.001; Fig. 1G, H). Moreover, first-line ICIs treatment resulted in better PFS and OS than ≥ 2nd line (median PFS NR vs. 11.6 months, P = 0.002; median OS NR vs. 23.73 months, P = 0.045; Fig. S1A, B).
Fig. 1
Clinical efficacy of ICIs. Kaplan–Meier plots for A progression-free survival (PFS) and B overall survival (OS) for all patients. Kaplan–Meier plots for C PFS and D OS according to CUP subtype. Kaplan–Meier plots for E PFS and F OS according to ECOG performance status. Kaplan–Meier plots for G PFS and H OS according to metastatic sites
Patients receiving ICIs + TP showed significantly higher ORR than those receiving ICIs + other (71.9% vs. 46.7%; P = 0.0097; Fig. 2A) and ICIs monotherapy (71.9% vs. 28.6%; P = 0.032; Fig. 2A). Additionally, patients who received ICIs + TP had longer PFS compared to ICIs + other (27.4 vs. 12.4 months, HR = 0.55, P = 0.11; Fig. 2B) and ICIs monotherapy (27.4 vs. 11.6 months, HR = 0.44, P = 0.08; Fig. 2B), while the OS of patients receiving ICIs + TP is also longer than those receiving ICIs + other (NR vs. 23.7 months, HR = 0.54, P = 0.07; Fig. 2C), though they did not reach statistical significance.
Fig. 2
Clinical efficacy of patients receiving different combination therapies. ORR by combination therapy A Kaplan–Meier plots for B PFS and C OS according to combination therapy
Biomarker analysesHigher PD-L1 expression (CPS ≥ 20) was found to be associated with better long-term responses, particularly in unfavorable cases. In 31 patients with available PD-L1 detection results, the positivity rate for PD-L1 (CPS ≥ 1) was 83.87%, and 10 patients (32.26%) had CPS ≥ 50. Among these patients, 19 were classified as unfavorable cases, while 12 were favorable cases. Other disease characteristics of these patients are presented in Table S3. CPS ≥ 20 was selected as the cutoff for biomarker analysis based on a prior study (Burtness et al. 2019) and its proximity to the median CPS in our cohort. In the unfavorable group, for those with PD-L1 CPS ≥ 20 (N = 6), 4 patients (66.67%) had responses lasting over 12 months, with only 1 patient (16.67%) experiencing disease progression; Conversely, among those with PD-L1 CPS < 20 (N = 13), only 3 patients (23.08%) had responses lasting over 12 months, while 5 patients (38.46%) experienced disease progression. Similarly, in the favorable group, for patients with PD-L1 CPS ≥ 20 (N = 9), 7 (77.78%) had responses lasting over 12 months, with no cases of disease progression. Among those with PD-L1 CPS < 20 (N = 3), only 1 patient had a response lasting over 12 months, while 1 patient experienced disease progression (Fig. 3).
Fig. 3
Swimmer plot of the patients with available data of different PD-L1 expressions. Arrows indicate patients still on treatment
We performed next-generation sequencing on 26 patients and observed that CUP patients harboring KRAS alterations did not demonstrate significant benefits from ICI treatment. Among the 26 patients, 3 were favorable cases, while the rest were unfavorable cases. Disease characteristics of these patients are presented in Table S4. The Oncoplot graphically illustrated the mutational landscape and distribution of genetic alterations within these patients (Fig. 4). Among the detected abnormalities, the top three in terms of mutation frequencies were TP53 alterations (65%), KRAS mutations (23%), and RNF43 alterations (19%), respectively. None of the samples showed MSI. Noteworthy, patients with a PFS < 6 months exhibited a higher incidence of KRAS mutations (33.33%) compared to those with a PFS ≥ 6 months (9.1%). Patients with KRAS mutation had shorter PFS (3.96 vs. 9.7 months, HR = 2.63, P = 0.077; Fig. 5A) and significantly lower OS (5.68 vs. 22.6 months, HR = 4.48, P = 0.019; Fig. 5B) compared to wild-type. Additionally, individuals with KRAS mutations exhibited lower ORR than those without, though not statistically significant (Fig. 5C).
Fig. 4
The landscape of high-frequency altered genes in patients with CUP. Each column represents an individual patient, while rows denote various genes or genetic loci analyzed
Fig. 5
Patients with KRAS mutation did not benefit from ICI treatment: Kaplan Meier estimates of A PFS and B OS, stratified according to KRAS mutation. C ORR by KRAS mutation. High tumor mutation burden (TMB) is predictive of clinical outcome: Kaplan Meier estimates of D progression-free survival (PFS) and E overall survival (OS), stratified according to TMB. F Objective response rate (ORR) by TMB
Of the 26 patients who underwent next-generation sequencing, 25 patients' samples were eligible for TMB assessment. Our analysis revealed that high TMB (≥ 12 mutations/Mb) was associated with better treatment efficacy and survival outcome. Among these 25 CUP patients, 5 patients were stratified to be TMB-H and 20 patients to be TMB-low (TMB-L), based on a TMB cut-off of 12 mutations/Mb. The mean TMB across the CUP cohort was 6.96 mutations/Mb, with a median of 5.33 mutations/Mb. Survival analysis revealed significantly longer PFS and OS in the TMB-H group. Specifically, the one-year PFS rate was 100% for the TMB-H group, compared to 14.3% for the TMB-L cohort, with a median PFS of NR versus 6.03 months (P = 0.006), respectively (Fig. 5D). Similarly, the one-year OS rates of TMB-H and TMB-L cohorts were 100% and 31.3%, respectively, with the median OS not reached in the TMB-H group and 9.57 months in the TMB-L patients (P = 0.024; Fig. 5E). Moreover, the TMB-H group were found to have a better ORR than the TMB-L group (80% vs. 25%; P = 0.040; Fig. 5F).
Correlative analysesTo assess the factors that affect the efficacy of ICIs, we conducted comprehensive univariable and multivariate analyses investigating the correlation between clinicopathologic factors, oncogenic drivers, and patient outcomes (Fig. 6; Fig S2). The results indicated that higher ECOG performance status, the presence of visceral metastasis, and KRAS mutation were independently associated with inferior PFS and OS within our patient cohort. After adjusting for various variables, higher ECOG status exhibited a notable impact on PFS (HR = 5.6, 95% CI 1.79–17.5, P = 0.003), and OS (HR = 9.65, 95% CI 2.43- 38.3, P = 0.001). Similarly, visceral metastasis emerged as an independent predictor for inferior PFS (HR = 2.41, 95% CI 1.16–4.97, P = 0.018) and OS (HR = 3.76, 95% CI 1.26–11.2, P = 0.017) across both univariable and multivariate analyses. Notably, among CUP patients with accessible KRAS mutation status, individuals with KRAS wild type remained a significant association with both PFS (HR = 0.16, 95% CI 0.04–0.78, P = 0.022) and OS (HR = 0.04, 95% CI 0.00–39, P = 0.006) even after adjustments when compared to cases harboring KRAS mutations. However, the impact of CUP subtype and treatment line on PFS and OS did not maintain significance in the multivariate model.
Fig. 6
Forest plot for A progression-free survival and B overall survival according to prespecified subgroups in multivariable Cox regression analysis. Ref., referencer. HR, hazard ratio. CI, confidence interval
SafetyAdverse events were consistent with the known safety profile of ICIs. The incidences of any AEs and grade 3 to 4 AEs in all patients are summarized in Table 2. Among the cohort, 121 (97.58%) individuals experienced AEs of any grade, with 27 (21.77%) encountering AEs of grade 3 or 4. Serious AEs were observed in 11 (8.87%) patients, but no treatment-related death occurred. The most common AEs of any grade that occurred after the start of treatment consisted of anemia (72.58%), leukopenia (51.61%), neutropenia (44.35%), dyspepsia (39.52%), and elevated transaminases (37.10%). Immune-related AEs occurred in 49 (39.52%) patients, with most events being of grade 1 or 2. The most prevalent immune-related toxicities comprised hypothyroidism (12.10%), pruritus (12.10%), and rash (9.68%). Notably, One patient developed grade 3 immune-related pneumonia and required treatment discontinuation.
Table 2 Incidence of adverse events (AEs) for all patients (N = 124)In summary, the median PFS and OS of our patients were 23.20 and 38.86 months, respectively, with an ORR of 55.65%. The patients receiving ICIs + TP showed significantly higher ORR and a non-significant trend toward improved PFS and OS than those receiving ICIs + other and ICIs monotherapy. Analyses of the 31 patients whose PD-L1 detection results were available and the 25 patients who were eligible for TMB assessment indicated better clinical efficacy of ICIs for tumors with a higher PD-L1 expression (CPS ≥ 20) and a greater tumor mutation burden (> 12 mutations/Mb). In multivariate analyses, it was revealed that higher ECOG performance status, the presence of visceral metastasis, and KRAS mutation were independently associated with inferior PFS and OS. The adverse events were manageable and consistent with the known safety profile of ICIs.
Comments (0)