
Remember me


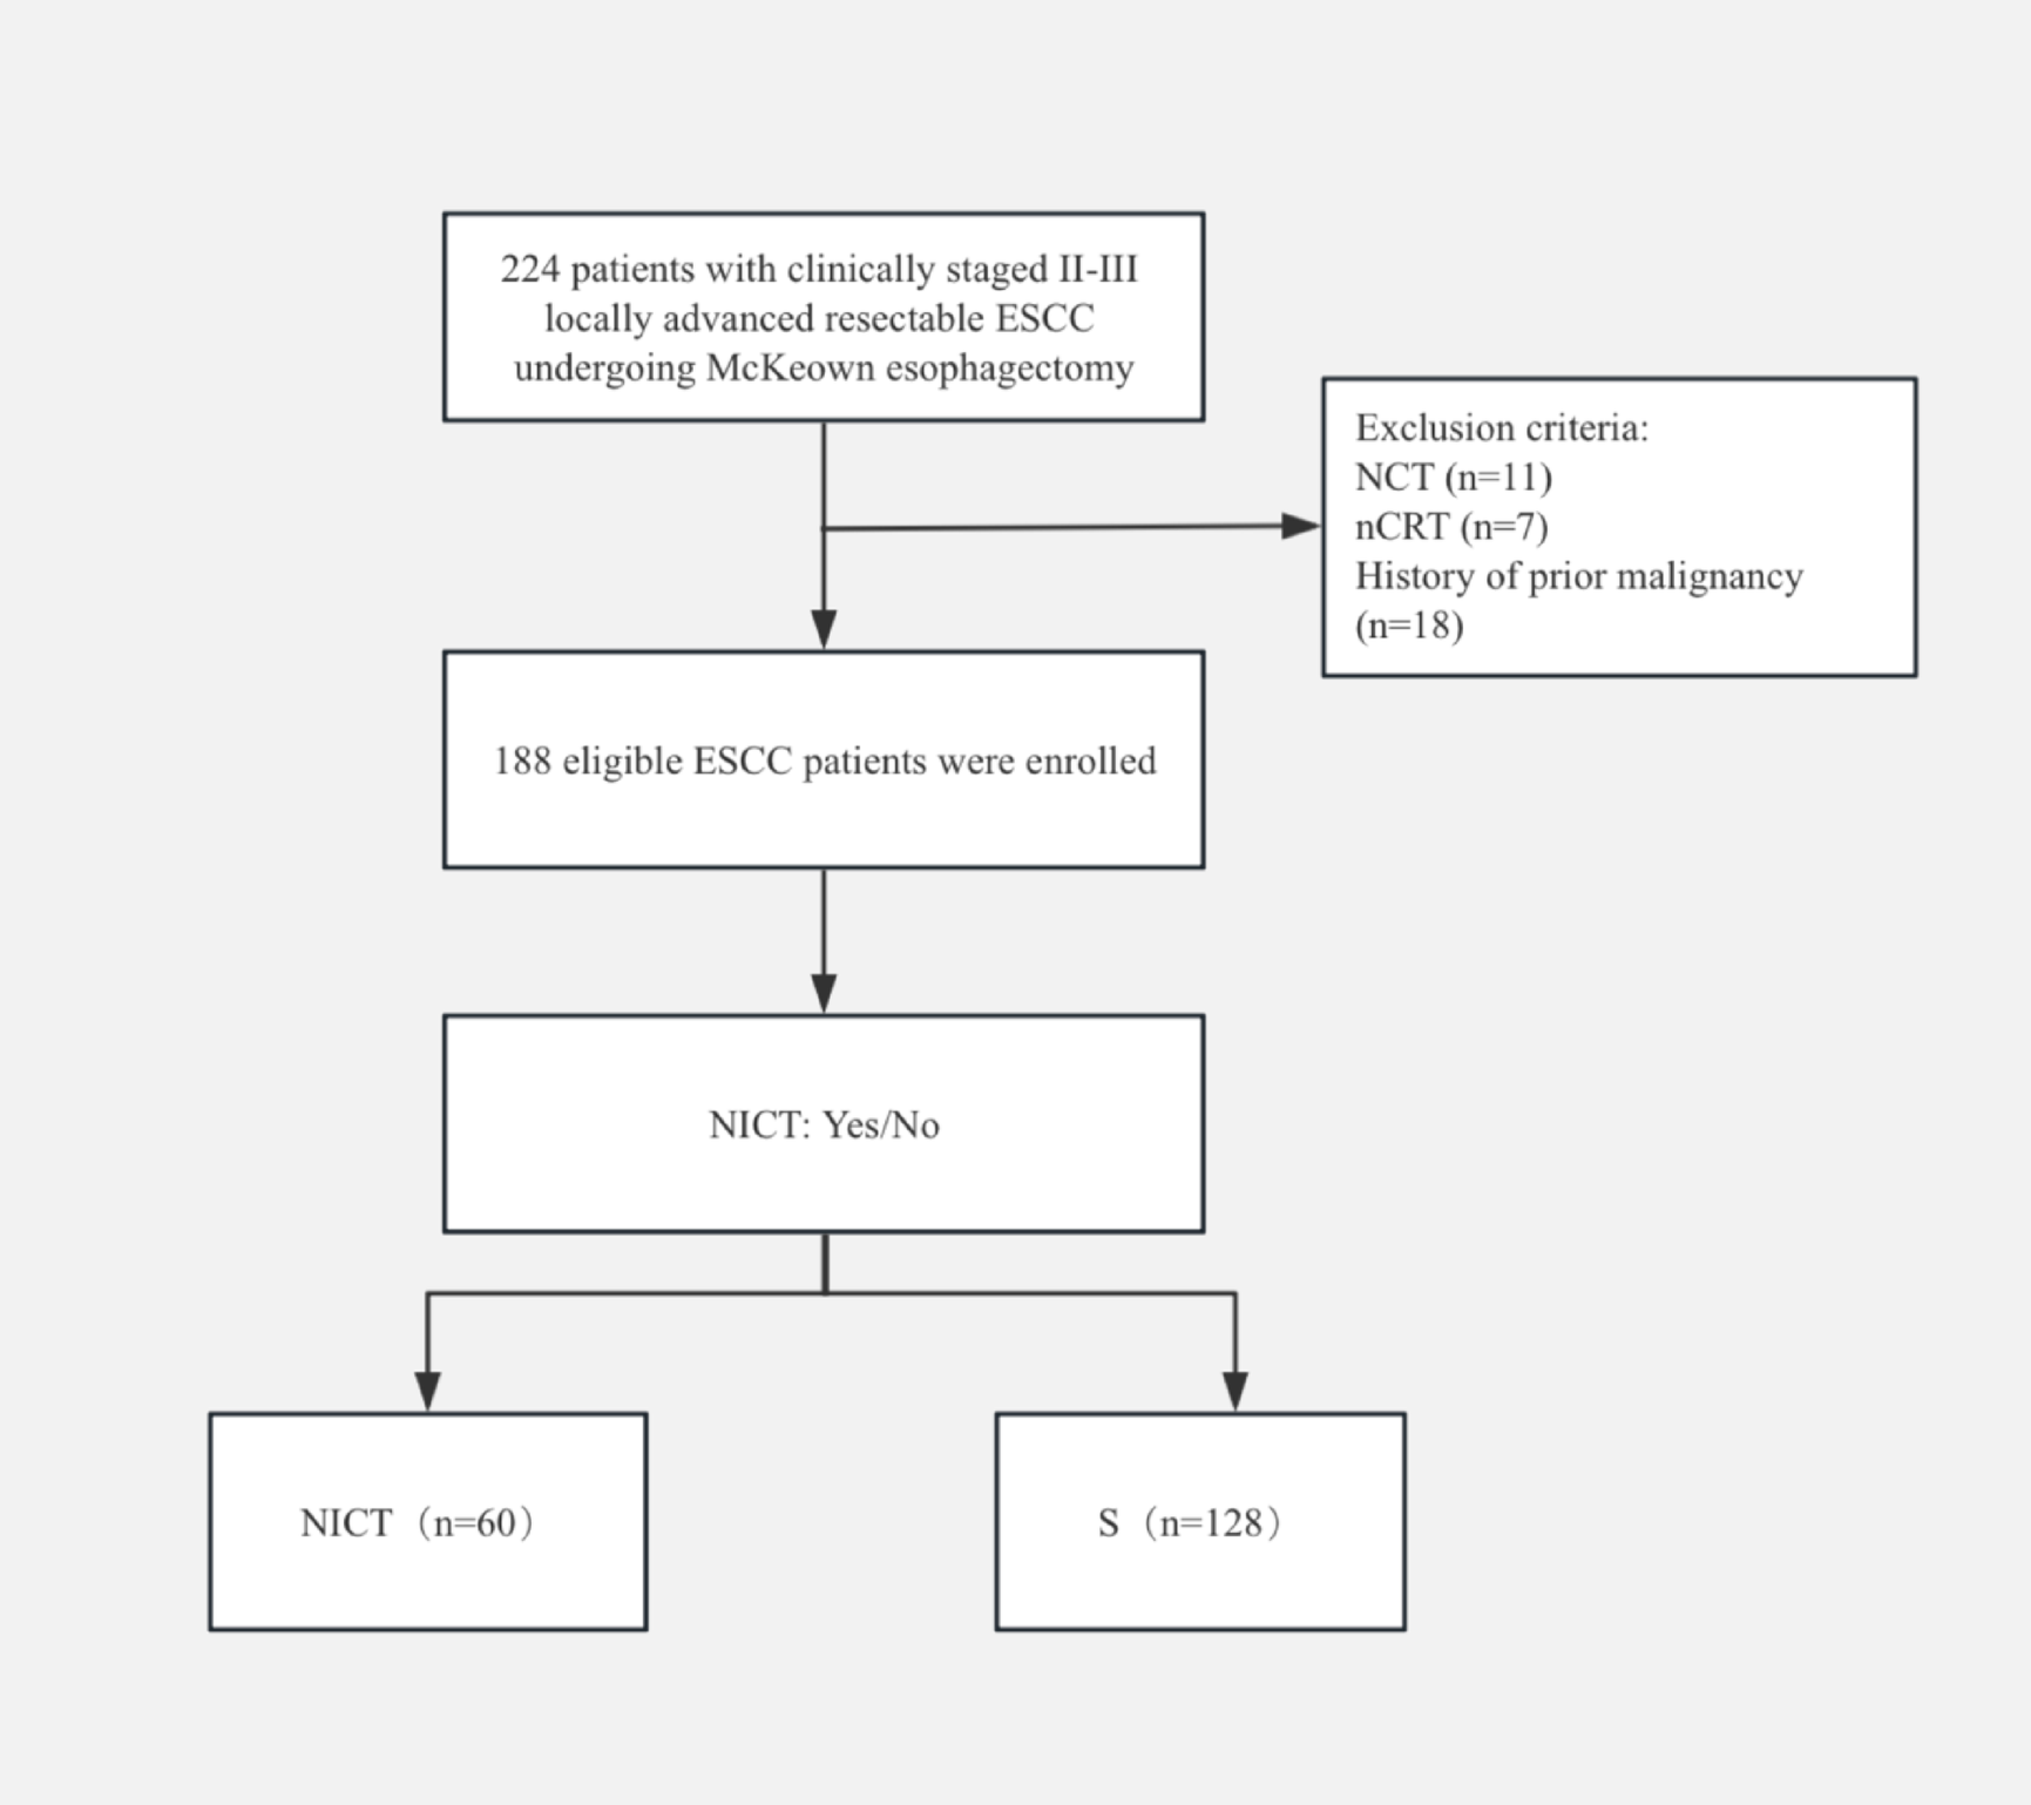
From December 2019 to May 2023, a total of 224 patients were screened. Exclusions included NCT (n = 11), nCRT (n = 7), and a history of prior malignancy (n = 18). Ultimately, 188 eligible patients were included in this retrospective cohort study, with 60 patients assigned to the NICT group and 128 to the surgery-alone group (Fig. 1). Preliminary comparative analysis showed that baseline clinical characteristics were balanced and comparable between the two groups, with no statistically significant differences observed in any variable (all P > 0.05) (Table 1).
Fig. 1
Patient enrollment flowchart. ESCC, esophageal squamous cell carcinoma; NCT, neoadjuvant chemotherapy; nCRT, neoadjuvant chemoradiotherapy; NICT, neoadjuvant immunochemotherapy; S, surgery alone
Table 1 Baseline clinical characteristicsPerioperative outcomesBoth groups underwent McKeown esophagectomy with standard two-field lymphadenectomy, with no conversion to thoracotomy. The NICT group achieved a significantly higher R0 resection rate [100% (60/60) vs. 91.4% (117/128), P = 0.018]. Compared with the surgery-alone group, the NICT cohort had a longer operation time (341.6 ± 51.6 min vs. 302.7 ± 57.7 min, P < 0.001). However, no significant differences were observed between groups in intraoperative blood loss, number of lymph nodes dissected, chest tube indwelling time, postoperative ICU readmission, 60-day postoperative mortality, or 30-day readmission (all P > 0.05) (Table 2).
Table 2 Comparison of perioperative dataPostoperative complicationsPostoperative complications were assessed using the Clavien-Dindo classification. The NICT group demonstrated a total complication rate of 40% (24/60), compared with 37.5% (48/128) in the surgery-alone group, with no statistically significant difference. Pulmonary complications were the most frequent postoperative morbidity in both cohorts (35.0% vs. 26.6%, P = 0.236), and pneumonia occurred more commonly in the NICT group than in the surgery-alone group (28.3% vs. 21.9%, P = 0.333), although the difference was not statistically significant. New-onset atrial fibrillation was the most frequent cardiac complication (3.3% vs. 9.4%, P = 0.241). No grade ≥ III complications were observed in the NICT group. In contrast, a total of three patients (2.3%) in the surgery-alone group experienced grade ≥ III complications, including one case (0.8%) of respiratory insufficiency and two cases (1.6%) of gastrointestinal fistula (Table 3).
Table 3 Comparison of postoperative complicationsEfficacy evaluation of NICTThe efficacy evaluation outcomes of NICT are summarized in Table 4. Based on the Response Evaluation Criteria in Solid Tumors (RECIST) version 1.1 criteria, radiologic assessment revealed that 8 of 60 patients (13.3%) in the NICT group achieved complete response (CR), while 29 patients (48.3%) exhibited partial response (PR). The objective response rate (ORR), defined as the combined proportion of CR and PR, was 61.7% (37/60). Additionally, 22 patients (36.7%) were categorized as stable disease (SD), and 1 patient (1.7%) progressed to progressive disease (PD). The disease control rate (DCR), calculated as the sum of CR, PR, and SD, reached 98.3% (59/60).
Table 4 Efficacy evaluation of NICTAll 60 patients in the NICT cohort achieved R0 resection. Postoperative analysis demonstrated a pCR rate of 28.3% (17/60) and an MPR rate of 61.7% (37/60). Comparative evaluation of clinical staging versus post-neoadjuvant pathological staging revealed tumor downstaging in 60% (36/60) of patients, with T-stage downstaging observed in 66.7% (40/60) and N-stage downstaging in 56.7% (34/60) (Table 4).
Patients in the NICT cohort were stratified into three subgroups based on postoperative pathological response: pCR, MPR, and TRG3/4 groups. Statistical analysis demonstrated a significant correlation between histopathological assessment and radiological evaluation following NICT (P < 0.001), while no statistically significant association was observed between pathological response and the number of NICT treatment cycles (P = 0.813) (Table 5).
Table 5 Pathological evaluation of NICTTreatment-related adverse events (AEs) of NICTA comprehensive safety assessment was conducted in 60 patients receiving NICT, incorporating longitudinal follow-up and clinical data analysis per CTCAE v5.0 criteria. AEs of any grade occurred in 96.7% (58/60) of the cohort. Grade 3 AEs were documented in 20% (12/60) of patients, with no grade ≥ 4 events observed. Notably, no treatment discontinuations or mortality attributable to AEs occurred.
The most prevalent grade 3 AEs originated from hematologic systems, ordered by frequency: neutropenia (8.3%, 5/60), leukopenia (6.7%, 4/60), anemia (5.0%, 3/60), and thrombocytopenia (5.0%, 3/60), all of which were managed effectively with supportive care. Non-hematologic AEs predominantly included alopecia (73.3%, 44/60), fatigue (68.3%, 41/60), and nausea (58.3%, 35/60), with only one grade 3 event recorded.
Immune-related adverse events (irAEs) developed in 20% (12/60) of patients, of which 11.7% (7/60) resolved spontaneously within two weeks without medical intervention. Four patients (6.7%) required symptomatic management for irAEs resolution, while one case (1.7%) of immune-mediated pneumonitis necessitated surgical delay (Table 6).
Table 6 AEs associated with NICTSurvival outcomesThe median follow-up was 41.4 months [95% Confidence Interval (CI) 40.1–42.7] the entire cohort, with 40.2 months (95% CI 38.8–41.6) in the NICT group and 41.7 months (95% CI 37.6–45.8) in the surgery-alone group. Median DFS and OS were not reached in either group.
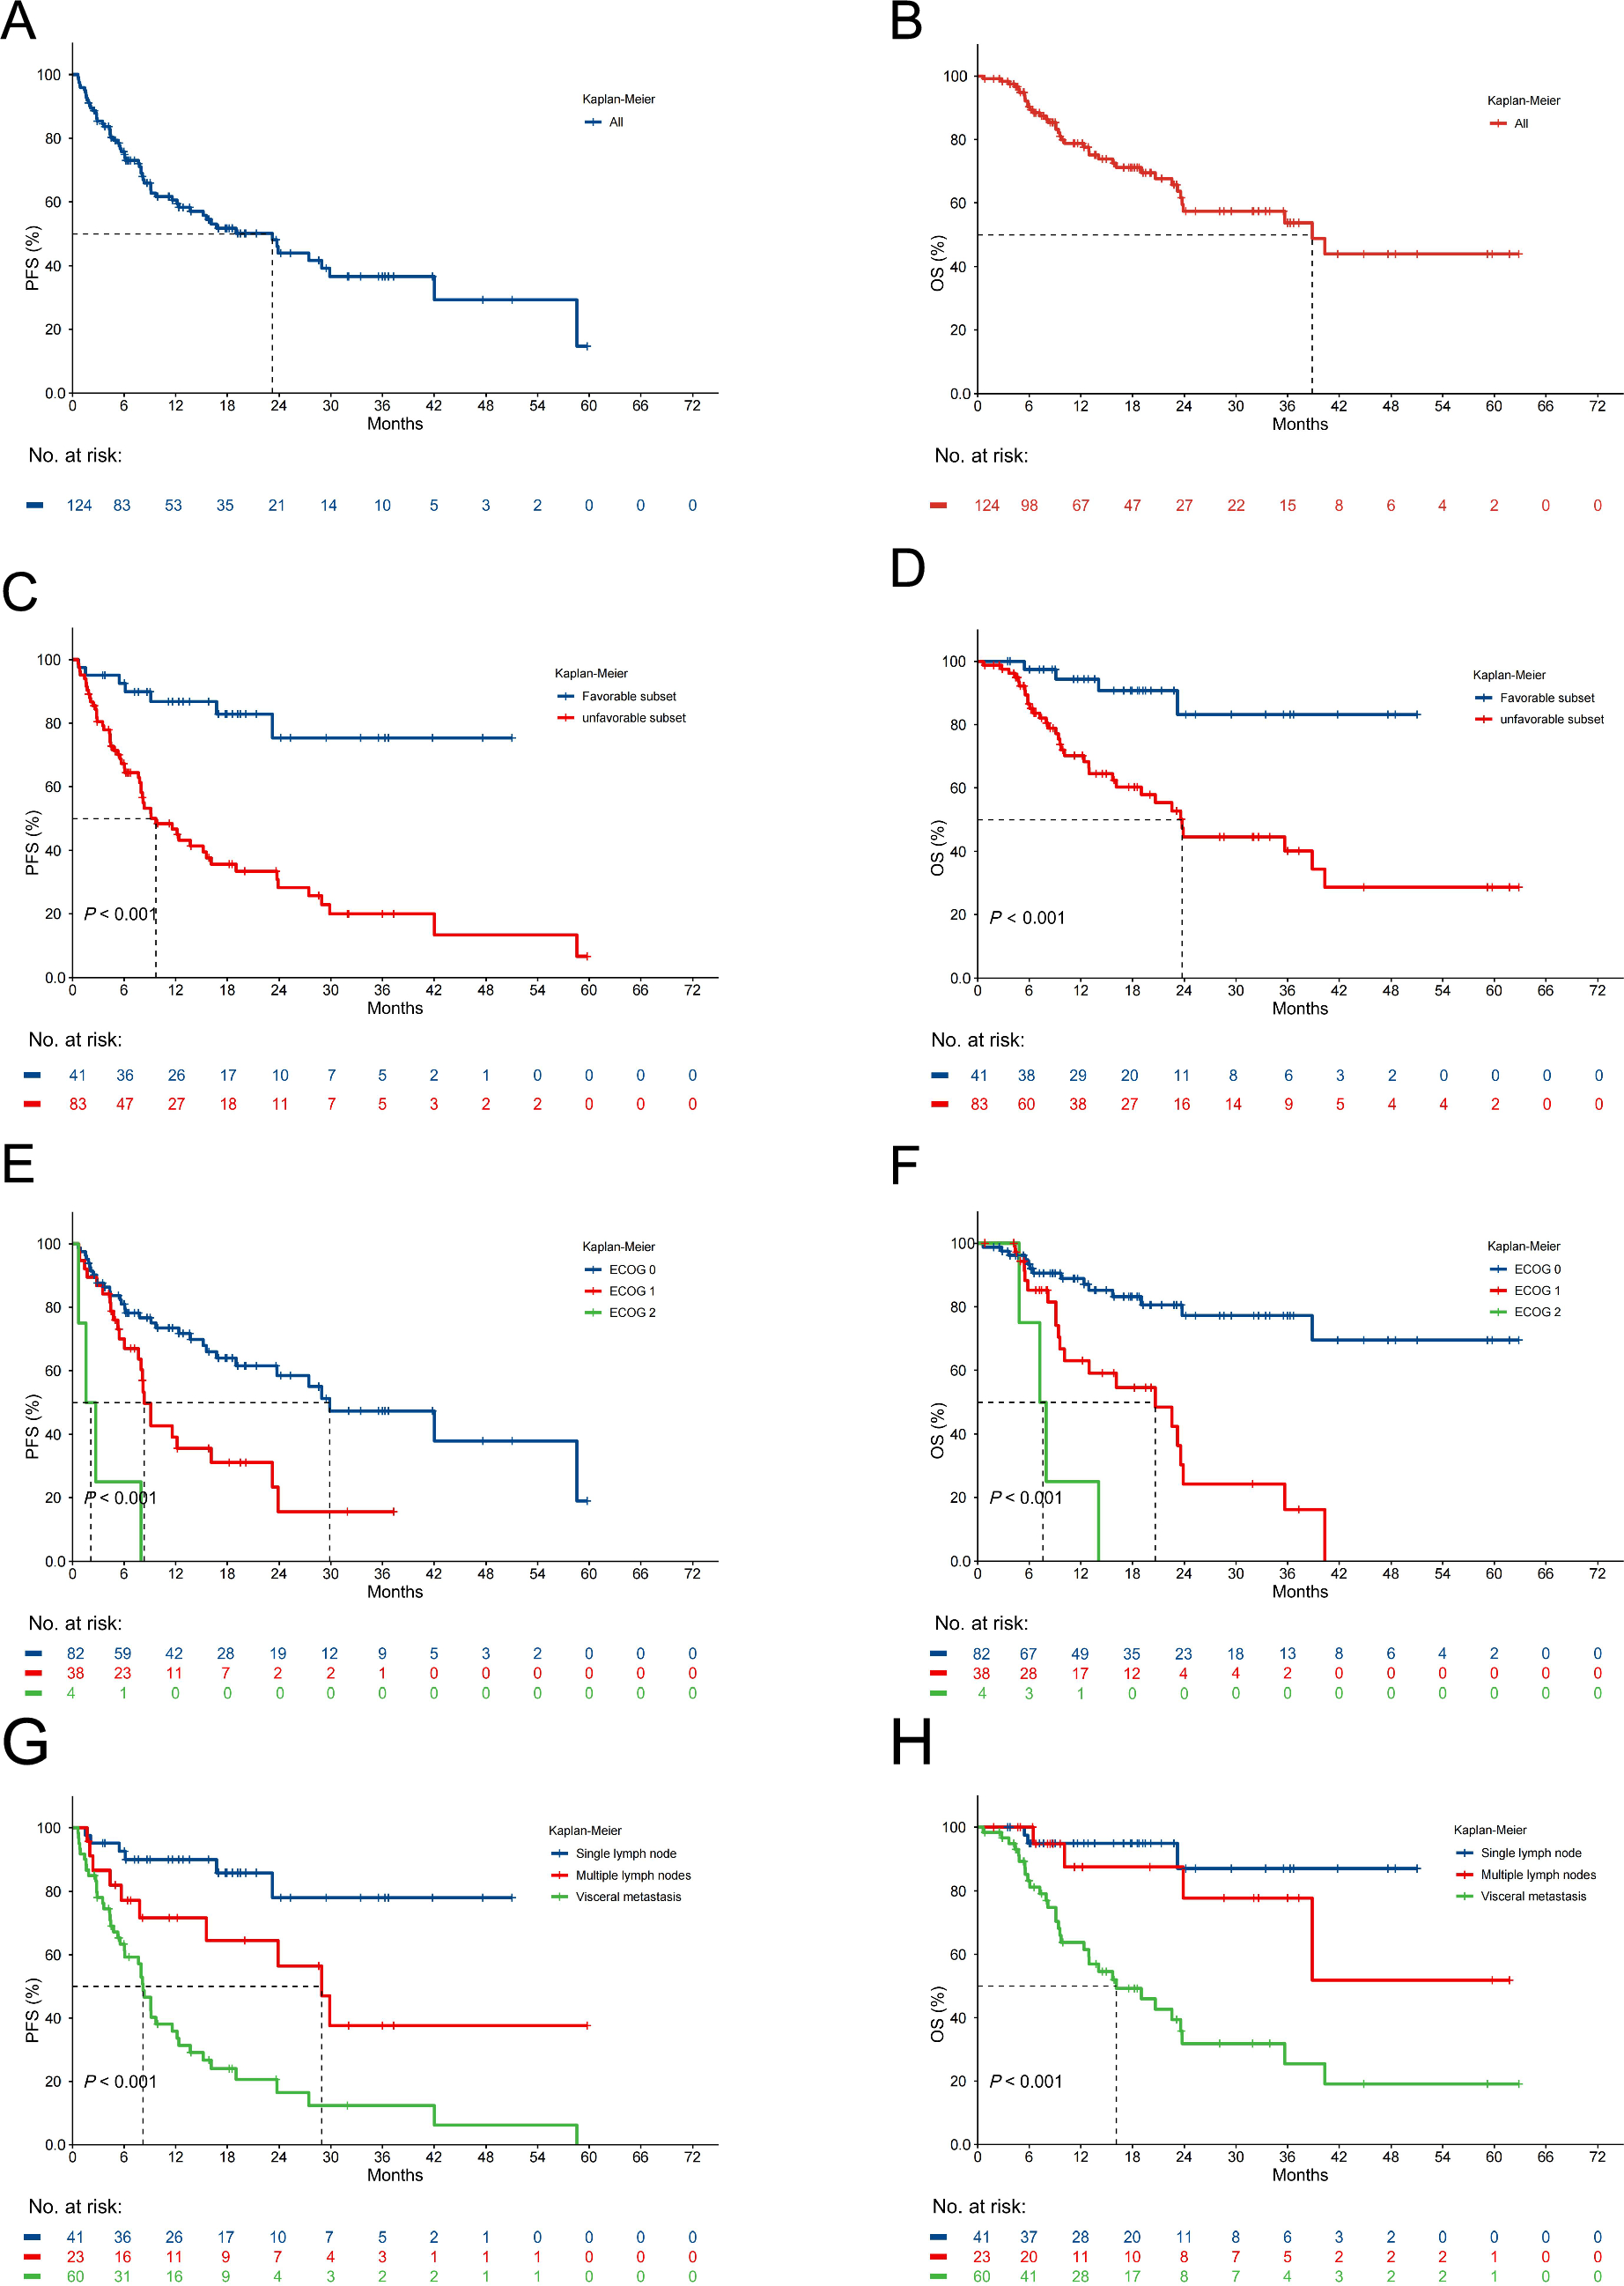
The NICT group demonstrated superior 1-year DFS (96.7% vs. 81.3%) and OS (98.3% vs. 87.5%) compared to the surgery-alone group. At 2 years, the NICT group also showed higher DFS (76.7% vs. 57.0%) and OS (86.7% vs. 68.0%) rates. NICT was associated with significantly improved DFS (HR 0.547, 95% CI 0.317–0.946; P = 0.021) and OS (HR 0.444, 95% CI 0.241–0.816; P = 0.0053) (Fig. 2A, B).
Fig. 2

Kaplan–Meier survival analyses comparing outcomes. A DFS in NICT vs S groups. B OS in NICT vs. S groups. C DFS by pCR status in NICT group. D OS by pCR status in NICT group. E DFS by MPR status in NICT group. F OS by MPR status in NICT group. G DFS by NICT cycle number (2 vs. > 2). H OS by NICT cycle number (2 vs. > 2). NICT, neoadjuvant immunochemotherapy; S, surgery alone, DFS, disease-free survival; OS, overall survival; pCR, pathological complete response; MPR, major pathological response
The pCR subgroup demonstrated superior 2-year DFS (94.1% vs. 69.8%; HR 0.252, 95% CI 0.057–1.116; P = 0.042) and OS (100% vs. 81.4%; HR 0.170, 95% CI 0.022–1.307; P = 0.048) compared to the non-pCR subgroup (Fig. 2C, D). Similarly, the MPR subgroup exhibited improved 2-year DFS (91.2% vs. 65.2%; HR 0.359, 95% CI 0.135–0.953; P = 0.019) and OS (91.9% vs. 78.3%; HR 0.235, 95% CI 0.072–0.768; P = 0.006) versus the non-MPR subgroup (Fig. 2E, F). Patients receiving 2 cycles versus > 2 cycles of NICT showed comparable outcomes in both DFS (76.1% vs. 78.6%; HR 0.713, 95% CI 0.205–2.482; P = 0.72) and OS (87.0% vs. 85.7%; HR 0.999, 95% CI 0.275–3.631; P = 0.88) (Fig. 2G, H).
Univariate Cox analysis identified ECOG score (HR 5.528, 95% CI 3.308–9.238; P < 0.001), coronary heart disease (HR 2.706, 95% CI 0.844–8.670; P = 0.096), and treatment approach (HR 0.444, 95% CI 0.241–0.816; P = 0.009) as potential OS predictors. Multivariate analysis of factors with P < 0.1 confirmed ECOG score (HR 6.778, 95% CI 4.010–11.458; P < 0.001), coronary heart disease (HR 4.152, 95% CI 1.244–13.860; P = 0.021), and treatment approach (HR 0.285, 95% CI 0.150–0.543; P < 0.001) as independent prognostic factors for OS (Table 7).
Table 7 Univariate and multivariate cox regression analysis based on baseline characteristics
Comments (0)