
Remember me
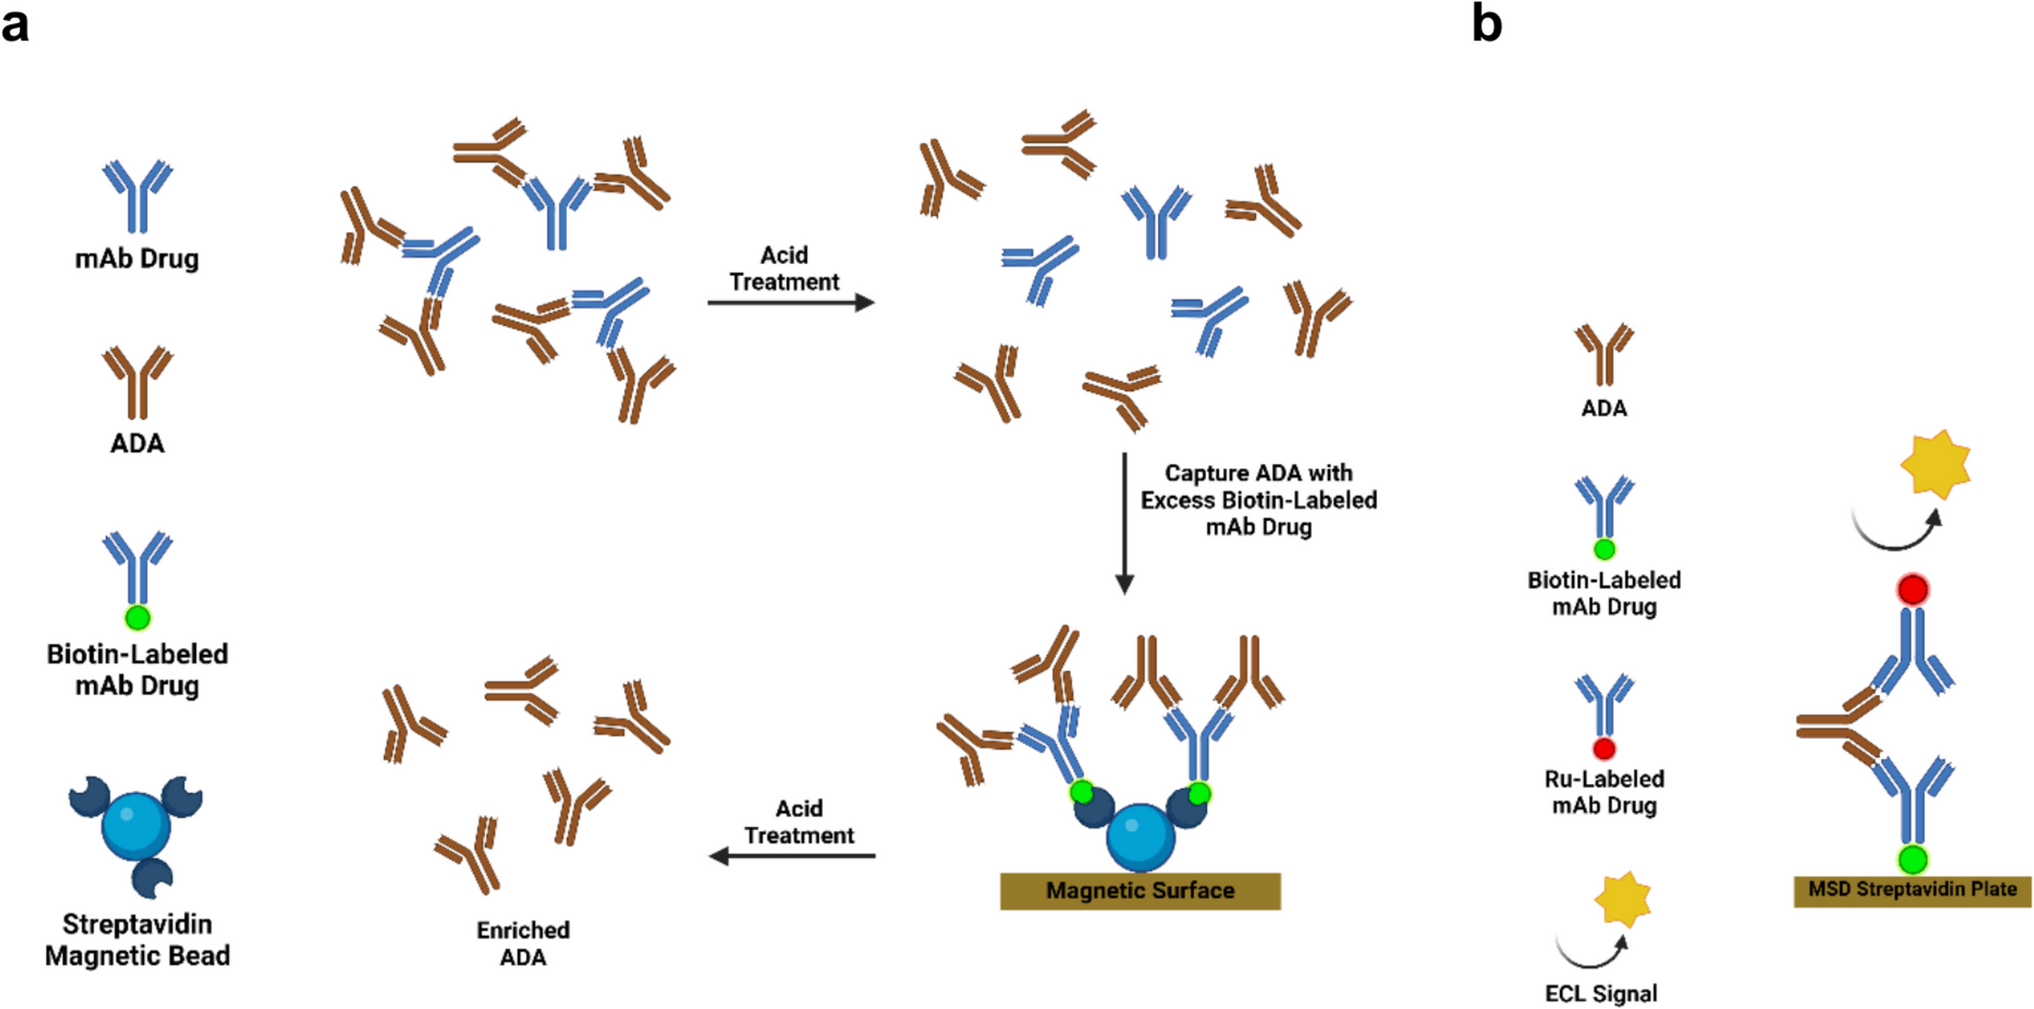
To set a baseline for evaluating the automated ADA enrichment procedure, we first optimized conditions for a manual biotin-drug extraction and acid dissociation (BEAD) procedure (Fig. 1a) to enrich ADA. As a test system for evaluating the effectiveness of the automated (or manual) ADA enrichment procedure, we selected an LBA based on electrochemiluminescence (ECL) technology on the Meso Scale Discovery (MSD) platform (Fig. 1b). Performance characteristics for the LBA (using a manual BEAD procedure) were established through assay qualification and included sensitivity (< 1 ng/mL), selectivity, intra-assay precision, and inter-assay precision. Importantly, the screening cut point (SCP) was determined to be 1.27 through analysis of 30 disease samples according to industry best practices, and a drug tolerance of 1.5 mg/mL was achieved at a PC concentration of 10 ng/mL.
Fig. 1
Manual biotin-drug extraction and acid dissociation (BEAD) procedure to enrich ADA and testing in an ECL assay on the MSD platform. a Schematic of a manual BEAD procedure, using biotin-labeled drug as the capture reagent. Samples containing drug and ADA are treated with an acid to dissociate drug-ADA complexes. ADA are captured using biotin-labeled drug coupled to streptavidin (SA) magnetic beads. After extensive washing to remove unbound molecules, SA magnetic beads are captured on a magnetic surface and ADA are eluted using a second acid treatment. b Schematic of an LBA for ADA detection, using biotin- and ruthenium (Ru)-labeled drug as capture and detection reagents, on the MSD platform. Samples containing ADA are incubated with a master mix, containing capture and detection reagents. Samples are transferred to a SA MSD plate and incubated, prior to addition of Read Buffer. ECL signals generated by interaction of Ru and tripropylamine in the Read Buffer are measured in an MSD instrument
As shown in Fig. 2, serum samples containing a positive control (PC) antibody at 100 ng/mL (a), or 10 ng/mL (b) spiked with drug from 0.25 to 1.5 mg/mL produced S/N ratios above the SCP (1.27). The signal to noise (S/N) ratio of a given sample was calculated by dividing the signal of the sample by the signal of the negative control (NC). In the same experiment, in the absence of drug, the PC at 100 ng/mL and 10 ng/mL produced S/N ratios of 616 and 61.2, respectively; these ratios were omitted from the graph to aid visualization.
Fig. 2
Drug tolerance results for a positive control (PC) antibody in serum with increasing amounts of spiked drug. a Serum samples containing 100 ng/mL of PC were spiked with drug from 0.25 to 1.5 mg/mL, mixed at ambient temperature for at least 1 h, and frozen at −70°C. Samples were thawed, processed using manual BEAD procedure, and tested in the LBA based on MSD platform. Dashed line indicates the screening cut point (1.27). b Serum samples containing 10 ng/mL of PC were prepared as above, processed using manual BEAD, and tested in the LBA. Dashed line indicates the screening cut point (1.27)
Having established a basis for comparison, we sought to develop an automated procedure to enrich the PC from serum samples for testing in the LBA above. Our goal was to reduce the time and manual manipulation required to perform ADA enrichment without sacrificing sensitivity and drug tolerance. After a review of potential technologies and products, we partnered with Biotage® to test DFC and the company’s SA PhyTip® columns. Specifically, we evaluated the 1 mL SA PhyTip® column with an 80 µL resin bed. We chose the 1 mL column size due to the sample (≥ 200 µL) and wash (≥ 300 µL) volumes we intended to test and the 80 µL resin bed based on the binding capacity we thought was necessary to achieve adequate sensitivity. DFC drives the enrichment of proteins from SA PhyTip® columns through three basic steps: capture, wash, and elute. The three steps do not require lengthy, static incubations, as the solutions involved in each step are continuously passed through the resin bed for a user-defined number of cycles (e.g., 15 for the capture step). As illustrated in Fig. 3, ADA captured with excess biotin-labeled drug are retained in the SA PhyTip® columns where they undergo automated wash and elution steps. No loose magnetic beads are required as the SA resin is trapped within the columns. The liquid-handling steps were performed on a Hamilton Microlab STAR automated system. Importantly, we were mindful to retain as much of the analytical procedure used to generate the data in Fig. 2 as possible. Thus, the initial acid dissociation (e.g., sample volume, MRD, acid solution) and subsequent LBA to detect ADA (e.g., biotin- and Ru-labeled mAb drug concentrations, duration of incubation) were left unchanged.
Fig. 3
Use of dual flow chromatography (DFC) and SA PhyTip® columns to enrich ADA. Samples are treated with acid to liberate ADA from complexes. Biotin-labeled drug is added. Samples are neutralized and incubated at ambient temperature to allow for capture of ADA. Samples are loaded on to SA PhyTip® columns using multiple automated pipetting cycles on the Hamilton Microlab STAR. Columns are washed to remove unbound proteins, and ADA are eluted and neutralized (also on the Microlab STAR) prior to testing in the LBA
Several challenges were encountered in automating the ADA enrichment, starting with high background. As shown in Fig. 4a, the high background signals were observed across 6 replicates of NC serum as well as 6 replicates of assay buffer (AB), suggesting the cause of the nonspecific signal was not unique to matrix. For reference, NC serum processed using the manual ADA enrichment procedure produced on average a signal of 74 RLU in the LBA. Further, the variability of signals between replicates (regardless of group) was also concerning (CV of 26% for NC and 49% for AB).
Fig. 4
Investigating and addressing high background. a Six replicates of negative control (NC) serum or assay buffer (AB) were processed using the automated ADA enrichment procedure with SA PhyTip® columns and tested in the LBA on the MSD platform. b Assay buffer was processed using the automated ADA enrichment procedure with SA PhyTip® columns (12 replicates) or CO-RE® II tips as control (12 replicates) and tested in the LBA. c NC serum (3 replicates per group) was processed using the automated ADA enrichment procedure with 3 variations of the SA PhyTip® columns. Each variation had a certain component of the column removed or replaced with an alternative material
As the high background was also observed in AB, we hypothesized that the high signals were somehow associated with the SA PhyTip® columns themselves. To test this hypothesis, we compared SA PhyTip® columns with standard Hamilton CO-RE® II tips. As shown in Fig. 4b, the high background persisted in assay buffer replicates processed with SA PhyTip® columns, whereas replicates processed with CO-RE® II tips produced assay signals typical of a LBA on the MSD platform. Based on this observation, we collaborated with scientists at Biotage® to test various versions of SA PhyTip® columns to pinpoint the component(s) responsible for the high background. By testing SA PhyTip® columns with certain components of the columns removed or replaced with an alternative material, we identified a variation of the columns that addressed the high background. As shown in Fig. 4c, PhyTip® columns packed with an alternative source of SA resin (Variation 3) produced significantly lower background signals and with less variability across 3 replicates (CV of 13%). While the background was still high (mean of 237 RLU) compared to the background observed with manual ADA enrichment, we were encouraged to move forward with Variation 3 to evaluate its ability to enrich ADA for testing in the LBA.
Having significantly reduced the background using Variation 3, we sought to test the effectiveness of the automated ADA enrichment procedure. As shown in Fig. 5, serum samples containing PC at 100 ng/mL spiked with drug at 0.5 or 1.5 mg/mL produced robust S/N ratios of 17.1 and 3.58 (mean of two replicates per condition), respectively. At both spiked drug concentrations, the S/N ratios obtained with automated ADA enrichment were reduced when compared with manual BEAD procedures (17.1 vs 23.6 at 0.5 mg/mL spiked drug and 3.58 vs 6.25 at 1.5 mg/mL spiked drug). While the S/N ratios were lower using the automated ADA enrichment procedure, they remained substantially above the screening cut point. For reference, in the same experiment, in the absence of spiked drug, the PC at 100 ng/mL produced a S/N ratio of 125 (mean of two replicates); this ratio was omitted from the graph to aid visualization. While not tested for drug tolerance, in this experiment, the PC at 10 ng/mL and 1 ng/mL produced ratios of 15.3 and 2.22 (mean of 7 replicates per condition), respectively. Overall, the S/N ratios of PCs processed with the automated ADA enrichment method were lower than those of PCs processed with the manual method. Several reasons may have accounted for this disparity, including the use of streptavidin resin vs SpeedBeads and fluid dynamics of tip-bound resin vs loose beads.
Fig. 5
Drug tolerance results for samples processed using the automated ADA enrichment procedure with SA PhyTip® columns. Serum samples containing 100 ng/mL of PC were spiked with drug at 0.5 and 1.5 mg/mL, mixed at ambient temperature for at least 1 h, and frozen at −70°C. Samples were thawed, processed using the automated ADA enrichment procedure with Variation 3 of the SA PhyTip® columns, and tested in the LBA based on MSD platform. Data are the mean of 2 replicates per condition
Aside from adequate sensitivity and drug tolerance, other critical assay characteristics (e.g., precision) must be validated before a LBA can be used for ADA detection in a clinical trial setting. To gauge the likelihood of successful validation of a LBA using the automated ADA enrichment procedure, we performed two experiments to assess and optimize intra-assay precision. As shown in Table I, intra-assay precision improved across two separate runs. Between runs 1 and 2, main parameters of the automated ADA enrichment procedure were not changed. However, changes were made to settings on the Hamilton automated system (e.g., reduced wash cycles), which also enhanced ADA recovery (higher S/N ratios in Run 2 for both QCs).
Table I Improvement of QC Performance Across Two Intra-assay Experiments
Comments (0)