
Remember me
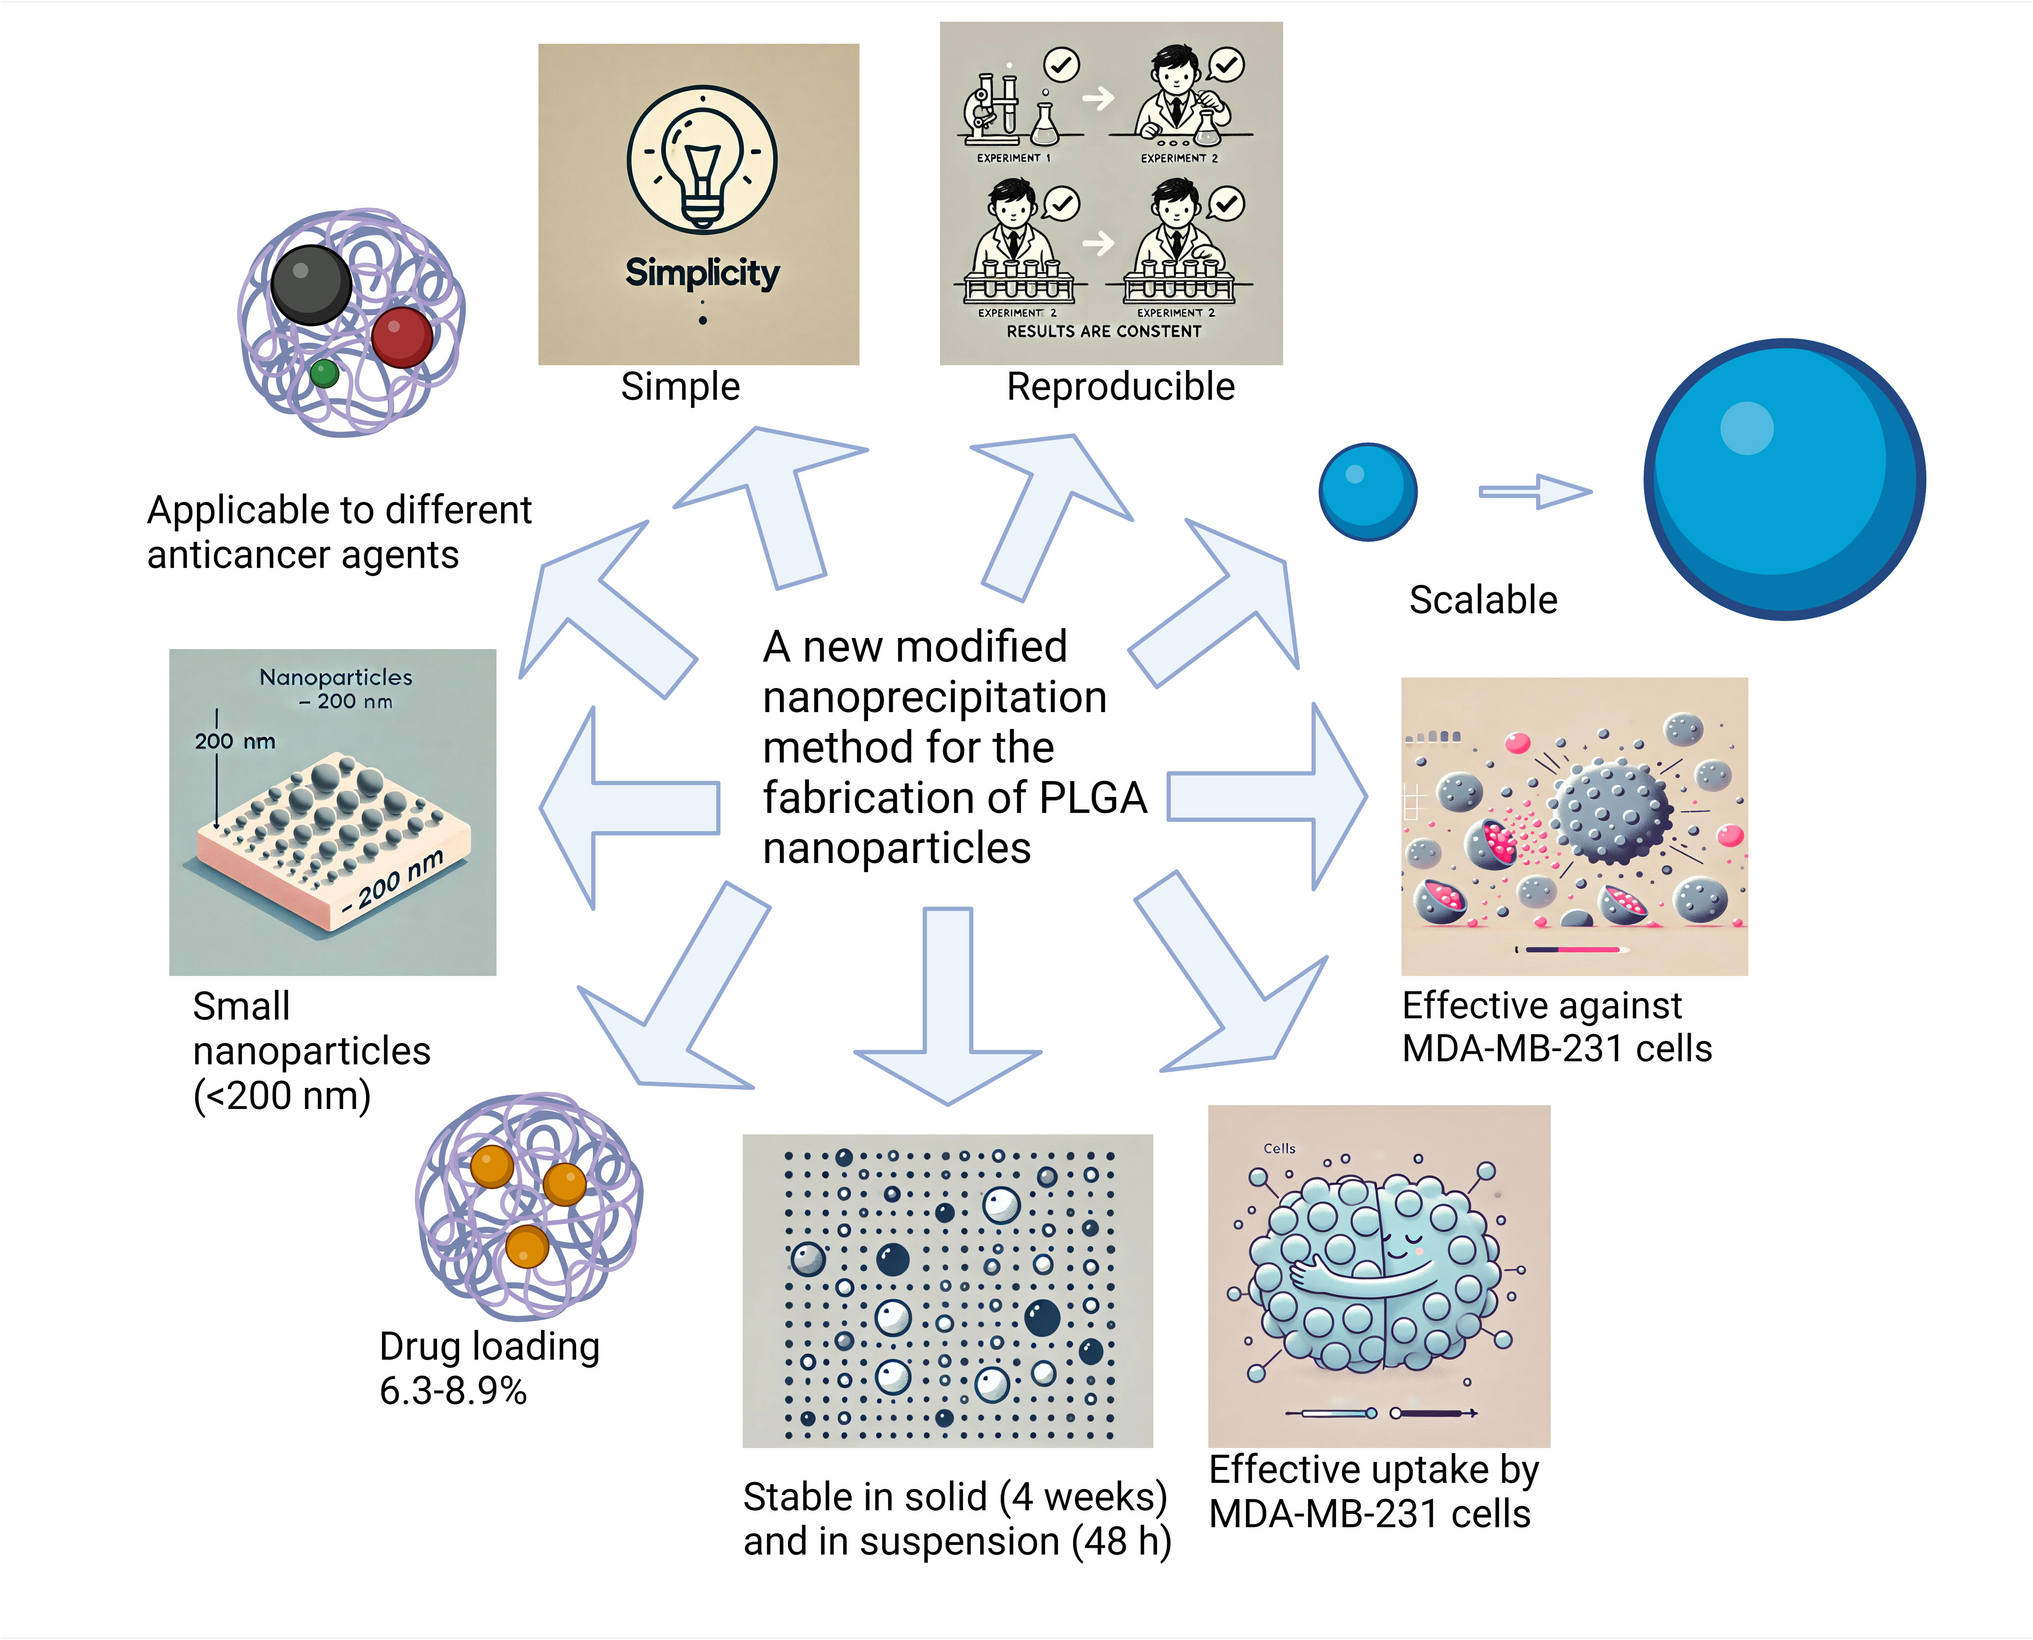
The main goal of this research was to develop a PLGA-based nano system for the delivery of hydrophobic anticancer agents (using PTX, DTX or Cur as model drugs) that is able to overcome most of the key early-stage physicochemical hurdles for clinical translation. For this purpose, in this research we carried out over 80 experiments by exerting variations in different parameters reported in the originally published nanoprecipitation methods for PTX-loaded PLGA nanoparticles fabrication (28). Three main nanoprecipitation approaches (methods A – C) were modified and studied until an optimum method was reached. The sequential precipitation of PTX and PLGA using a mixture of organic solvents (method C) was successful in producing smaller nanoparticles with lower PDI values than methods A and B owing to the use of multiple water soluble organic solvents as the organic phase in comparison to one organic solvent in methods A and B (p > 0.05). On the other hand, the escape of those organic solvents to the aqueous phase upon mixing resulted in a notable escape of PTX as well to the aqueous phase which resulted in poor drug loading (p = 0.08) (17, 31). On the other side, dissolving both PTX and PLGA in one organic solvent and the precipitation in the aqueous phase at one time point (method A) yielded nanoparticles with higher drug loading and encapsulation efficiency than the other two approaches (p < 0.05) (Table 1). Given that both the drug and polymer were co-dissolved in a single organic phase in Method A, it is likely that the active molecule was more uniformly dispersed within the PLGA matrix during nanoprecipitation, resulting in higher drug loading and consistent particle morphology compared to the sequential methods (B and C), where increased drug diffusion may have limited homogeneous entrapment.
Table 1 Comparison of physicochemical properties of nanoparticles prepared using different nanoprecipitation methodsIn the following section, we analyse the impact of various formulation and processing parameters on the key characteristics of PLGA nanoparticles, including size, PDI, drug loading, and encapsulation efficiency (Tables 1 and 2 in supporting information).
Organic and Aqueous Phase RatioAltering the organic phase to aqueous phase ratio from 1:4 to 1:2 resulted in a marked increase in nanoparticle size and PDI values, alongside a modest increase in drug loading (p > 0.05). This suggests that a higher organic phase volume favours the formation of larger particles with slightly improved loading efficiency, likely due to enhanced solubilization of the drug in the organic phase (32).
StabilizersThe choice of stabilizer played a critical role in modulating nanoparticle characteristics. The use of Poloxamer 188 yielded smaller nanoparticles with lower PDI values compared to SLS, TPGS, and PVA (p = 0.14). In contrast, TPGS, despite producing larger particles due to its bulky structure, demonstrated the highest drug loading and encapsulation efficiency (p = 0.03), consistent with its known emulsifying properties (33, 34). Notably, nanoparticles stabilized with SLS exhibited a strongly negative zeta potential due to the anionic nature of the surfactant (35).
Drug RatioIncreasing the drug ratio from 1:50 to 1:10 resulted in a notable increase in nanoparticle size (p > 0.05), PDI (p > 0.05), drug loading (p = 0.006), and encapsulation efficiency (p > 0.05). This trend aligns with expectations, as higher drug content leads to greater particle mass and loading capacity (36).
SolventsThe choice of solvent also affected nanoparticle size. The use of DMSO led to smaller particles (p > 0.05), although DMSO residues were detected in the final product, posing a potential issue for downstream applications. DMF produced ultra-small nanoparticles; however, these particles were challenging to separate by centrifugation, and methanol caused aggregation, likely due to its poor solubility with PLGA (37, 38).
Temperature and FiltrationVariations in experimental temperature and filtration of nanoparticle suspensions prior to centrifugation did not produce significant changes in nanoparticle characteristics (p > 0.05).
Stirring SpeedAn increase in magnetic stirring speed from 500 rpm to 1,500 rpm resulted in larger particles with higher PDI values (p = 0.08), indicating that stirring intensity influences particle coalescence and size distribution. These results are different from the previously reported results that showed that nanoparticles size generally tends to decrease with increasing the stirring speed (39).
Centrifugation SpeedCentrifugation speeds above 25,000 rpm led to aggregation of nanoparticles, forming hard aggregates that were difficult to redisperse in water.
Freeze-DryingFreeze-drying resulted in a substantial increase in nanoparticle size across experiments (p < 0.001), consistent with previous reports (40). This issue was mitigated by adding mannitol to the suspension prior to freeze-drying, which helped preserve particle size. Additionally, sonication and filtration of the suspension through a 0.45 µm filter post-freeze-drying further reduced particle size, with the smallest particles obtained when mannitol was included in the suspension during freeze-drying (p < 0.001).
Size and Zeta PotentialAs summarized in Table 2, all nanoparticles had an average size below 200 nm for the passive targeting of tumours. In addition, the PDI values across all formulations were below 0.34, indicating a semi-narrow size distribution of nanoparticles. The nanoparticles fabricated in our study exhibited moderately negative zeta potentials, which suggests sufficient stability for prolonged suspension. Furthermore, the minimal variation in Z-average, PDI, and zeta potential values between different batches indicates the reproducibility of our fabrication methods. The standard deviations and coefficients of variation calculated from multiple batches further confirm the consistency of our nanoparticle production. Figure 2 shows the results from DLS for size examination.
Fig. 2
Size measurement as reported by DLS for A PTX nanoparticles, B Curcumin nanoparticles, C DTX nanoparticles and D void nanoparticles. The average sizes of different nanoparticles were below 200 nm with unimodal particle size distribution
Table 2 DLS Parameters for Nanoparticles Encapsulating PTX, DTX, and CurcuminSEM Analysis of the Nanoparticles Size MeasurementsSEM analysis was used to measure the sizes of PTX, curcumin, DTX, and void nanoparticles (Fig. 3). The size ranges observed for these nanoparticles were as follows: PTX nanoparticles (105.7–424.6 nm), curcumin nanoparticles (112–180 nm), DTX nanoparticles (40.6–81.3 nm), and void nanoparticles (102.4–268.1 nm). It is noteworthy that all types of nanoparticles displayed a significant population of small nanoparticles (below 200 nm), which is particularly desirable for cancer therapy applications.
Fig. 3
SEM images obtained for (1) PTX, (2) curcumin, (3) DTX and (4) void nanoparticles. Nanoparticles were dispersed in water, sonicated and placed on a silicon wafer and then left to dry. Gold (2.5 nm) was used to coat the nanoparticles before examining them. A significant population of each type of nanoparticles had a size below 200 nm
Morphology of NanoparticlesIn addition to size, SEM images provided insight into the morphology of the nanoparticles. The images confirmed that the nanoparticles were primarily spherical, with the exception of DTX nanoparticles, which exhibited a semi-spherical shape. This information on nanoparticle morphology is crucial, as spherical nanoparticles are generally more favourable for drug delivery due to their consistent surface area and volume ratio, which influences drug release rates.
Drug Loading and Encapsulation EfficiencyOur reported methods produced nanoparticles with drug loading of 6.3–8.9% which helps with the delivery of sufficient amounts of the payload to tumour sites. The higher the encapsulation efficiency, the less waste of the payload during fabrication. Results for encapsulation efficiency were over 50% which may indicate the suitability of the reported fabrication methods for production of nanoparticles in a larger scale. This is also supported by the yield percentage obtained after fabrication (39–54.7%). The minimal variation in drug loading values across batches reflects the high reproducibility of our optimised fabrication method, which was selected after excluding earlier formulations that yielded inconsistent results despite acceptable size and loading outcomes. Results are summarized in Table 3.
Table 3 Drug Loading (%), Encapsulation Efficiency (%) and Yield (mg and %) of PTX, Curcumin, DTX and Fluorescent PTX Nanoparticles In Vitro Release of the Loaded Drug, and Stability Studies in Solid State and in SuspensionIn vitro release studies were conducted using PTX, DTX and curcumin nanoparticles. As for PTX nanoparticles, no PTX was detected by HPLC during the 72-h examination period of PTX nanoparticles. In addition, the developed PTX nanoparticles were stable over 4 weeks when stored at 4–8°C in a solid form. This was based on the measured parameters by the DLS including hydrodynamic size. The mean particle size remained below 200 nm throughout the four weeks, with average PDI values consistently below 0.24 (Fig. 4A). Furthermore, based on the same DLS criteria, PTX nanoparticles remained relatively stable in suspension for up to 48 h. The mean nanoparticle size stayed around or below 200 nm at all time points, only exceeding 240 nm at 72 h. The average PDI values were consistently below 0.37 for all time points, rising above 0.4 at 72 h (Fig. 4B). Similarly, curcumin nanoparticles demonstrated high in vitro stability, with minimal curcumin release (less than 12%) after 72 h (Fig. 5). In contrast, DTX nanoparticles exhibited the typical biphasic release pattern observed in PLGA nanoparticles. There was an initial burst release of DTX within the first 2 h, followed by a sustained release over the 72-h period. As reported in the literature, the initial burst release is typically due to the dissolution of the drug on the surface and outermost layers of the nanoparticles, while the sustained release is attributed to drug diffusion and matrix erosion of the nanoparticles (41).
Fig. 4
Stability study of PTX nanoparticles in A solid state and B suspension. Hydrodynamic size of the developed PTX nanoparticles was measured using DLS to assess stability over time. Mean values are reported with error bars representing standard deviation values (n = 3)
Fig. 5
In vitro release of DTX and curcumin nanoparticles over a 72-h period analysed using HPLC. Mean values are reported with error bars representing standard deviation values (n = 3)
Three-fold Scaling up of PTX Nanoparticle FabricationThe first scaling-up of PTX nanoparticles production, increasing the scale threefold, was successful and maintained the major physicochemical properties of the nanoparticles. Nanoparticles produced from the upscaling process had a Z-average of 120.4 ± 25.58 nm, zeta potential of −26.5 ± 1 mV, drug loading (%) of 7.04 ± 1.05%, encapsulation efficiency (%) of 63.8 ± 9.5% and yield of 135.9 mg (64.7%). Compared to small-scale batches, the average nanoparticle size decreased by 30.5%, the zeta potential shifted by 30.9%, drug loading decreased by 9.5%, and encapsulation efficiency increased by 8.6%.
In Vitro Cell Viability StudiesThe PLGA-based nanoparticles underwent different preliminary in vitro biological analysis to investigate some of their properties in cells prior to testing in animals. Antiproliferative/cytotoxic activity resazurin assay, which is commonly used for the quantification of the live cells, was used to examine the viability of MDA-MB-231 cells following exposure to different treatments (Fig. 6A and B).
Fig. 6
Antiproliferative effects of A PTX, B curcumin, C DTX, and D low concentrations of PTX were assessed using the Alamar Blue assay. Mean results are reported with error bars representing standard deviation values (n = 3). Statistical significance, indicating differences between nanoparticle formulations, free drugs, and void nanoparticles, is explained in the text
PTX NanoparticlesPTX nanoparticles showed a significantly higher cytotoxicity than void nanoparticles and the free drug (p < 0.05). While statistical analysis showed significantly less viability in the PTX nanoparticle-treated cells compared to the void, this difference was small in value, indicating some inherent antiproliferative activities of the nanoparticle composition without the payload.
Curcumin NanoparticlesCurcumin nanoparticles showed a significantly higher cytotoxicity than void nanoparticles and the free drug (p < 0.05).
DTX NanoparticlesDTX nanoparticles were equally effective as the void nanoparticles with insignificant difference in their cytotoxicity (p > 0.05, Fig. 6C). However, both nanoparticles were significantly more effective than free DTX similar to free PTX compared to PTX nanoparticles. For free DTX, up to a maximum of 30% cell growth inhibition and for free PTX, up to 23% antiproliferative activity was observed even at concentrations above 150 µg/mL.
Enhanced Discrimination of Formulation Effects at Lower DosesIt was deemed necessary to conduct another cell viability assay focusing on the low concentration ranges (below 2.5 µg/mL), based on the flow cytometry analysis results. At higher concentrations, the void nanoparticles exhibited cytotoxic effects comparable to the drug-loaded nanoparticles, suggesting some inherent activity. However, this pattern shifted at lower concentrations, where the void nanoparticles became ineffective, while the PTX-loaded nanoparticles remained significantly more effective in inducing cell cytotoxicity (p < 0.05).
Cell Death and Apoptosis Induction Assay by Flow CytometryThe induction of apoptotic cell death was assessed by flow cytometry using Annexin V and PI staining, employing a lower concentration of PTX nanoparticles (0.1 µg/mL equivalent to PTX) than in the antiproliferative studies. The percentage of cells positive for both Annexin V and PI was used as a measure of total cell death. PTX nanoparticles were significantly more effective in inducing total cell death (71.2%) compared to the control treatments, including RPMI alone (25.2%, p < 0.01), vehicle control (0.25% DMSO in RPMI) (22.2%, p < 0.05), and void nanoparticles (19.67%, p < 0.01).
Additionally, while PTX nanoparticles induced higher levels of total apoptotic cell death (71.2%) compared to free PTX dissolved in RPMI (53.53%) and free PTX dissolved in the vehicle (69%), these differences were not statistically significant (Fig. 7A and B). This data suggests that the nanoparticle formulation enhances apoptotic cell death compared to control treatments, likely due to the improved delivery and cellular uptake of PTX within the nanoparticles. Although the comparison between PTX nanoparticles and free PTX did not reach statistical significance, the trend indicates a potentially enhanced apoptotic effect when PTX is delivered in nanoparticle form.
Fig. 7
Apoptosis assay in MDA-MB-231 cells treated with fabricated nanoparticles, assessed using Annexin V/PI staining. A Representative images of different treatment groups and B quantification of early (Annexin V-positive), late (PI-positive), and total apoptosis across three experimental replicates. Mean results are reported with error bars representing standard deviation values (n = 3). Statistical significance was determined using two-way ANOVA, with ** p < 0.01, * p < 0.05 and ns non-significant
Further breakdown of total apoptotic cell death induction to early (AnnexinV- positive) and late (PI-positive) apoptosis showed that PTX nanoparticles (42.3%) were significantly more effective in the induction of early apoptosis than PTX dispersed in RPMI by sonication (23.7%, p < 0.05). The levels of PI uptake (late apoptosis), however, were not different from PTX dissolved in RPMI. (Fig. 7B). PTX has been proven to induce cell death in both early and late phases (42). TPGS has been reported to induce early apoptosis in vitro and this may be an explanation for the enhanced effect of PTX nanoparticles on early apoptosis (43).
Measurement of PTX Nanoparticles'Uptake by Flow CytometryTo determine the cellular uptake of nanoparticles, we utilized fluorescein-labelled PTX nanoparticles and curcumin nanoparticles. The PTX nanoparticles served as a representative of nanoparticles with a fluorescent shell, while curcumin nanoparticles represented those with a fluorescent payload encapsulated in the core. After 24 h of incubation, up to 95.5 ± 1% of cells showed uptake of fluorescent PTX nanoparticles and 87.2 ± 1.3% of cells showed uptake of curcumin nanoparticles (Fig. 8A and B).
Fig. 8
Uptake study analysed by flow cytometry for cells treated with A fluorescein-labelled PTX nanoparticles (Fluo NPS) and B curcumin nanoparticles (Curcumin NPS), with RPMI as the control. The bracket in each graph defines the gate for positive fluorescence signal
Uptake Study by CLSMCLSM was used to visualise the uptake of nanoparticles loaded with fluorescein-labelled PLGA nanoparticles loaded with PTX after 24 h incubation at two concentrations equivalent to PTX (7.5 and 15 µg/mL). The fluorescent PTX nanoparticles were effectively taken up by MDA-MB-231 cells and were primarily localised within the cytoplasm. As the concentration of PTX nanoparticles increased, more nanoparticles were observed surrounding the nucleus, suggesting a concentration-dependent internalisation and distribution pattern (Fig. 9).
Fig. 9
Uptake of fluorescent PTX nanoparticles by CLSM at PTX-equivalent concentrations of 7.5 or 15 µg/mL. Cells were treated with PTX nanoparticles, and their uptake was visualized using CLSM. The left column shows the nuclei of the cells stained with DAPI. The middle column displays the fluorescence corresponding to the uptake of nanoparticles in the fluorescein channel. The right column shows the merged images from both the DAPI and fluorescein channels
Furthermore, a mean nuclear size was measured at 103 ± 45.3 µm, 185 ± 104 µm and 200 ± 165 µm was measured following treatment with RPMI, PTX nanoparticles (PTX concentration 7.5 µg/mL and 15 µg/mL), respectively. The data revealed an enlargement of the nucleus after treatment with PTX nanoparticles, which exhibited a dose-dependent effect. This nuclear enlargement could indicate a stress response, or apoptosis-related changes induced by the PTX nanoparticles, as previous studies have shown that cytoskeletal disruptions and nuclear morphological changes are commonly associated with drug-induced apoptosis (44).
The results from the second study, shown in Fig. 10, demonstrate the presence of free PTX within MDA-MB-231 cells following treatment with PTX nanoparticles. This was confirmed by detecting the free PTX using an antibody specific to PTX. These findings confirm the successful loading of PTX within the nanoparticles and its subsequent release into the cells after nanoparticle uptake. Notably, as the concentration of the PTX equivalent increased, a stronger PTX signal was observed within the cells, indicating a dose-dependent release and accumulation of PTX. Furthermore, PTX nanoparticles showed a higher intracellular PTX signal compared to free PTX in DMSO, demonstrating the improved delivery and release efficiency of the nanoparticle formulation. This highlights the superior ability of PTX nanoparticles to deliver and retain the drug inside cells, enhancing its potential efficacy.
Fig. 10
Uptake of PTX nanoparticles and free PTX in DMSO by CLSM at PTX-equivalent concentrations of 7.5 or 15 µg/mL. Cells were treated with either PTX nanoparticles or free PTX dissolved in DMSO, and the uptake was visualized using CLSM. The left column shows the nuclei of the cells stained with DAPI. The middle column displays the fluorescence corresponding to the uptake of PTX in the rhodamine channel. The right column shows the merged images from both the DAPI and rhodamine channels
Comments (0)