
Remember me
A total of 111 people with diabetes (PwD) were enrolled in this retrospective observational study conducted across 29 healthcare centers in India. The mean age of participants was 53.2 years (SD 11.4), with an age range spanning from 26 to 82 years. Among the 81 PwD with documented diabetes history, the average duration of diabetes was 10.9 years (SD 6.3), with a range from 0.01 to 31 years. The remaining 30 participants did not have a recorded duration of diabetes (date of initial diagnosis).
Comorbid conditions were prevalent among the study population, with hypertension (n = 16) and diabetic neuropathy (n = 12) being the most frequently reported. These baseline characteristics reflect a diverse and clinically relevant population, representative of real-world diabetes management scenarios in India. Table 1 provides a detailed summary of demographic and clinical baseline characteristics.
Table 1 PwD demographics and baseline characteristicsIn the analysis of blood glucose monitoring frequency, a total of 111 PwD were initially considered. However, 19 PwD did not meet the inclusion criteria and were subsequently excluded from the analysis. Therefore, the final analysis for blood glucose monitoring frequency was conducted on 92 PwD.
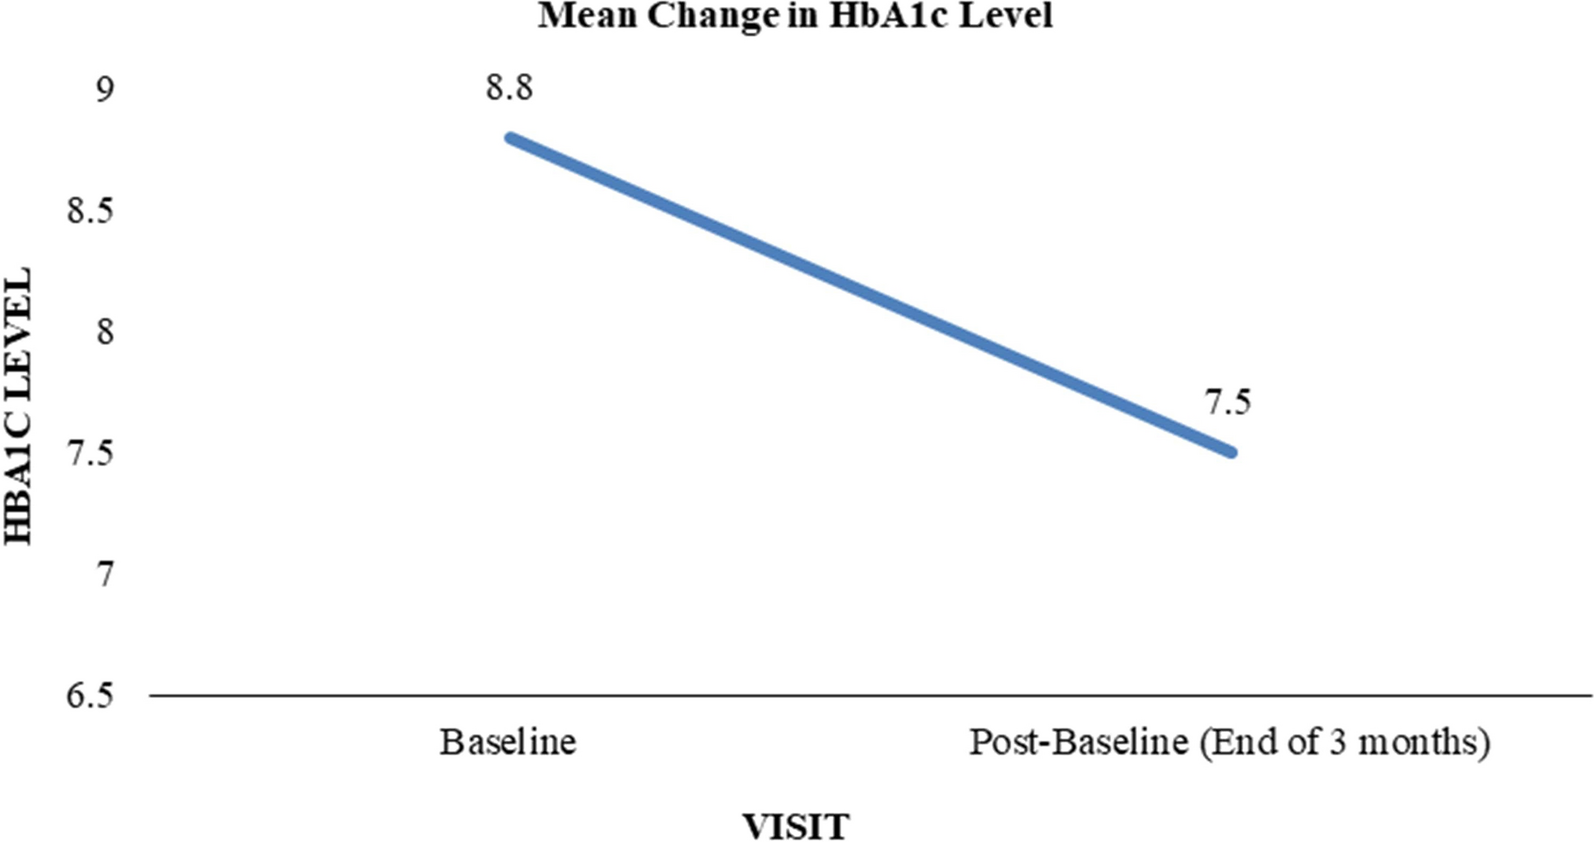
Primary Outcome: Glycemic Control (Absolute Reduction in HbA1c)The primary endpoint of the study was the change in HbA1c levels over 3 months of using the mySugr® mobile health application in conjunction with the Accu-Chek® Instant blood glucose meter. At baseline, the mean HbA1c level was 8.8% (SD 1.9). After 3 months of app usage, the mean HbA1c significantly decreased to 7.5% (SD 1.0), representing a mean reduction of 1.3%-points (SD 1.6). This change was statistically significant (p < 0.0001), indicating a clinically meaningful improvement in glycemic control.
This reduction in HbA1c underscores the potential of digital health tools to support better diabetes self-management and improve clinical outcomes in a real-world setting. Figure 1 illustrates the mean change in HbA1c levels from baseline to the end of the study period.
Fig. 1
Mean change in HbA1c levels. HbA1c glycated hemoglobin
Secondary OutcomesFrequency of Hypoglycemic and Hyperglycemic EventsDuring the 3-month observation period, participants recorded an average of 1.9 hypoglycemic events (defined as blood glucose < 70 mg/dL) and 20.0 hyperglycemic events (defined as blood glucose > 180 mg/dL). The number of hypoglycemic events ranged from 0 to 30, while hyperglycemic events ranged from 0 to 124. The most frequently reported number of hypoglycemic events was 0, indicating that many participants did not experience low blood glucose episodes during the study. In contrast, the most common number of hyperglycemic events was 10.
Age-specific analysis revealed that PwD aged 20–30 years experienced the highest mean number of hypoglycemic events (mean 7), while those aged 30–40 years had the highest mean number of hyperglycemic events (mean 24.9). These findings suggest that while hypoglycemia was relatively infrequent, hyperglycemia remained a common challenge, particularly among younger adults.
Subgroup AnalysisAge-Based HbA1c ReductionSubgroup analysis based on age revealed that PwD aged 40–50 years experienced the most substantial improvement in glycemic control, with a mean HbA1c reduction of 1.6%-points. This suggests that middle-aged adults may derive particular benefit from structured self-monitoring and digital engagement in diabetes management. This age group may benefit from a combination of factors such as higher digital literacy, greater motivation to manage health due to mid-life responsibilities, and better adherence to self-monitoring and treatment regimens, which could contribute to the observed improvement [14, 16, 32].
Blood Glucose Monitoring FrequencyTo assess the impact of monitoring frequency on glycemic outcomes, participants were stratified into two groups: those who monitored their blood glucose levels ≥ 6 times per week (frequent monitors, n = 44) and those who monitored < 6 times per week (less frequent monitors, n = 48). Nineteen participants were excluded from this analysis because of incomplete data.
Frequent monitors demonstrated a greater reduction in HbA1c, from a baseline of 8.9% to 7.4%, representing a mean decrease of 1.5%-points. In contrast, less frequent monitors showed a reduction from 8.4% to 7.4%, a mean decrease of 1.0%-point. Both reductions were statistically significant (p < 0.0001, paired t test). However, the between-group comparison did not reach statistical significance, likely because of the relatively small sample sizes, which may have limited the statistical power to detect a difference. Figure 2 presents the HbA1c changes stratified by monitoring frequency.
Fig. 2
Mean change in HbA1c levels based on blood glucose monitoring (BGM) frequency. HbA1c glycated hemoglobin
Insulin Use and HbA1c ReductionParticipants were also stratified according to insulin use. The insulin-treated group (n = 41), who were already on insulin therapy before the study, had a higher baseline HbA1c of 9.3%, which decreased to 7.6% after 3 months, reflecting a mean reduction of 1.6%-points. The non-insulin group (n = 70) showed a reduction from 7.9% to 7.1%, a mean decrease of 0.8%-points. Both reductions were statistically significant (p < 0.0001, paired t test). Although the insulin group demonstrated a more pronounced improvement, the between-group comparison did not achieve statistical significance, again likely because of sample size limitations. Figure 3 illustrates the HbA1c changes by insulin use.
Fig. 3
Mean change in HbA1c levels based on insulin use. HbA1c glycated hemoglobin
These findings suggest that insulin-treated PwD may benefit more from structured monitoring and digital engagement, possibly because of the greater need for precise glucose control and dose adjustments.
System Usability and Satisfaction: PwD' Satisfaction with the mySugr® AppUser satisfaction was assessed using the SUS, a validated tool for evaluating perceived usability. The overall SUS score for the mySugr® app was 70, which is above the average benchmark of 68 and reflects “acceptable usability with room for improvement,” according to standard SUS interpretation [25]. This indicates that the app was generally well received by users.
Approximately 50% of PwD expressed a desire to use the app frequently, and 51% found it easy to use. Additionally, 44% reported feeling confident in using the app. These findings suggest that the app’s interface and functionality were accessible and user-friendly, which is critical for sustained engagement and long-term adherence to self-monitoring practices. Figure 4 summarizes the responses to the satisfaction survey.
Fig. 4
PwD/end-user satisfaction survey result. PwD people with diabetes
Healthcare Provider (HCP) FeedbackIn a survey conducted with HCPs, the effectiveness of the mySugr® app in managing diabetes was evaluated. The survey aimed to gather insights from HCPs on the perceived benefits of the app in reducing HbA1c levels among PwD. A total of 29 HCPs participated in the survey, providing valuable feedback on their experiences with the mySugr app. All HCPs reported observing significant benefits associated with the use of the mySugr® app, including:
1.Improved adherence: PwD demonstrated better adherence to treatment regimens, facilitated by the app’s reminders and logging features.
2.Enhanced glucose control: HCPs observed notable improvements in glucose levels of PwD, attributing this to the app’s ability to provide real-time data sharing, which enabled timely interventions and adjustments to therapy.
3.Optimized treatment management: The app supported more informed clinical decision-making, particularly in insulin dose titration and medication adjustments.
HCPs emphasized that the app’s ability to visualize glucose trends and patterns helped both clinicians and patients identify areas for improvement and make data-driven decisions. The integration of self-monitoring data into routine care workflows was seen as a key advantage, enhancing the personalization of diabetes management.
Comments (0)