
Remember me

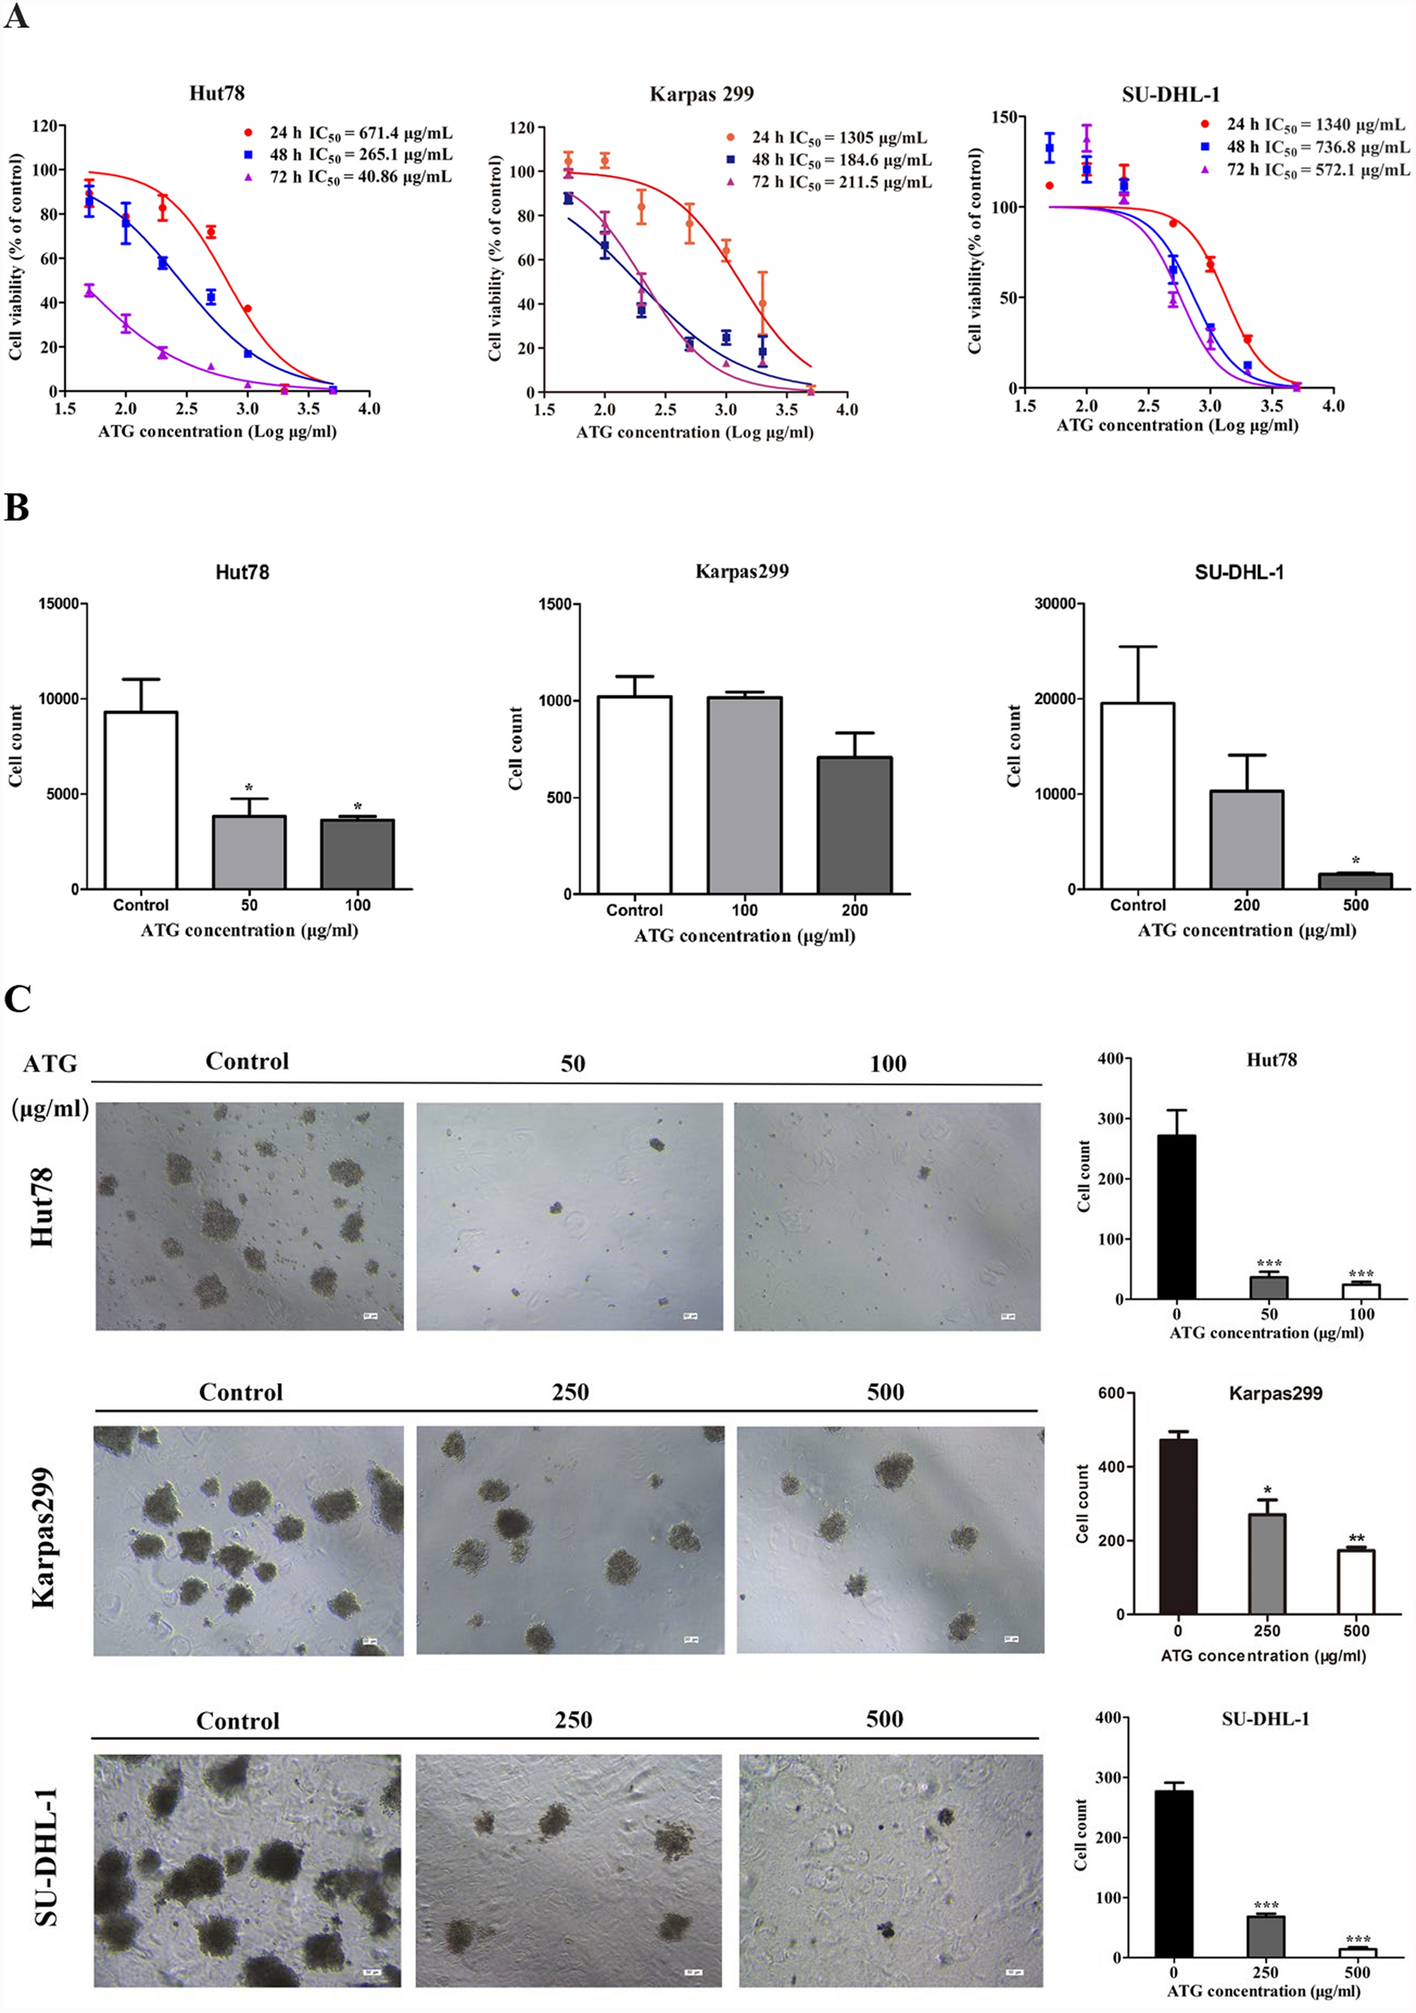


To assess the cytotoxicity and establish the dose range of ATG in Hut78, Karpas299 and SU-DHL-1 cell lines, we treated cells with serial concentrations of ATG (50 μg/mL, 100 μg/mL, 200 μg/mL, 500 μg/mL, 1000 μg/mL, 2000 μg/mL, and 5000 μg/mL) and normal rabbit IgG (100 μg/mL) serving as a control. Treatments were administered at 24 h, 48 h, and 72 h, followed by CCK-8 assay. ATG significantly inhibited cell viability in a dose- and time-dependent manner across all three PTCL cell lines (Fig. 1A). According to the results of cell growth assay, we selected dose ranges of 50–200 μg/mL, 100–500 μg/mL, and 200–1000 μg/mL for Hut78, Karpas299, and SU-DHL-1 cell lines, respectively, and a 24 h treatment time point for further study. The selected doses-maintained cell viability above 80% in all three PTCL cell lines.
Fig. 1
ATG inhibits cells proliferation and attenuates cell invasion and inhibits colony formation in PTCL cells. A Cell viability was examined by CCK-8 assay per the manufacture’s instruction. Cells were seeded into 96-well plates with 5000 cells per well and treated with ATG (50–5000 μg/ml) for 24, 48 and 72 h. Cell viability was detected using CCK-8 assay according to the manufacture’s introduction. B Cells at 2 × 10⁵ were seeded in the upper chamber (precoated with Matrigel at 1:9 gel/culture medium without FBS) of transwell chamber treated with either normal rIgG (100 μg/ml) or ATG for 24 h, and culture medium in the lower chamber (containing 20% FBS) was collected for cell numeration by flow cytometry. C Effect of ATG was further tested by colony formation. Cells were seeded into 12-well plates with 2,000 cells per well and treated with a single dose of ATG at lower concentration range for 14 days. The colonies were photographed under a Leica DMI4000 microscope. Note: *p < 0.05, **p < 0.01, ***p < 0.001 by one-way ANOVA, followed by Dunnett’s test or Tukey’s test; N = 3; Error bars = S.D
Furthermore, we investigated whether ATG treatment inhibited cell invasion and colony formation of PTCL cells. As depicted in Fig. 1B, the transwell assay demonstrated a remarkable reduction of cells in the lower chamber after ATG treatment. Specifically, 50 μg/mL of ATG inhibited cell invasion of Hut 78 cells, whereas 200 μg/mL of ATG inhibited invasion of Karpas 299 and SU-DHL-1 cells.
The colony formation assay showed that ATG treatment notably reduced the colony formation counts. As shown in Fig. 1C, the number of cell colonies decreased in Hut 78 cells treated with 50 μg/mL ATG, and in Karpas299 and SU-DHL-1 cells treated with 250 μg/mL ATG. These results indicate that ATG inhibits the invasion ability of PTCL cell lines, with Hut78 cells exhibiting the highest sensitivity to ATG among the three cell lines.
ATG-induced apoptosis in PTCL cellsWe evaluated whether ATG could induce apoptosis in Hut78, Karpas299, and SU-DHL-1 cells from three aspects: dose-dependent apoptosis measured using flow cytometry based on fluorescein isothiocyanate (FITC) annexin V and propidium iodide (PI) staining; mitochondrial membrane potential (∆Ψm) assessed using JC-1 staining; and apoptosis-specific morphological changes evaluated using Leica fluorescence microscopy with Hochst33258 staining. Figure 2A shows that ATG induced a notable increase in the percentage of both early (FITC annexin V-positive + PI-negative) and late (FITC annexin V-positive + PI-positive) apoptotic cells in a dose-dependent manner across the three PTCL cell lines. Specifically, in Hut78 cells, the percentage of apoptotic cells was 51.95%, 73.99%, and 89.65%, in response to 50 μg/mL, 100 μg/mL, and 200 μg/mL of ATG, respectively, compared to 9.25% with 100 μg/mL of control IgG; in Karpas299 cells, the percentage of apoptotic cells was 12.88%, 46.93%, and 94.91% in response to 100 μg/mL, 200 μg/mL, and 500 μg/mL of ATG, respectively, compared to 7.95% with control IgG; and in SU-DHL-1 cells, the percentage of apoptotic cells was 19.65%, 42.50%, and 75.44%, in response to 200 μg/mL, 500 μg/mL, and 1000 μg/mL of ATG, respectively, compared to 14.30% with control IgG.
Fig. 2
ATG induces apoptosis in peripheral T cell lymphoma. A Dose response. Cells treated with different concentrations of ATG for 24 h were stained with FITC Annexin-V and PE propidium iodide. Cell apoptosis was analyzed by flow cytometry. B Mitochondrial membrane potential. Cells were treated with ATG for 24 h followed by JC-1 staining and measured by flow cytometry. C Apoptotic morphology. Cells treated with a single dose of ATG were stained with Hoechst 33,258 staining solution and observed under fluorescence microscope. Note: *p < 0.05, **p < 0.01, ***p < 0.001 by one-way ANOVA, followed by Dunnett’s test or Tukey’s test. N = 3. Error bars = S.D
We observed dose-dependent apoptosis in PTCL cells under ATG treatment at 24 h indicated by the loss of mitochondrial membrane potential ∆Ψm (Fig. 2B). Control cells exhibited normal ∆Ψm, marked by the bright red fluorescence (JC-1 aggregates). In contrast, ATG-treated cells were marked by green fluorescence (JC-1 monomer), indicating a decline of mitochondrial ∆Ψm (Fig. 2B). When analyzing the ratio of red to green fluorescence intensity, we found that Hut78 cells were more sensitive to ATG-mediated cytotoxicity than Karpas299 and SU-DHL-1 cells (Fig. 2B), which was consistent with the results of the CCK-8 assay (Fig. 1A). In Hut78 cells, the ratio of aggregates/JC-1 monomer was 22.85, 4.01, 2.07, and 1.13 with 100 μg/mL normal rabbit IgG (rIgG) control, and ATG doses of 50 μg/mL, 100 μg/mL, and 200 μg/mL, respectively. In Karpas299 cells, ratio of JC-1 aggregates/JC-1 monomer was 84.15, 41.07, 9.72, and 1.08, with 100 μg/mL normal rIgG control, and ATG doses of 100 μg/mL, 200 μg/mL, and 500 μg/mL. In SU-DHL-1 cells, ratio of JC-1 aggregates/JC-1 monomer was 53.45, 37.40, 12.17, and 4.31, respectively, with 100 μg/mL normal rIgG control, and ATG doses of 200 μg/mL, 500 μg/mL, and 1000 μg/mL.
Finally, the cell morphological examination revealed cell shrinkage, nuclear condensation, and apoptotic bodies (Fig. 2C). Collectively, these results suggest that ATG induces apoptosis in PTCL cell lines.
ATG-induced extrinsic apoptosis through upregulating FAS in PTCL cellsTo elucidate the underlying mechanism of apoptosis, we examined the ATG-induced apoptosis rates in cells pretreated with different apoptotic pathway inhibitors, including the pan-caspase (z-VAD-fmk), caspase 8 (z-IETD-fmk), cathepsin B/D (E-64d), and cathepsin D (pepstatin A) inhibitors. We found that both z-VAD-fmk and z-IETD-fmk significantly inhibited ATG-induced cell apoptosis in all three cell lines, whereas the other two inhibitors had little effect on reversing ATG-induced cell apoptosis, except for E-64d in Hut78 cells (Fig. 3A). Notably, E-64d and pepstatin A enhanced apoptosis in Karpas299 and SU-DHL-1 cells, respectively (Fig. 3A). These results imply that ATG induces apoptosis in a caspase-dependent manner.
Fig. 3
ATG induces exogenous apoptosis through upregulating FAS in PTCL cell. A The pan-caspase inhibitor z-VAD-fmk, caspase 8 inhibitor z-IETD-fmk, Cathepsin B/D inhibitor E-64D or Cathepsin D inhibitor Pepstatin A were added to PTCL cells for 1 h before the addition of ATG. The cells were then incubated for 6 h with ATG at 50 and 100 μg/ml, then were stained with FITC Annexin-V and propidium iodide. Cell apoptosis was analyzed by flow cytometry. B Representative western blot results showing protein levels of cleaved caspase 8, cleaved caspase 3, and cleaved PARP in PTCL cells treated with ATG at the indicated concentration. C Hut78 cells pretreated with or without z-VAD-fmk, z-IETD-fmk were cultured with rATG (50 μg/ml) for 6 h, expression of apoptotic and apoptosis proteins was analyzed through western blot. D FAS (CD95) was regulated by ATG treatment at both the protein and mRNA levels. Note: *p < 0.05, **p < 0.01, ***p < 0.001 by one-way ANOVA, followed by Dunnett’s test or Tukey’s test. N = 3. Error bars = S.D
Considering apoptosis classification into intrinsic and extrinsic, we selected caspase 9 as a marker of intrinsic and caspase 8 as a marker of extrinsic apoptosis. Moreover, we detected changes in these two protein levels together with caspase 3, PARP, Bcl-2, and BAX after ATG treatment. Western blot analysis revealed that caspase 8, caspase 3, and PARP were activated after ATG treatment, while no changes were observed in the ratio between cleaved and intact Cas9, Bcl-2, or BAX protein levels (Fig. 3B; Fig. S1A), indicating activation of the extrinsic apoptosis pathway. Furthermore, inhibition with z-VAD-fmk and z-IETD-fmk attenuated ATG-induced caspase 3 and PARP activation (Fig. 3C). Notably, we found that FAS (CD95) was significantly upregulated by ATG treatment at both the mRNA and protein levels (Fig. 3D), indicating that ATG may activate the extrinsic apoptotic pathway by upregulating FAS protein expression. Collectively, these results suggest that ATG induces extrinsic apoptosis in PTCL cell lines.
ATG-induced complement-dependent cytotoxicity in PTCL cellsATG induces complement-mediated cell death [19,20,21,22]. To assess the effect of complement on ATG-induced cell death, cells were incubated with ATG for 1 h in the presence or absence of complement (20% in culture medium). As shown in Fig. 4A, B, the addition of complement significantly augmented ATG-induced cell death rates in all three cell lines, even in the ATG low-dose group. After incubation with complement added to ATG, the percentage of dead cells increased from 54.33% to 92.22%, 9.40% to 74.75%, and 34.89% to 94.46% in Hut78 (50 μg/mL), Karpas299 (100 μg/mL), and SU-DHL-1 (200 μg/mL) cells, respectively. Furthermore, the apoptosis rate of the three cell lines remarkably increased in the high-dose ATG group. These results suggest that ATG induces complement-dependent cytotoxicity in PTCL cells.
Fig. 4
ATG induces complement-dependent cytotoxicity in peripheral T cell lymphoma cells by flow cytometry. Cells were incubated with rIgG and ATG at different concentrations either in presence or absence of complement for 1 h, then the cells were stained with propidium iodide and were analyzed by flow cytometry. Note: *p < 0.05, **p < 0.01, ***p < 0.001 by one-way ANOVA, followed by Dunnett’s test or Tukey’s test. N = 3. Error bars = S.D
ATG exerted antitumor effect in a xenograft mouse model of PTCL in vivoWe established a xenograft nude mouse model with PTCL by subcutaneously implanting Karpas299 cells to investigate the effect of ATG and doxorubicin in vivo. One week after implantation, the average tumor volume was enlarged > 80 mm3. The mice were randomly divided into five groups comprising six mice per group. We observed an inhibitory tumor growth and a significant decrease in tumor volume in the high-dose ATG group (10 mg/kg/day, group C) (Fig. 5A–C). Tumor volume and weight were comparable between doxorubicin treatment group (2.5 mg/kg/day, group D) and control group (group A), whereas a substantial decrease in these parameters was observed in the combination group of ATG and doxorubicin (group E). The expression of cleaved Caspase 3 and the cleaved PARP were quantified, respectively, in paraffin sections of xenograft PTCL tumor with immunohistochemical staining, their expressions all presented an increasing trend in ATG group by comparison with that in control group, however, no statistical difference presented (Fig. 5D). The results suggested that the combination of ATG and doxorubicin exhibited an enhanced antitumor effect against PTCL in vivo.
Fig. 5
ATG exerted antitumor effect in a xenograft mouse model of PTCL in vivo. A Subcutaneous tumor size of Karpas299 cells in each treatment group. (a) control group, (b) ATG low-dose group, (c) ATG high-dose group, (d) Doxorubicin group, (e) combination group. B Tumor weight of subcutaneous tumor of mouse Karpas299 cells in each treatment group. C Growth curve and body weight change curves of subcutaneous tumor of Karpas299 cells in each treatment group. D Representative images of the HE and immunohistochemical staining of cleaved caspase 3, cleaved PARP in tumor sections (× 200 magnification), scale bar: 50 μM. Note: *p < 0.05, **p < 0.01, ***p < 0.001 by one-way ANOVA, followed by Dunnett’s test or Tukey’s test. N = 3. Error bars = S.D
Incorporation of ATG into chemotherapy regimens prolonged survival in one patient with PTCLConsidering the antitumor effect of ATG, we included it in chemotherapy regimens to assess its efficacy in patients with PTCL. A 60-year-old female patient was newly diagnosed with stage III AILT lymphoma with B symptoms. Initially, she received six courses of cyclophosphamide, doxorubicin, vincristine, etoposide, and prednisone (CHOEP) plus chidamide. The patient achieved complete remission on positron emission tomography/computed tomography after three courses of CHOEP plus chidamide. However, at five months, post-completion of the sixth chemotherapy cycle, the patient presented a relapse. Upon referral to our hospital, the patient was treated with dexamethasone, ifosfamide, cisplatin, and etoposide for two courses, followed by auto-HSCT with carmustine, etoposide, cytarabine, melphalan (BEAM) conditioning, with ATG administered at 2.5 mg/kg for one day at day 5. Presently, the patient has remained free from lymphoma for over 3.5 years. Conclusively, BEAM and ATG may play a synergistic role in eliminating lymphoma cells in patients with relapsed AILT.
Comments (0)