For this study, we enrolled a group of 134 healthy donors aged 18–60 years who had received three doses of the inactivated SARS-CoV-2 vaccine. Then, the T-cell responses specific to the S, N, M, E, and T pools were detected using the ICS method. As anticipated, the result showed a higher proportion of participants displayed T-cell responses to the T pool compared to the individual structural proteins, owing to the T pool’s comprehensive coverage of peptides from all four structural proteins. Consequently, the T pool-specific T-cell response offers a more comprehensive representation of the cellular immune response against SARS-CoV-2. Thus, our study concentrates on the analysis and predictive modeling for the response of T pool-specific T-cells.
Vaccination elicits both cellular and humoral immune responses, which collectively mediate immune protection. While inactivated vaccines primarily confer protection by inducing NAbs that block viral entry into host cells, their titers tend to wane significantly over time and exhibit reduced efficacy against variants bearing mutations in the spike protein. Nevertheless, previous studies have confirmed that BBIBP-CorV can also induce significant SARS-CoV-2-specific T-cell responses [33]. These T-cell responses, which target conserved viral epitopes, can endure for several years, thereby offering long-term protection against viral infections and variants [34]. Therefore, the magnitude of T-cell responses to SARS-CoV-2 within a population may serve as an indicator for resistance to SARS-CoV-2, and the potential need for booster immunization.
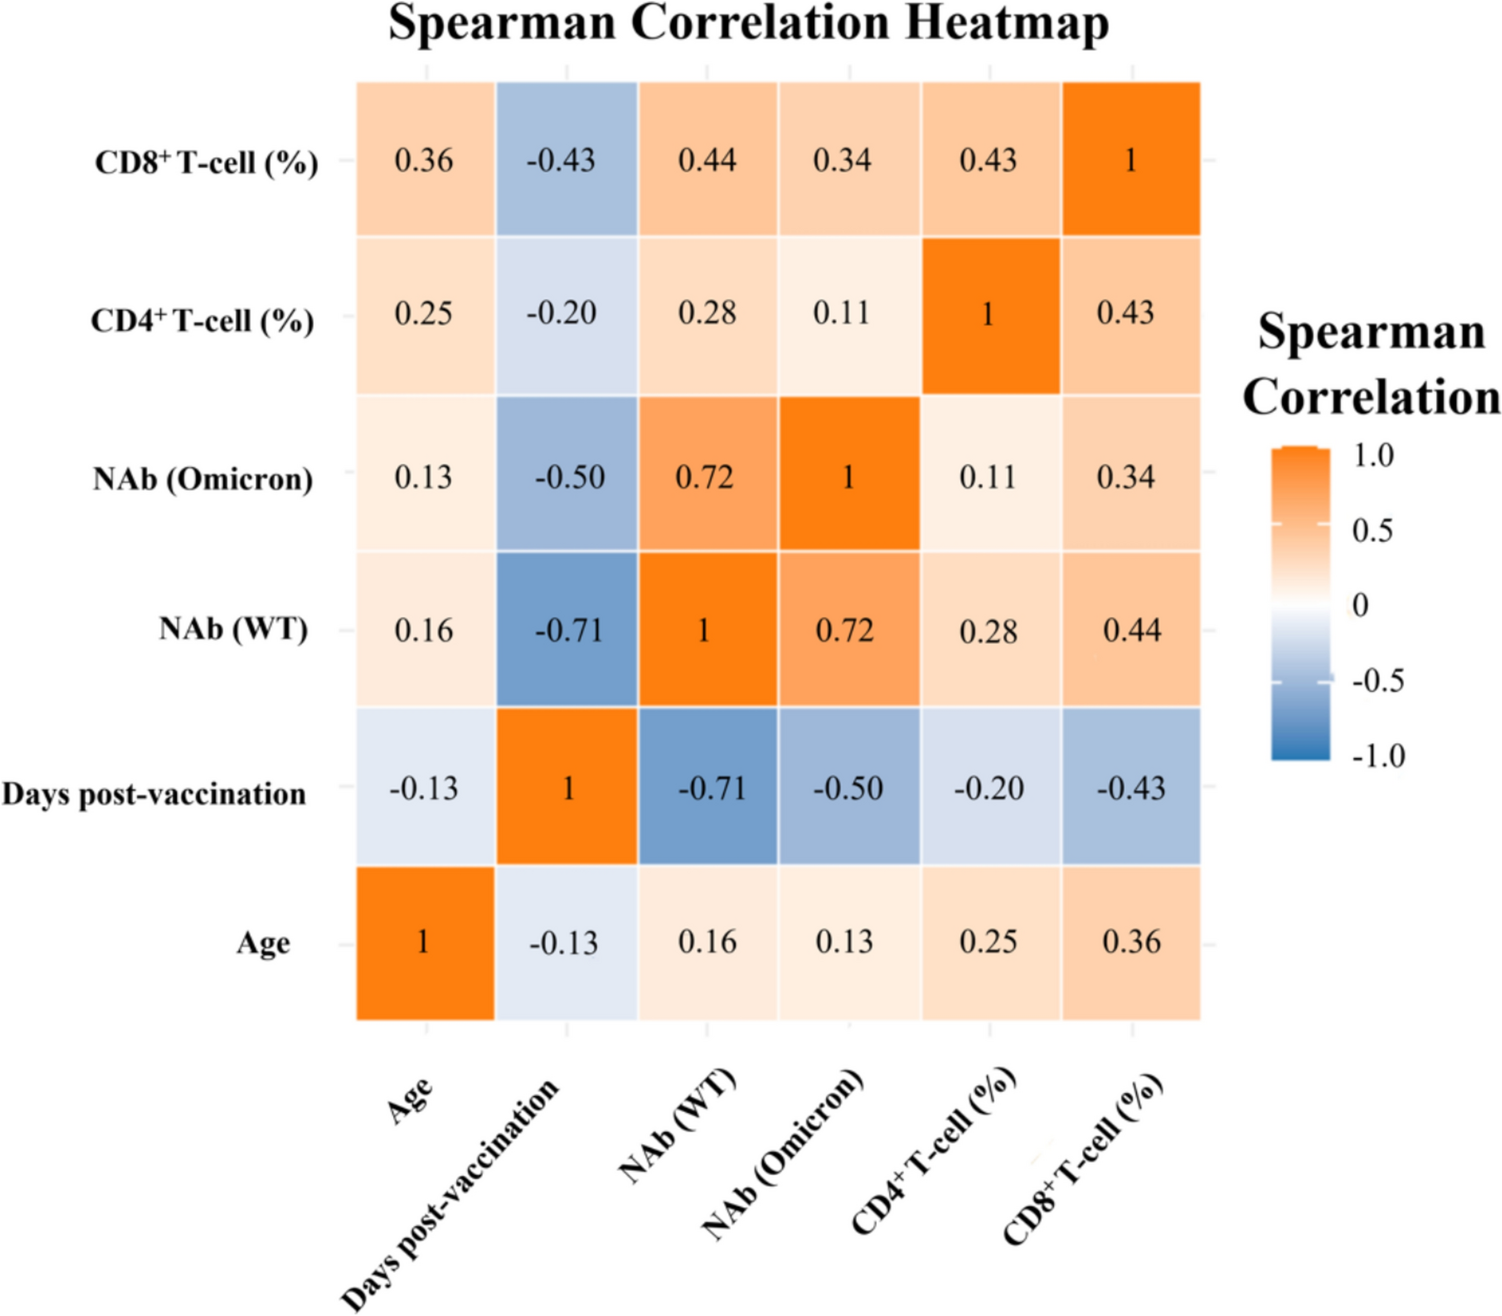
The findings revealed associations between responses of SARS-CoV-2-specific CD4+ and CD8+ T-cells and factors including age, days post-vaccination, and NAb (WT). Additionally, a correlation was identified between the levels of NAb (Omicron) and CD8+ T-cell responses. Albeit, the overall correlation was relatively weak. Notably, age demonstrated a statistically significant positive linear correlation with SARS-CoV-2-specific cellular immunity (P < 0.05), which might seem counterintuitive considering the increased disease severity and mortality with older age in COVID-19 patients [35, 36]. Besides, Dietz et al. reported that adaptive immune responses, particularly spike-specific responses, decline with age [37]. However, Dietz and colleagues assessed post-vaccination immunity across groups aged > 65, 65–74, and > 75 years. In contrast, our study focused on healthy adults within the 18 to 60 age range, with an average age of 36 years (1st Quartile:30; 3rd Quartile: 42), indicating that the impact of aging within this cohort is quite minimal. What’s more, a meta-analysis of 31 lung single-cell RNA-sequencing uncovered cell type-specific connections between age and the expression levels of receptors and proteases crucial for SARS-CoV-2 entry, including TMPRRSS2, ACE2, and CTSL [38]. This provides insight into the increased symptom severity in older COVID-19 patients. Additionally, cross-reactive T-cell immunity against SARS-CoV-2 has been observed in individuals with no prior exposure to the virus, which is thought to be due to the partial homology of T-cell epitopes between SARS-CoV-2 and common cold coronaviruses like HKU1, OC43, 229E, and NL63 [39]. Given the recurrent nature of common cold coronaviruses, elderly individuals may have more frequent encounters with these viruses, which could account for the stronger cellular immune responses post-vaccination observed in the older participants in our study.
Days post-vaccination maintained a linear negative impact on T-cell responses, even after the analysis was adjusted for age and NAb. This finding aligns with numerous studies indicating that SARS-CoV-2-specific T-cell responses decrease as time progresses [40]. Additionally, the nonlinear, ‘L’-shaped increase in specific T-cell responses with NAb levels was observed, potentially attributable to the combined effect of CD4+ and CD8+ T-cells in neutralizing antibody production [41, 42]. However, after adjusting for age and days post-vaccination, the correlation between specific T-cell responses and NAb became statistically insignificant. This suggests that the initial ‘L’-shaped pattern observed is likely influenced by the confounding effects of time since vaccination and the age of participants. Notably, while the CD4⁺ T-cell response showed an apparent stabilization after approximately day 100, this nonlinear pattern was not statistically significant (P for nonlinearity = 0.068). This observation may reflect limited sample density at longer follow-up intervals or individual heterogeneity. In summary, the responses of T-cells targeting SARS-CoV-2 were predominantly influenced by age and duration following vaccination, with the impact of NAb being significant in univariate analysis but not after multivariate adjustments.
AI-driven technologies have proven instrumental in refining clinical decision-making processes, accelerating the evolution of pharmaceuticals, enhancing diagnostic procedures for a spectrum of diseases, and strengthening health surveillance systems [43, 44]. ML has adeptly been deployed to craft early alert systems for monitoring emerging SARS-CoV-2 strains [45], pinpoint possible neutralizing agents [46], and predict epitopes for B cells and T-cells that could be targeted in vaccine development [47]. However, the application of ML in predicting the level of cellular immunity post-vaccination remains limited. Such predictive capabilities are crucial for assessing the necessity for booster vaccinations, which are pivotal for reinforcing and maintaining individual and public immunity.
In this study, we collected an array of datasets encompassing epidemiological information, routine blood indices, and immune cell parameters, totaling 32 distinct variables. Through the assessment of the % IncMSE, variables with the most substantial influence were identified. Besides age, days post-vaccination, and NAb, MONO was also identified as a key predictor for the T-cell response, possibly because of their ability to produce mediators that influence T-cell polarization [48]. The proportions of CD3+, CD4+, and CD8+ T-cells were essential for predicting the responses of CD4+ T-cells, potentially owing to their foundational role in driving T-cell reactions. However, the underlying reasons for the importance of the MCV and NEU in predicting CD8+ T-cell responses warrant further investigation. Subsequently, variables were chosen for the predictive model based on their higher R2 value and lower RMSE values. The model’s validation against both training and testing datasets confirmed its predictive efficacy, with a high degree of alignment observed between predicted and actual values. This substantiates the random forest model’s high precision in predicting T-cell responses.
In our initial analysis, the model demonstrated a high Pearson’s correlation coefficient on the training dataset derived from a 70/30 split. While this result suggests excellent predictive accuracy, it likely reflects overfitting, as the model was evaluated on data it had already seen during training. To obtain a more robust estimate of model performance and generalizability, we applied tenfold cross-validation across the entire dataset. This approach yielded a lower but more realistic correlation, indicating moderate predictive power when applied to unseen data. The difference between the two results underscores the importance of cross-validation, especially when working with small datasets, to prevent overestimation of model accuracy and ensure more reliable conclusions.
To address the limitations of generalized linear models in capturing complex, nonlinear relationships, we further employed a CART model. This model provides an interpretable, nonlinear approach to quantitatively predict T-cell responses. Utilizing the CART algorithm, we developed visualization models to evaluate the response levels of CD4+ and CD8+ T-cell responses. Notably, the day of the peak in the linear relationship graph for CD4+ T-cells with the days post-vaccination corresponds precisely with the first branching condition in the CART decision tree. This congruence between the two analytical methods underscores the dependability of our data analysis and further supports the validity of our findings.
However, this study also has several limitations. Although the 32 variables included in this study were mostly easily obtained from clinical sources, the number of variables was limited, and the participant’s sample size was modest. Moreover, the absence of data from participants with breakthrough infections, coupled with the fact that the maximum duration of vaccination considered for our volunteers was 297 days, and participants who received types other than inactivated ones were not included, may restrict the predictive model’s generalizability to those vaccinated for over 297 days, recipients of alternative vaccine types, or individuals with breakthrough infections. Furthermore, our study was conducted within a population cohort from Shenzhen, China. Given the substantial heterogeneity in HLA genotype distribution across different geographical regions, caution should be exercised when extrapolating these findings to a global context [49, 50].
While our model demonstrates strong predictive performance through internal validation, external validation remains an important goal. However, our predictive framework is based on a multi-dimensional feature set—including not only age and time post-vaccination, but also detailed immunological markers (e.g., CD3⁺, CD4⁺, and CD8⁺ T-cell percentages), neutralizing antibody levels (WT and Omicron), and routine clinical laboratory indicators (e.g., MONO, NEU, and MCV). To date, few external datasets provide this full set of predictors alongside matched T cell response outcomes. Nevertheless, future work will aim to identify partial external cohorts to validate model components and further test generalizability.
Despite these limitations, we proposed an economical and efficient model capable of evaluating the levels of SARS-CoV-2-specific T-cell responses following vaccination. This approach requires no sophisticated laboratory facilities, thereby expanding its applicability for evaluating SARS-CoV-2 immune status and assessing the need for booster vaccination across a range of healthcare settings, from large hospitals to local community clinics. While the direct applicability of our model is limited by the specificity of our cohort, it provides a foundation for future research. By incorporating more diverse populations and additional data sources, future models can address the global circulation of SARS-CoV-2 and its variants, enhancing the generalizability and applicability of immune response prediction. Moreover, these methodologies are well-suited for multicenter studies and may prove instrumental in predicting adaptive immunity after vaccination with a variety of vaccines targeting various pathogens. Additionally, the framework of our model, which currently focuses on predicting T-cell responses-a clinically challenging measurement-could be adapted to forecast antibody dynamics using similar input features. This adaption could potentially enable low-cost monitoring of humoral immunity in rescore-limited settings.


Comments (0)