2.1 Study Design and Population
An adult population pharmacokinetic (popPK) model of furosemide was developed using samples collected from adults with chronic HF who received furosemide administered intravenously or via subcutaneous infusion [12]. The adult pharmacokinetic model was then allometrically scaled to adolescents aged 12−17 years and with a body weight of ≥ 42.5 kg and would therefore likely have the minimum abdominal surface area needed to use the On-Body Infusor and body mass for the recommended 1-mg/kg dose [11, 14]. Dosing simulations were then performed to determine whether the predicted exposure to subcutaneous furosemide in adolescents is the same as the known exposure in adults.
The pharmacokinetic samples used to develop the adult popPK model were collected in a randomized crossover design study that compared the pharmacokinetics of subcutaneous administration of a novel furosemide formulation (Furoscix; 80 mg/10 mL) versus intravenous administration of furosemide injection, USP (10 mg/1 mL) in patients with chronic HF (ClinicalTrials.gov, NCT02329834) [12]. Enrolled patients were aged ≥ 18 years and had a history of ≥ 3 months of treated HF (NHYA class II/III) with presence of symptoms of chronic volume overload requiring ongoing treatment with oral furosemide ≥ 40 mg/day for ≥ 30 days before study entry. Patients were randomized to receive furosemide administered intravenously (furosemide injection, USP [NDA #018667; Hospira Inc.]; 40 mg over 2 min), followed by a second 40-mg dose 2 h later) or 80 mg (8 mg/mL in 10 mL) of a novel furosemide buffered solution administered subcutaneously using a biphasic profile (30 mg over the first 60 min, then 12.5 mg/h for 4 h). After a 7-day treatment-free washout, patients received the alternate treatment.
2.2 Ethics
The study was conducted according to the principles of the Declaration of Helsinki. The study protocol was approved by the ethical review committee and institutional review board at the participating site. Patients provided written, informed consent before study participation.
2.3 Adult Pharmacokinetic Assessment
As described previously [12], venous blood for the assessment of pharmacokinetic parameters in the comparative pharmacokinetic study at various times for intravenous treatment (pre-dose and 0.083, 0.25, 0.5, 0.75, 1, 1.5, 2, 2.08, 2.25, 2.5, 2.75, 3, 3.5, 4, 5, 6, 8, 10, 12, 14, and 16 h post-dose) and subcutaneous treatment (pre-dose and 0.5, 1, 1.5, 2, 3, 4, 5, 5.08, 5.25, 5.5, 5.75, 6, 8, 10, 12, 14, 16, and 24 h post-dose). Plasma furosemide concentrations were measured using a validated liquid chromatography−tandem mass spectrometry method (Algorithme Pharma, Laval, Quebec, Canada). Pharmacokinetic parameters were assessed using Phoenix WinNonlin 6.3 (Pharsight, St. Louis, MO, USA). Of the 16 adults who received furosemide in the comparative pharmacokinetic study, one was found to have high pre-dose concentrations of furosemide and was not included in the pharmacokinetic analysis or the popPK model development described here.
2.4 Adult popPK Model Development
One-, two-, and three-compartment pharmacokinetic models were explored with assumed linear pharmacokinetics based on prior observations of furosemide pharmacokinetics in adults [15]. Different absorption models, including a first-order absorption model, a time lag model, and transit compartment models were assessed. Between-participant variability was assessed for model parameters using an exponential relationship (Eq. 1):
$$_=_*\text\left(_\right),$$
(1)
where PARij denotes the estimate of parameter j in the ith individual, θPop,j is the population value for parameter j, and ηij denotes the deviation from the average population value for parameter j in the ith individual with mean zero and variance ω2.
The correlation between random effect parameters was calculated using Eq. (2):
$$\rho \left(CL-V\right)=\frac_}_}^*_}^}},$$
(2)
where ωCL,V denotes the off-diagonal element between clearance (CL) and volume of distribution (V) parameters, and ωCL2 and ωV2 are the variance estimates for the inter-individual variability (IIV) in relative CL (CL/F) and relative volume of distribution (V/F), respectively.
Proportional (Eq. 3), additive (Eq. 4), and a combined (additive plus proportional) residual error models were explored. The combined error model (proportional and additive) is shown in Eq. (5):
$$_=_*\left(1+_\right)+_,$$
(5)
where Cobs,ij is the jth observed concentration in the ith individual, Cpred,ij is the jth predicted concentration in the ith individual, and εprop,ij and εadd,ij are random variables with mean zero and variance σprop,ij2 and σadd,ij2, respectively.
Age, sex, weight, body mass index, NYHA HF stage (II or III), serum creatinine, and estimated glomerular filtration rate (eGFR; Cockcroft Gault [16]) were tested as covariates by visual inspection of scatter and box plots (continuous and categorical variables, respectively) of the individual deviations from the population-typical value pharmacokinetic parameters against covariates.
Continuous covariates were normalized to population median values, with the exception of weight, which was normalized to a typical 70-kg adult weight. The relationship between pharmacokinetic parameters and age, serum creatinine, eGFR, body mass index, and weight was evaluated using linear and power functions, as shown in Eqs. (6) and (7):
$$_=_}_}\right)}^_}$$
(6)
$$_=\left(_+_*\frac_}_}\right),$$
(7)
where Fcov denotes the fraction of the adult parameter value, \(_\) denotes the individual covariate value, \(_\) is the population median covariate value, and \(_}\) is the parameter(s) representing the covariate effect.
For weight, Eq. (6) was applied using both estimated \(_\) and fixed \(_\) at values of 0.75 for CL and intercompartmental clearance (Q) parameters and values of 1 for volume of central compartment (Vc) and volume of peripheral compartment (Vp). For eGFR effects on CL and Q, a saturable covariate relationship with a maximal effect of eGFR on CL and Q was also evaluated. In this approach, the eGFR value was capped at 120 mL/min.
For dichotomous categorical covariates, including sex and NYHA HF stage (II or III), a relationship as shown in Eq. (8) was used:
$$_=_*\text\left(Categorical*_\right),$$
(8)
where PARij denotes the estimate of parameter j in the ith individual, θPop,j is the population value for parameter j, \(_\) is a parameter that represents the covariate effect, and Categorical is a dichotomous categorical variable that can take on the value of zero or one for each covariate.
2.5 Adult popPK Model Evaluation and Validation
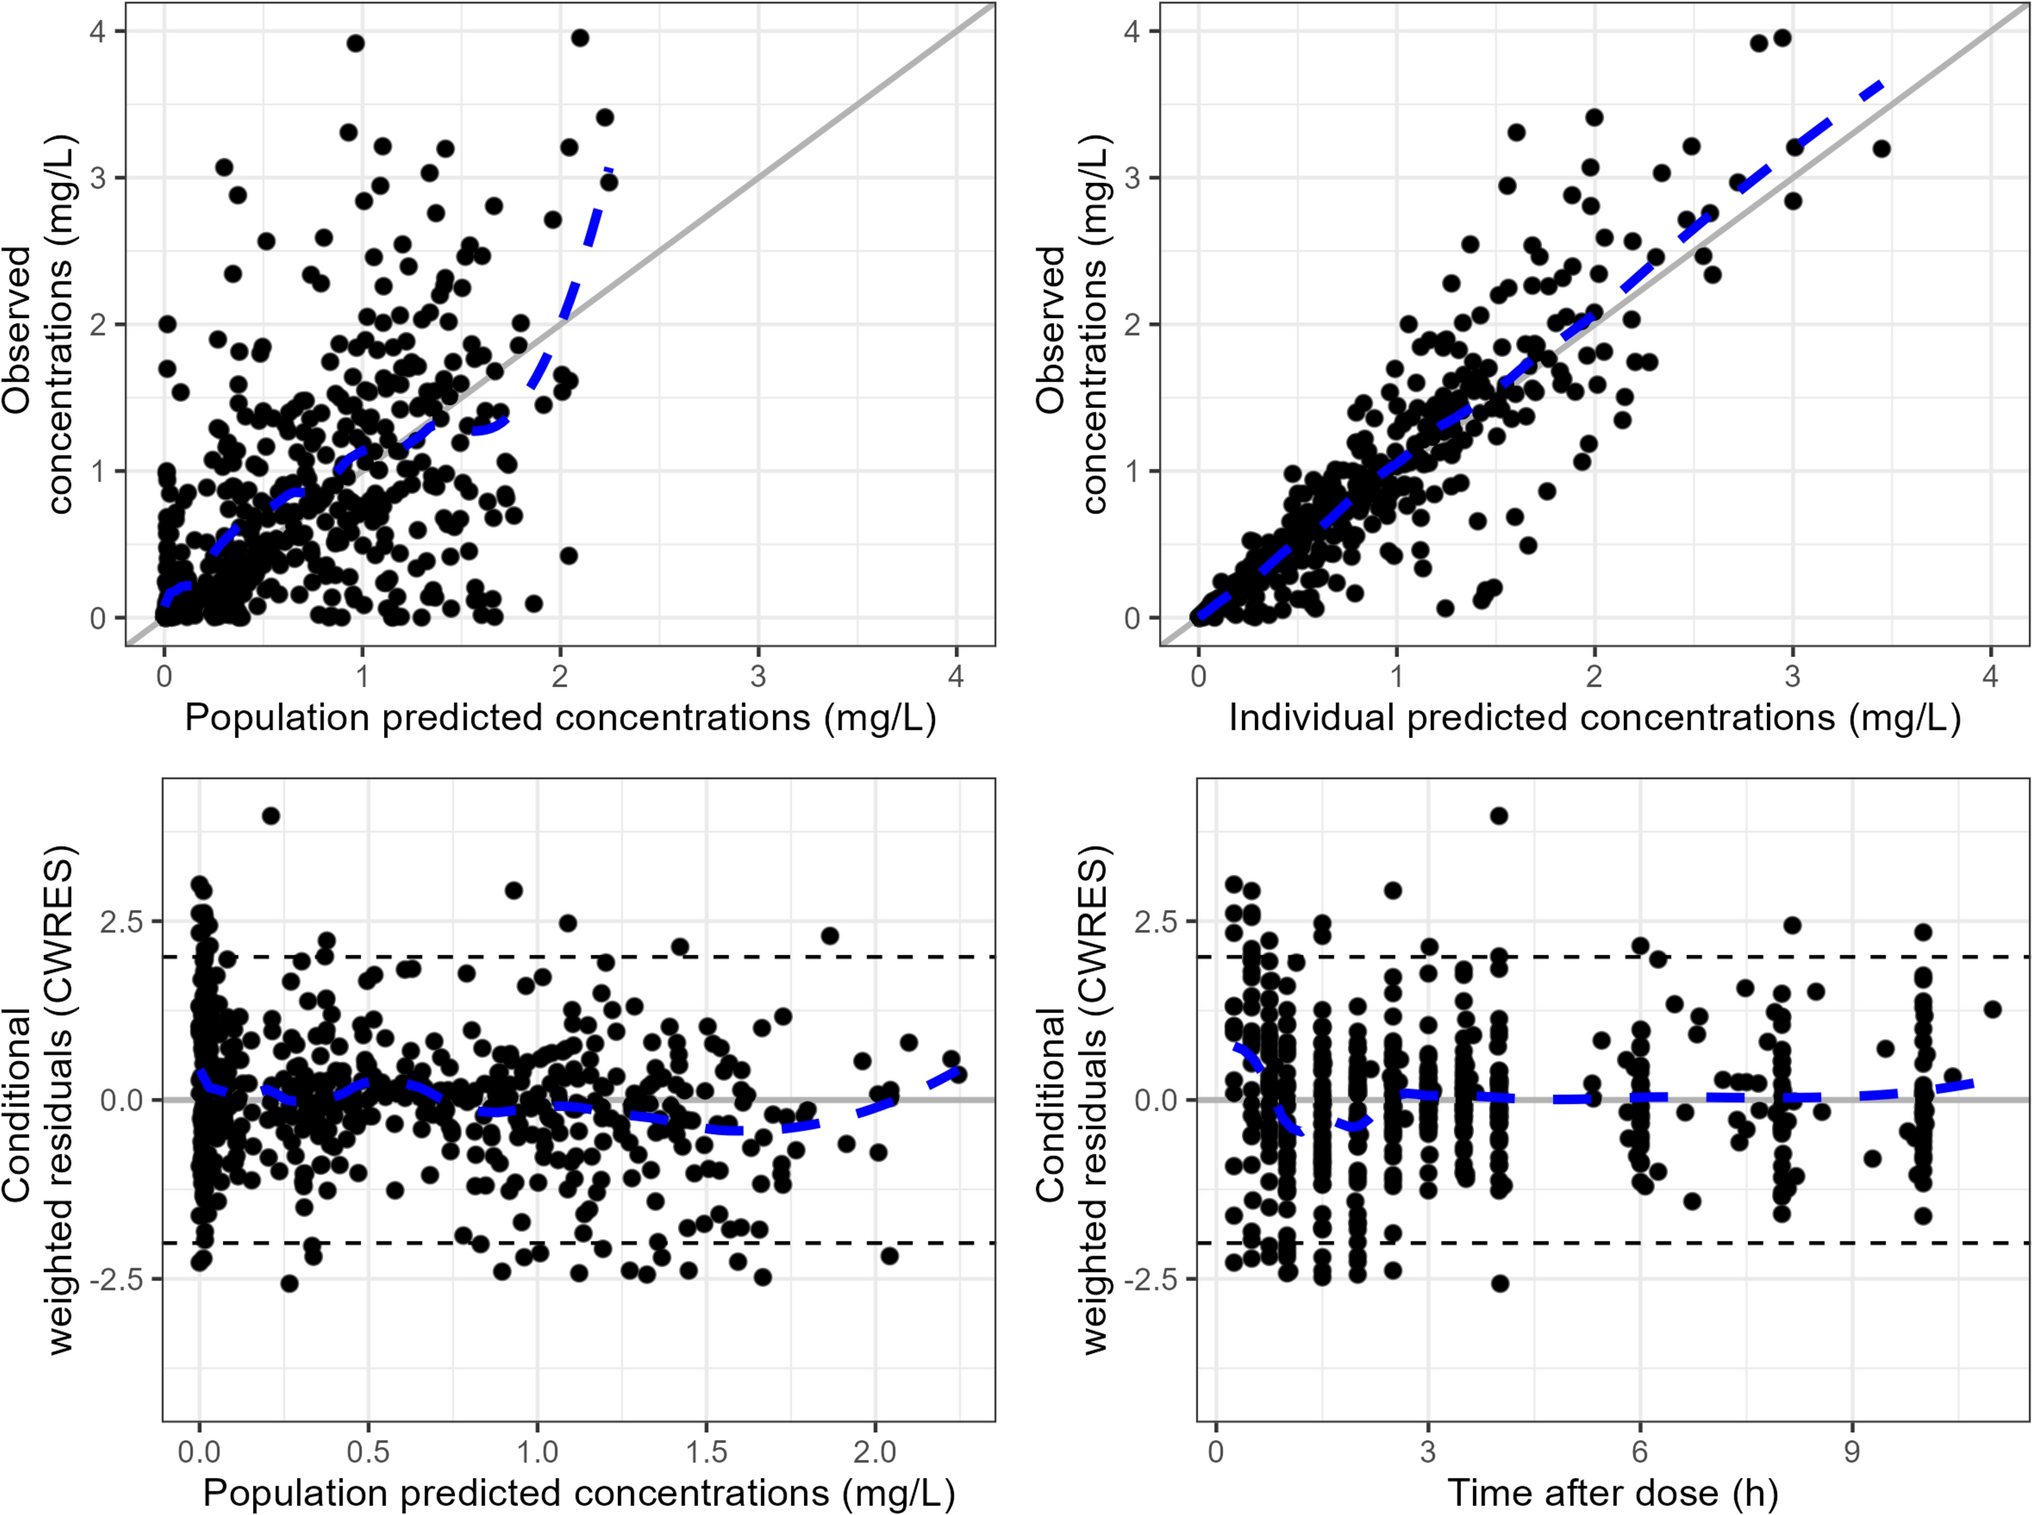
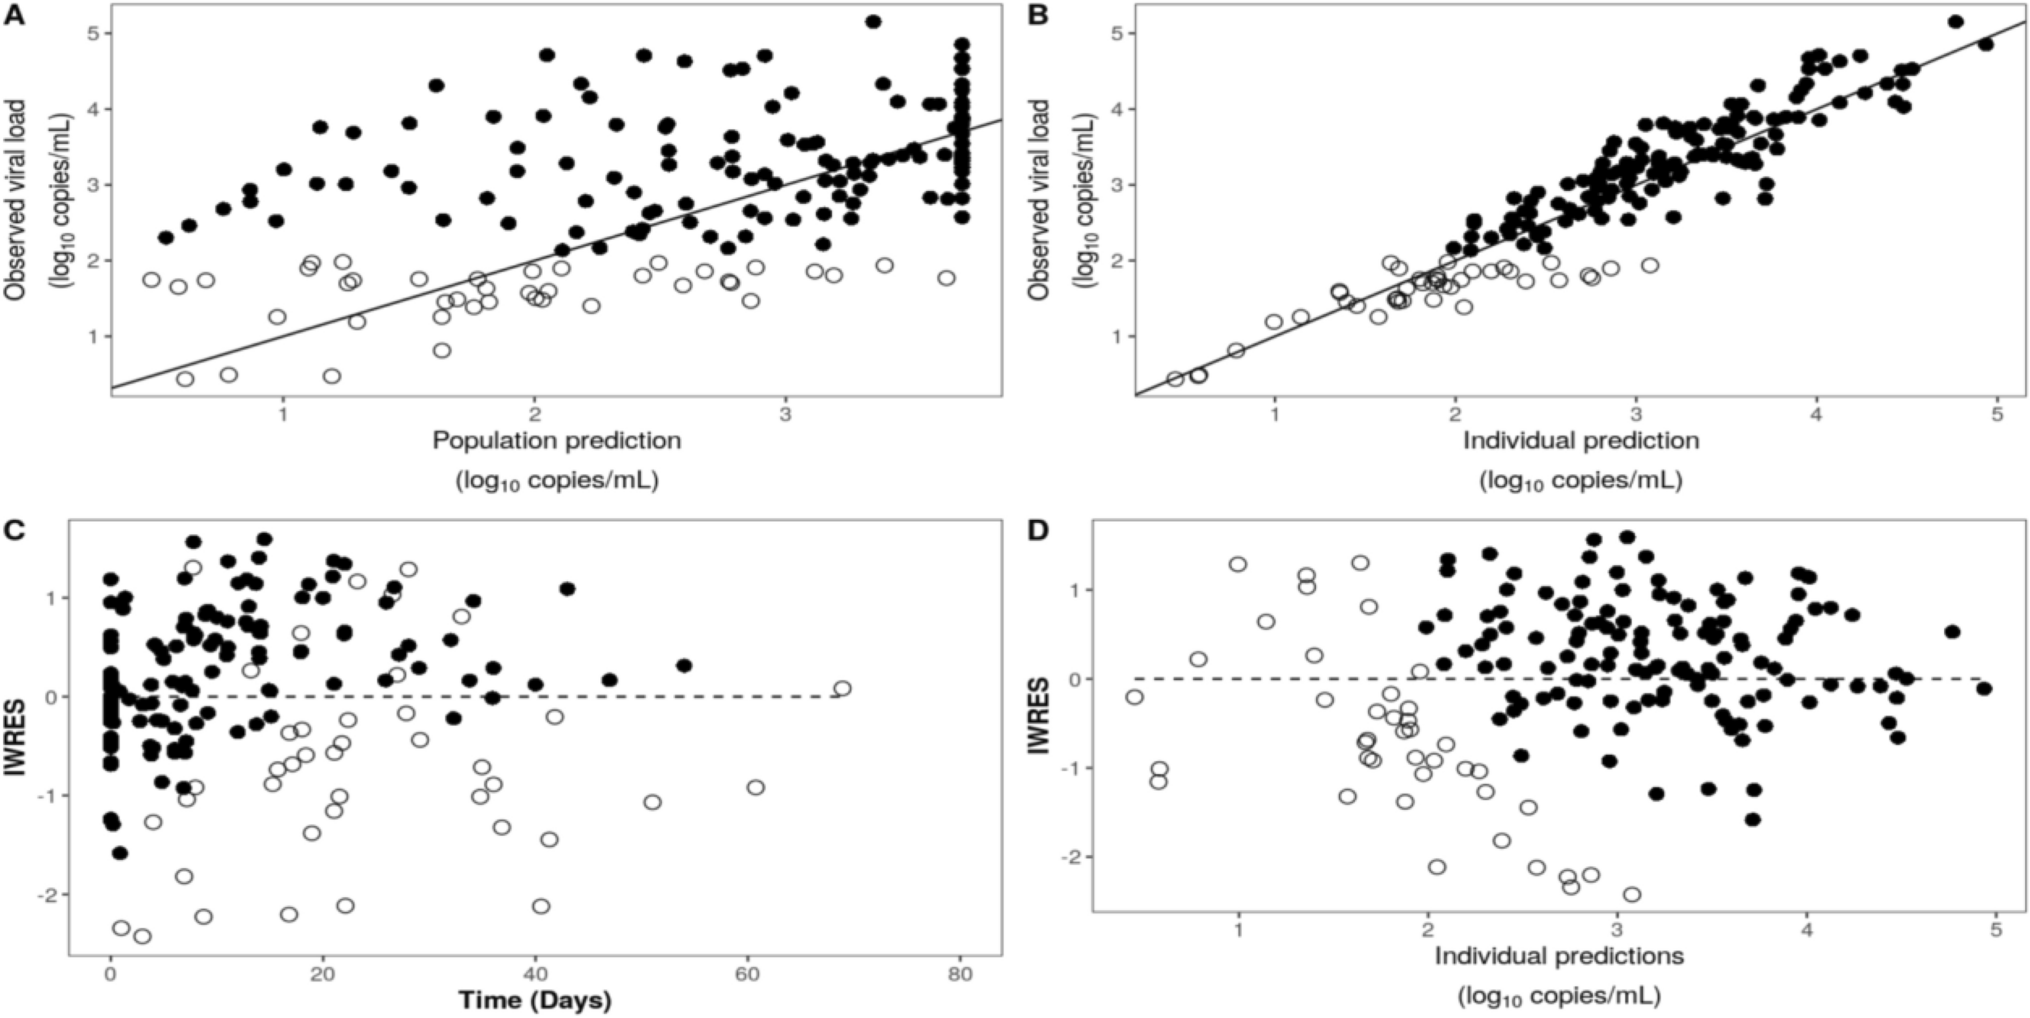
During development of the popPK model, successful minimization, diagnostic plots, plausibility and precision of parameter estimates, and objective function and shrinkage values were used to assess model appropriateness. Diagnostic plots generated included individual predictions and population predictions versus observations, conditional weighted residuals versus population predictions and time, and individual weighted residuals versus individual predictions.
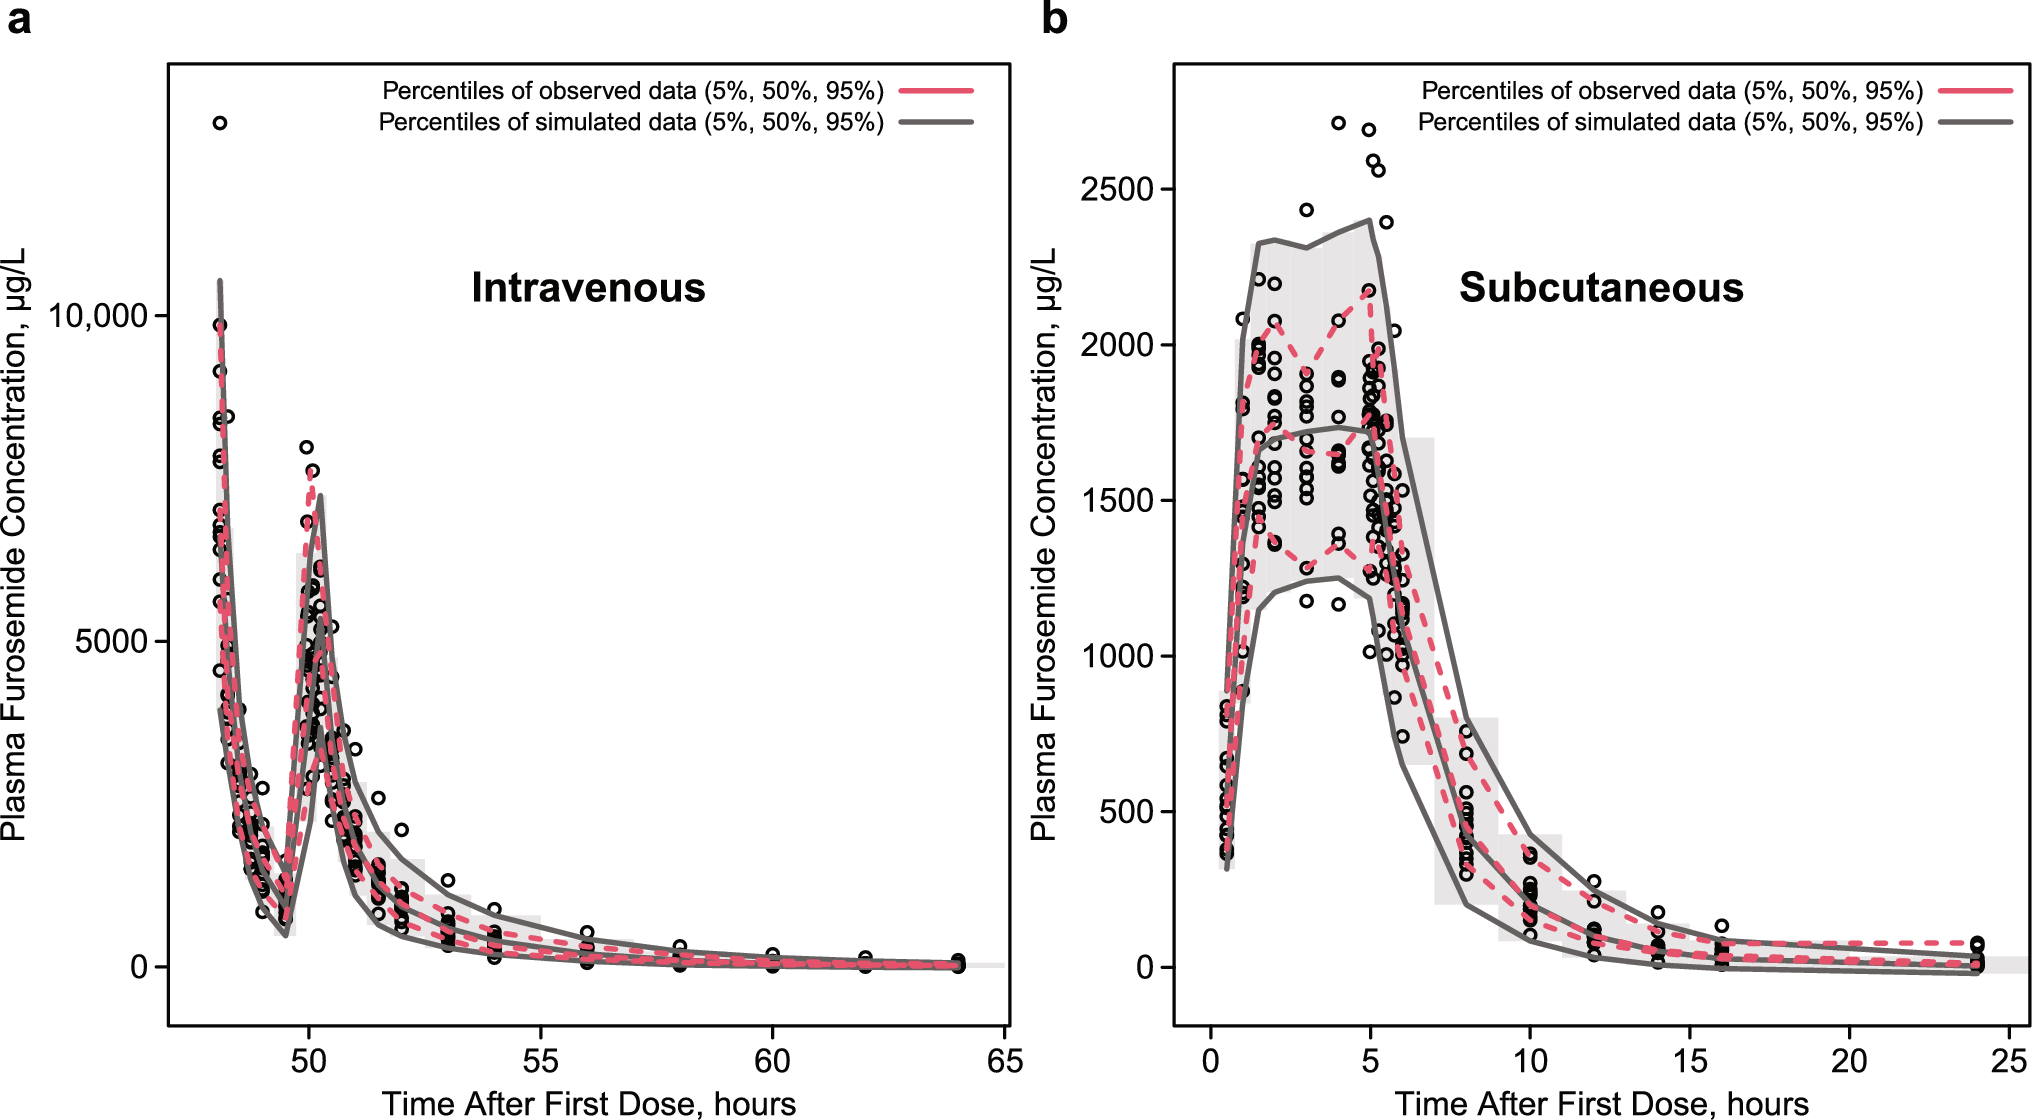
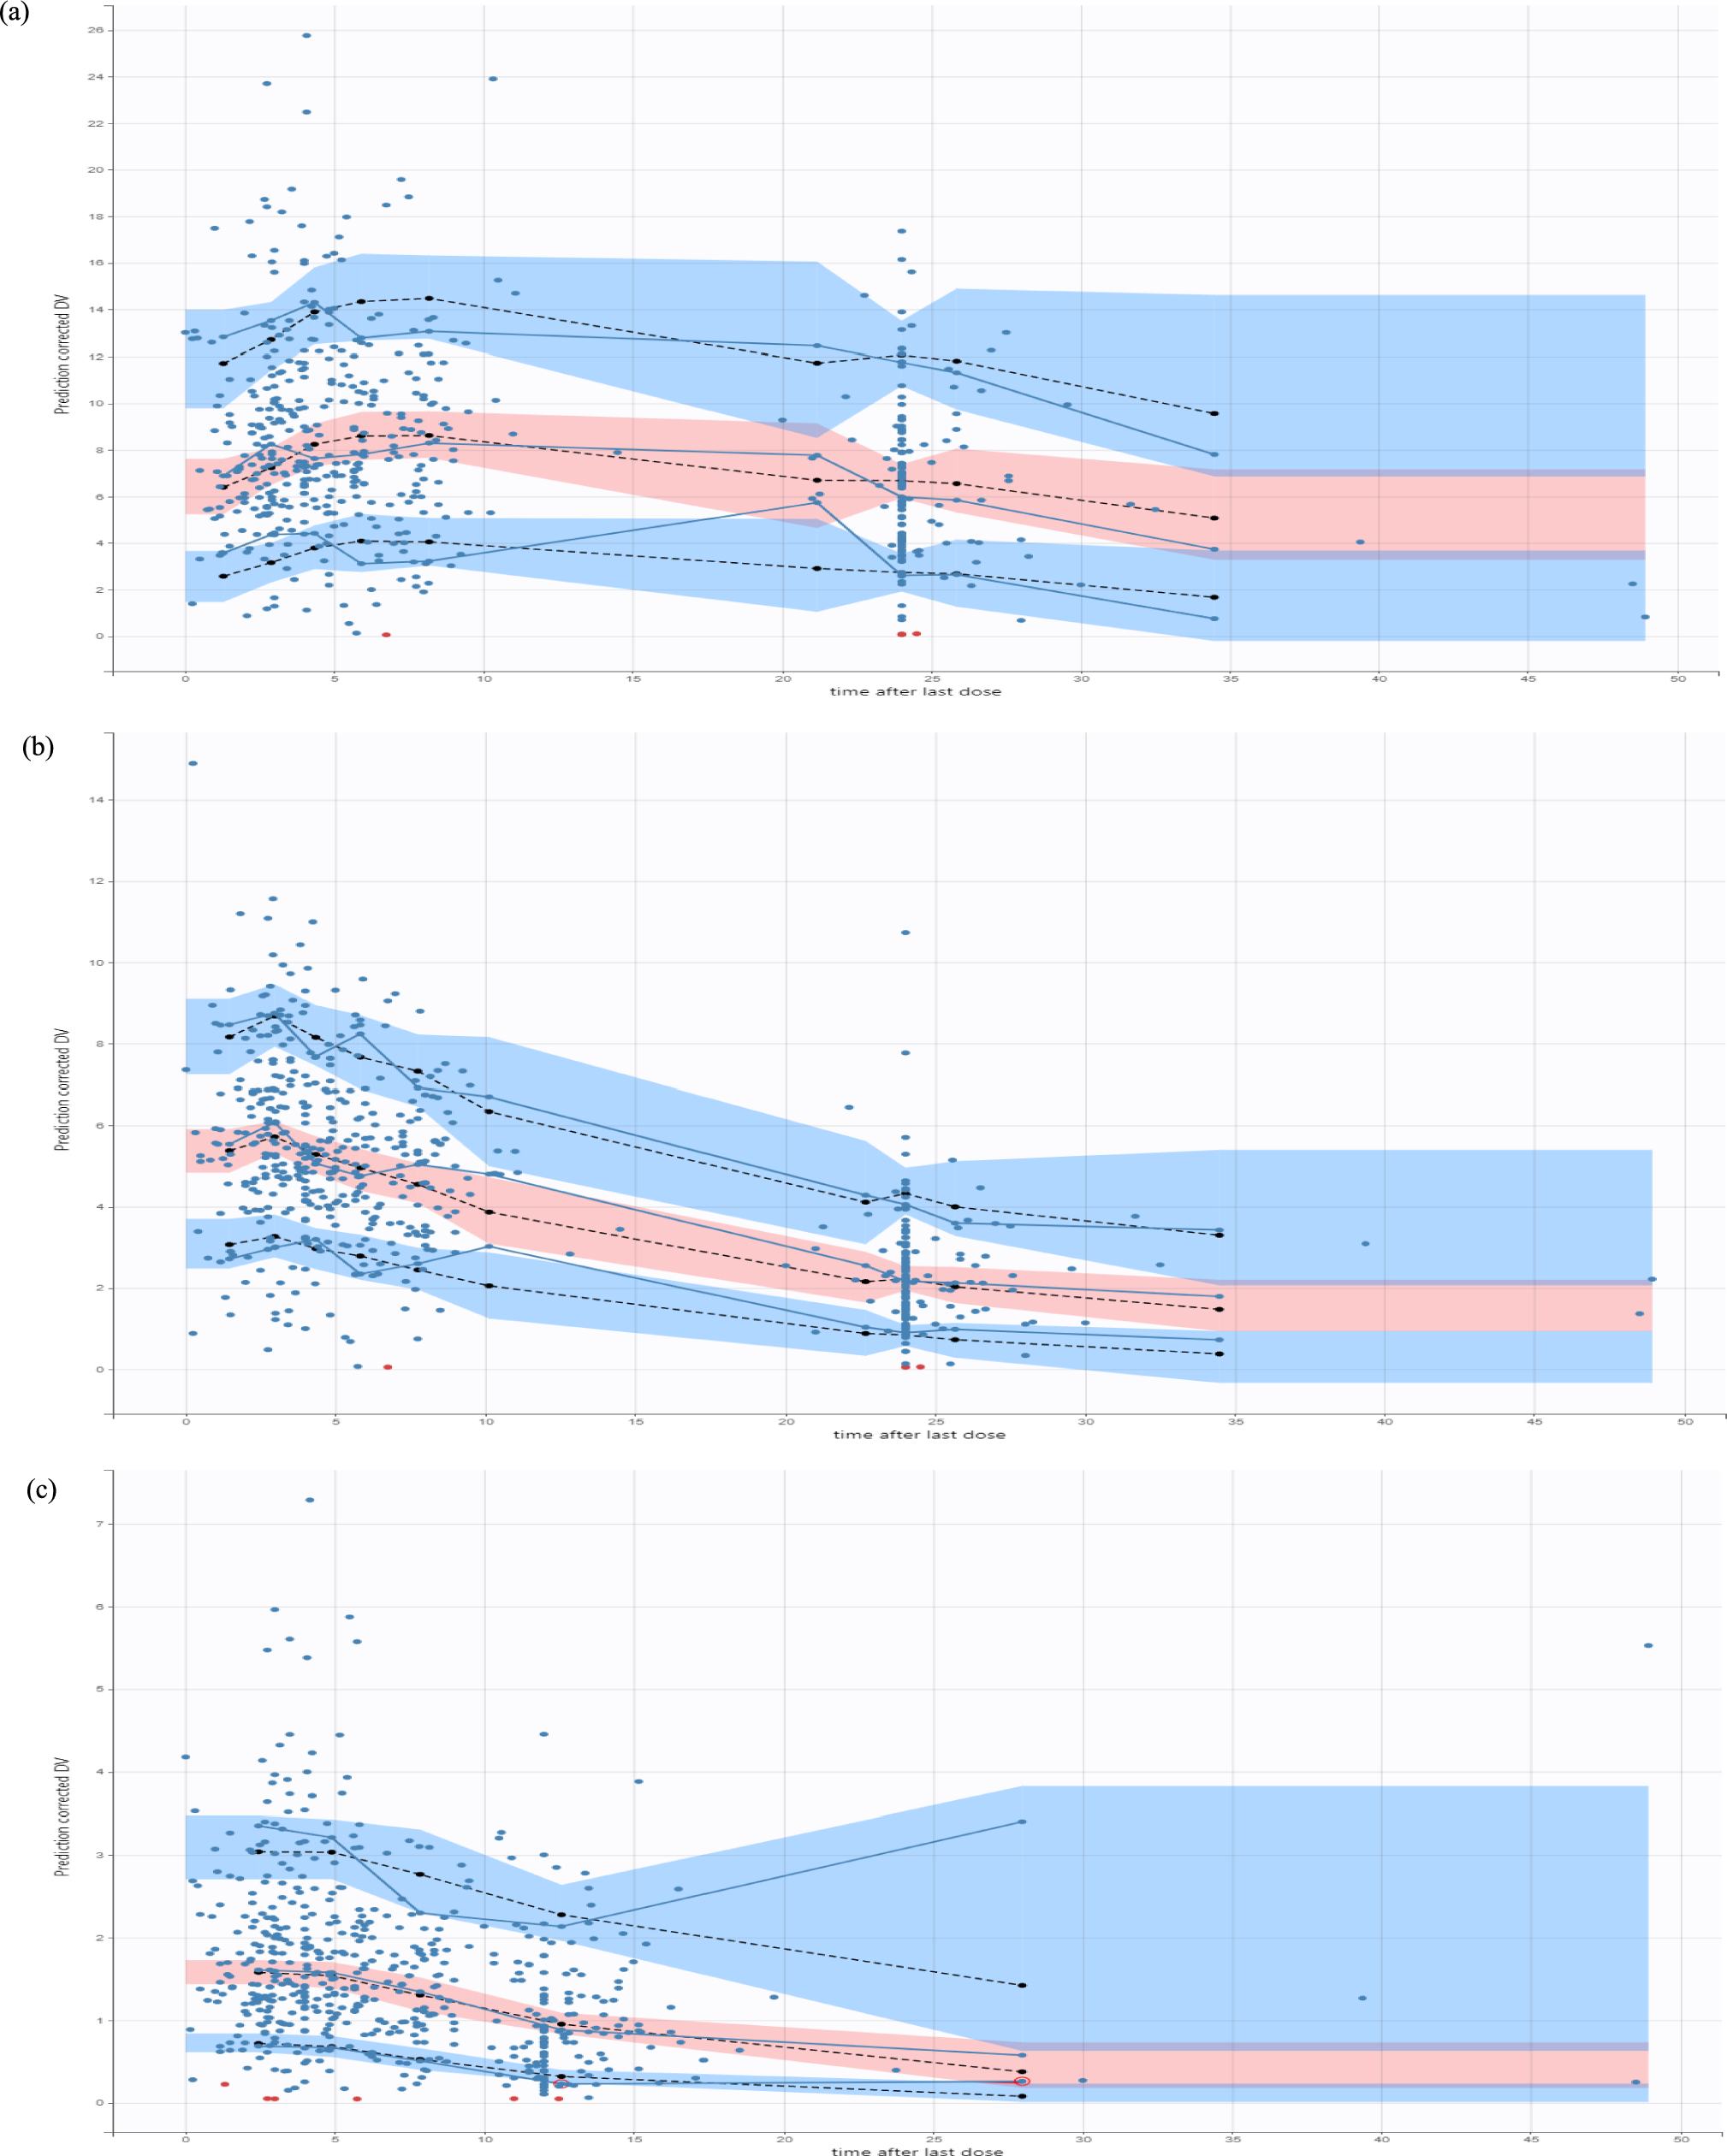
Parameter precision for the final popPK model was evaluated using non-parametric bootstrapping (1000 replicates) to generate the 95% confidence intervals for parameter estimates. Prediction correct visual predictive checks (pcVPC) were performed whereby the base and final models were used to generate 1000 Monte Carlo simulation replicates per time point of furosemide exposure. Simulated results were compared at the participant level with those observed in the study by calculating and plotting the percentile of each observed concentration in relation to its 1000 simulated observations derived from the final model. The dosing and covariate values used to generate the simulations in the SVPC were the same as those used in the study population. To improve interpretability, pcVPCs were stratified by route of administration (intravenous vs subcutaneous). In addition to pcVPC plots, a numerical assessment of predictive performance was conducted using normalized prediction errors (NPDEs) for the 1000 simulated versus observed datasets using the CRAN R NPDE package 5 (SW test, P < 0.001; Fisher’s variance test, P < 0.01). Distribution of NPDEs was also assessed visually by examining plots of NPDEs versus predicted concentrations and time after last dose and using distributional histograms.
2.6 Scaling the Adult popPK Model to Adolescents
Using the final adult popPK model, and before generating pediatric simulations, parameters were scaled using body weight and the following mathematical functions to demonstrate an allometric relationship between body weight and CL and a linear scale for volume parameters (Eqs. 9−13). Scaling was based on a 70-kg standardized adult body weight. Because the pediatric population of interest consists of adolescents aged 12−17 years, an age-based maturation function was not included in the model:
$$CL=_*_}\right)}^$$
(10)
$$Vc=_*_}\right)}^$$
(11)
$$Vp=_*_}\right)}^,$$
(13)
where Kastd represents the population parameter estimate of subcutaneous absorption in an adult, CLstd represents the population parameter estimate for drug CL in a 70-kg adult with an eGFR of 86 mL/min (the median value observed in the adult study population), WTi is the individual weight, and Vstd is the population parameter estimate for volume of distribution in a 70-kg adult. These same relationships were applied for all CL and Q and Vc and Vp parameters.
2.7 Simulation of Pediatric Furosemide Plasma Concentrations by Allometrically Scaling the Adult popPK Model
The scaled popPK model (Eqs. 8−13) was used to simulate furosemide plasma concentrations in virtual adolescents. Because the final equations only incorporated weight, and a minimum weight is included in the proposed pediatric indication, the virtual population used for simulations was based solely on weight. Thus, 1000 virtual adolescents were created in three weight groups: 42.5−50 kg, > 50−60 kg, and > 60−70 kg. The 1000 virtual adolescent weights were uniformly distributed within each group.
All simulations were performed following the fixed 80-mg furosemide subcutaneous dosing regimen: 30 mg administered over 1 h, immediately followed by a 4-h infusion of 12.5 mg/h. Concentrations were simulated at 0.1-h intervals over a 24-h period from the start of furosemide administration. To represent the anticipated exposures in typical adolescents within a given weight group, IIV was not included in the simulations.
2.8 Statistical Analysis
For the adult popPK analysis, there were no missing clinical data for covariates, and none of the samples were below the quantification limit. Descriptive statistics for demographic and dosing variables were calculated using the value at the time of first sample. Data were summarized descriptively using mean, standard deviation, coefficient of variation (CV), median, and range, as applicable. With the exception of the pharmacokinetic modeling, all statistical analyses were performed using Stata SE, version 15.0 (StataCorp, College Station, TX, USA) or R, version 4.0.5 (R Foundation for Statistical Computing, Vienna, Austria) with RStudio, version 1.4.1103 (RStudio, Boston, MA, USA).
The adult popPK model was developed using NONMEM, version 7.5 (Icon Solutions, Ellicott City, MD, USA). Run management was performed using Pirana, version 2.9.9 (Certara, Radnor, PA, USA). Bootstrap methods were performed with Perl-speaks-NONMEM (version 3.7.6). Data manipulation and visualization were performed using the packages R, version 4.0.5, with RStudio, version 1.4.1103. There were no missing values in the popPK analysis, and no imputation was performed.
During the simulation of pediatric plasma furosemide concentrations, simulations, graphing, and non-compartmental pharmacokinetic parameter calculations on the simulated concentration versus time profiles were conducted using the CRAN R packages mrgsolve, PKNCA, and ggplot2 [17]. Area under the plasma concentration–time curve at 24 h (AUC0–24) was calculated using the linear-up/log-down method. Maximum plasma concentration (Cmax) was derived from each simulated concentration versus time profile, and values were summarized within each pediatric weight group.

Comments (0)