
Remember me
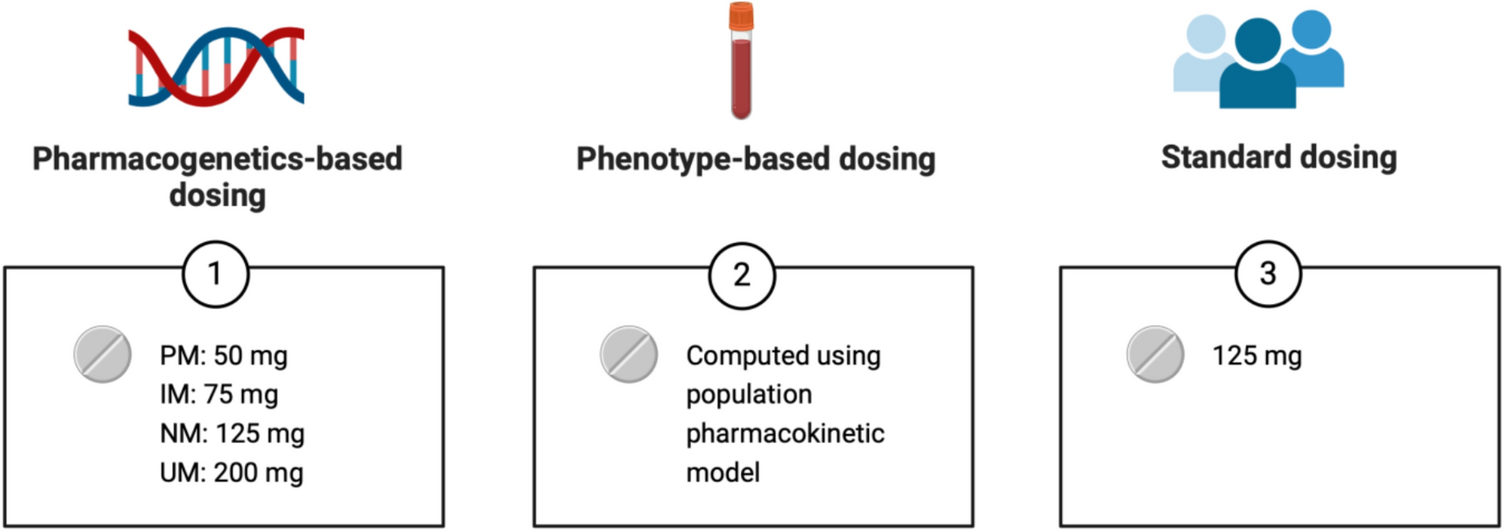
This study was a secondary analysis of the Pharmacogenetics for Individualized Tricyclic Antidepressant Dosing (PITA) study [12], a RCT comparing pharmacogenetics-based dosing and standard dosing of the TCAs nortriptyline, clomipramine, and imipramine for the treatment of MDD. In the current analysis, we focused specifically on nortriptyline and compared three dosing strategies: pharmacogenetics-based, phenotype-based, and standard dosing (Fig. 1). For this analysis, we used nortriptyline plasma concentrations measured within 24 h after a single initial dose and after 1 week of treatment, when a stable “steady state” plasma concentration (Css) is expected. Nortriptyline is characterized by linear pharmacokinetics [16, 19,20,21], meaning that the Css increases proportionally with the dose. Using empirical data from the original study, including observed Css and corresponding doses (mg/day), we modeled three alternative Css values for each participant on the basis of target doses determined by the following dosing strategies:
(a)Pharmacogenetics-based dosing: an individualized target dose (mg/day) depending on the CYP2D6 genotype, following the Dutch Pharmacogenomic Working Group (DPWG) guidelines [22]: 50 mg/day for PM, 75 mg/day for IM, 125 mg/day for normal metabolizers (NM), and 200 mg/day for UM;
(b)Phenotype-based dosing: an individualized target dose (mg/day) derived from the plasma concentration measured 8–24 h after the initial nortriptyline administration. The target dose was computed using a population pharmacokinetic model developed for this analysis (described below);
(c)Standard dosing: a fixed target dose of 125 mg/day, representing the midpoint of the recommended range (100–150 mg/day) [2].
Fig. 1
Comparison of nortriptyline target doses (mg/day) in accordance with pharmacogenetics-based, phenotype-based, and standard dosing. Poor metabolizer (PM), intermediate metabolizer (IM), normal metabolizer, and ultra-rapid metabolizer (UM) for CYP2D6
2.2 ParticipantsParticipants were 18–65 years of age and were free of psychotropic medications, apart from study medication. Benzodiazepines were permitted at doses equivalent to a maximum of 4 mg of lorazepam per day. Concomitant medications known to cause drug–drug interactions with nortriptyline were not allowed.
For this analysis, we included only participants with nortriptyline plasma concentrations measured both within 24 h after the initial single administration and at steady state. Participants treated with clomipramine or imipramine in the original RCT were excluded, as no plasma concentrations were collected following a single dose of these medications for two main reasons. First, the number of participants treated with clomipramine or imipramine was expected to be too small for development of population pharmacokinetic models. Second, therapeutic plasma concentrations for clomipramine and imipramine are typically defined as the sum of the parent TCA and its primary active metabolite, i.e., desmethylclomipramine and desipramine, respectively [22]. After a single dose, the plasma concentrations of these metabolites were expected to be low, potentially below the limit of quantitation, thereby limiting the feasibility of generating dose recommendations on the basis of early plasma sampling.
2.3 Pharmacogenetic Testing and Nortriptyline Plasma ConcentrationsThe CYP2D6 genotype was determined using DNA extracted from blood or saliva samples. In pharmacogenetic testing, the following CYP2D6 variants were assessed: *2 to *11, *15, *17, *29, *35, *41, as well as gene duplications. The *1 allele represented alleles other than the tested variants. Metabolizer phenotypes based on the genotype were classified according to the guidelines provided by the DPWG [23].
Plasma concentrations after the first single dose were measured 8–24 h after the first nortriptyline administration. Plasma concentrations at steady state were measured 10–16 h post dose using a validated bioanalytical assay [24, 25]. In the original RCT, the therapeutic window for nortriptyline was defined as 50–150 μg/L [12]. In accordance, in the present study we considered a plasma concentration within this range as therapeutic, concentrations below 50 μg/L as subtherapeutic, and concentrations above 150 μg/L as supratherapeutic.
2.4 Development of a Population Pharmacokinetic Model for Phenotype-Based DosingA population pharmacokinetic model was developed using the NONMEM software package (version 7.5) [26]. Data from 85 participants with at least one concentration measured during the original RCT were included in model development. Details of the development of our population pharmacokinetic model are provided in Electronic Supplementary Materials (ESM) 1.
The model was employed to obtain empirical Bayes estimates for individual pharmacokinetic parameters through maximum a posteriori estimation, using the established model along with the individual nortriptyline plasma concentration measured 8–24 h after the first administration. Using the empirical Bayes estimate for the Css and the corresponding dose (mg/day) administered in the RCT, a dosing recommendation (mg/day) was devised for each participant, assuming linear pharmacokinetics. The phenotype-based dosing recommendations targeted a steady state plasma concentration of 100 μg/L, which represents the midpoint of the therapeutic window (50–150 μg/L).
2.5 Statistical AnalysisTo evaluate the three dosing strategies, target doses and predicted Css were compared using one-way analysis of variance (ANOVA). Chi-squared (χ2) tests were conducted to assess differences in the number of participants achieving therapeutic versus nontherapeutic (i.e., subtherapeutic or supratherapeutic) concentrations, as well as subtherapeutic versus non-subtherapeutic and supratherapeutic versus non-supratherapeutic plasma concentrations.
Post hoc analyses compared the standard deviation of predicted plasma concentrations, using F-tests for equality of variances, and the number of participants achieving therapeutic, subtherapeutic, and supratherapeutic concentrations, using χ2 tests, in a pair-wise manner: pharmacogenetics-based versus standard dosing, phenotype-based versus standard dosing, and pharmacogenetics-based versus phenotype-based dosing.
Although the definition of the therapeutic window of nortriptyline (50–150 μg/L) used in the current study and the original RCT is consistent with the summary of nortriptyline product characteristics [2], international consensus guidelines recommend a slightly different therapeutic window of 70–170 μg/L [22]. Therefore, as a planned post hoc analysis, we re-evaluated the plasma concentrations predicted by pharmacogenetics-based, phenotype-based, and standard dosing using this alternative therapeutic window.
Statistical significance was defined as p ≤ 0.05 (two-sided). All statistical analyses were performed using SPSS version 30 [27].
Comments (0)