
Remember me
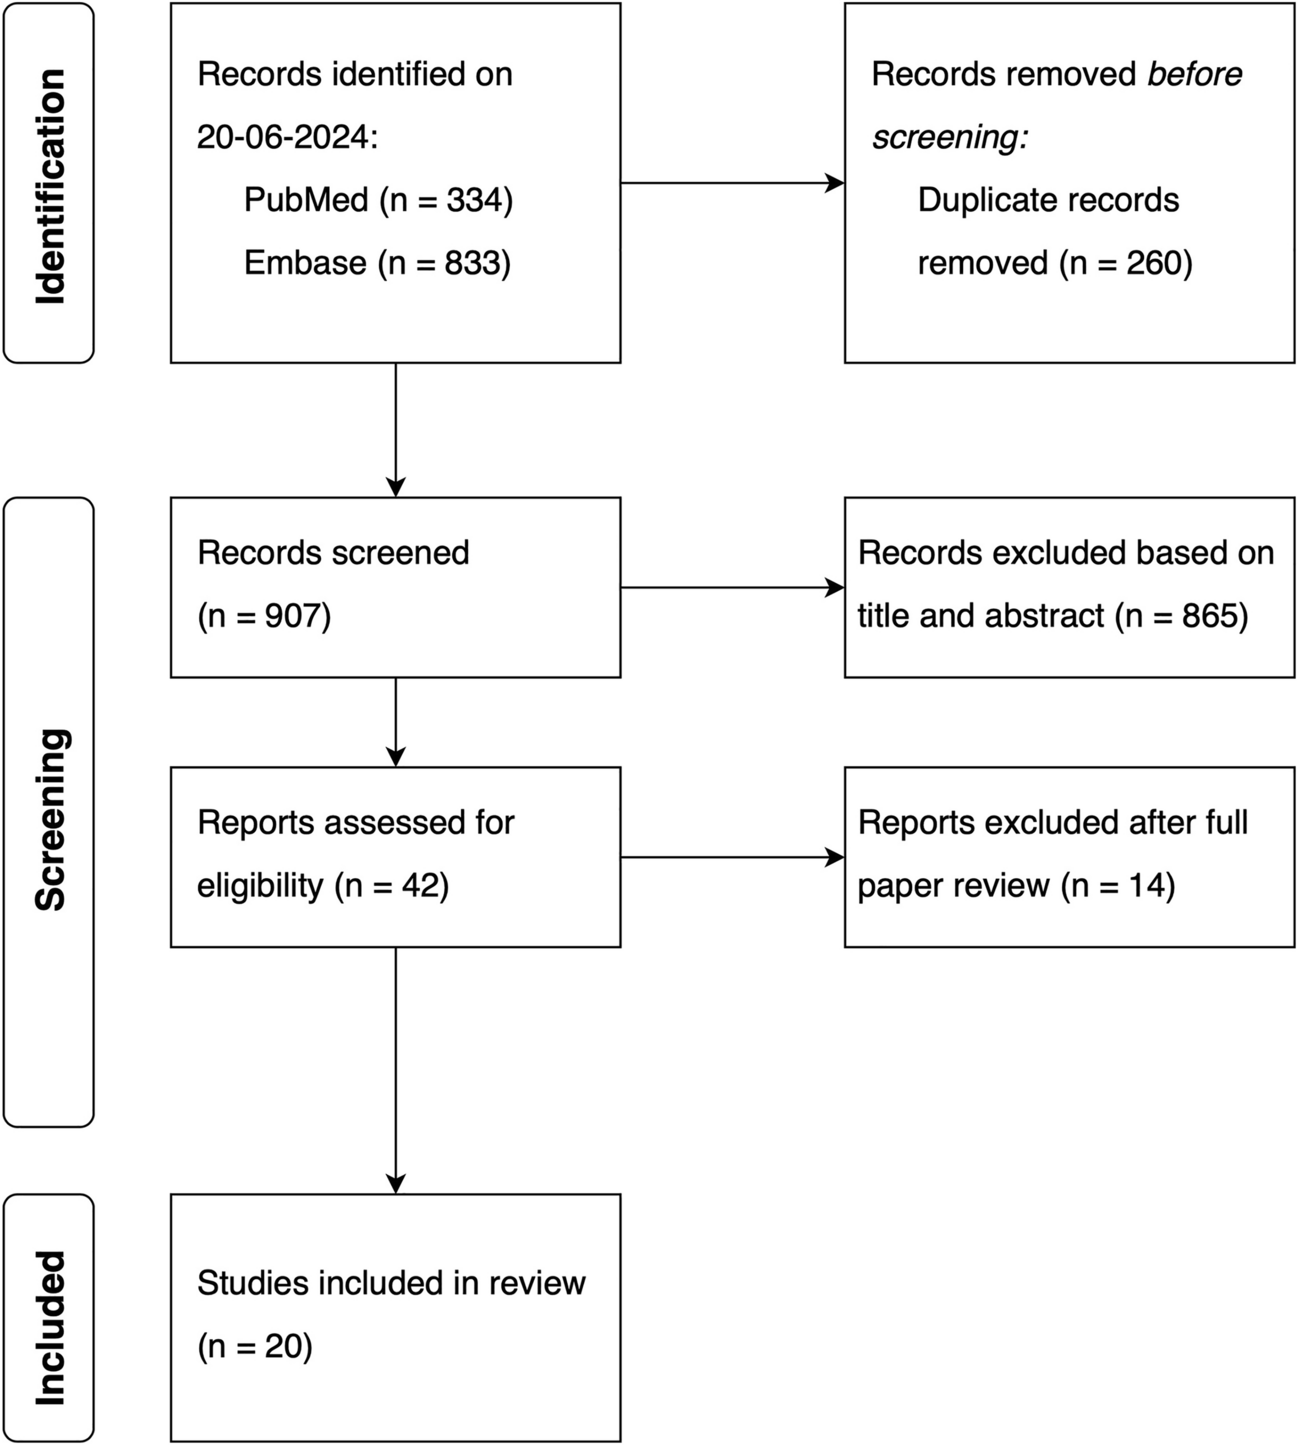
The PopPK analyses included a total of 9440 samples for ADC and 9383 for cys-mcMMAF from 977 patients (DREAMM-2: n = 218; DREAMM-3: n = 217; DREAMM-6: n = 152; DREAMM-7: n = 242; DREAMM-12: n = 23; DREAMM-14: n = 125). After exclusion of 560 ADC samples and 3029 cys-mcMMAF samples (because of nonreportable concentrations, duplicate samples, missing clinical information, absolute value of conditional weighted residuals > 6, or measurable concentration at time zero), 8880 measurable ADC concentrations and 6354 measurable cys-mcMMAF concentrations were included in the PopPK analysis. A detailed summary of the pharmacokinetic data included in the analysis is presented in the ESM and Table S2 in the ESM. The median age of patients was 66 years (range 32.0–89.0), and 56% of patients were men (Table 1).
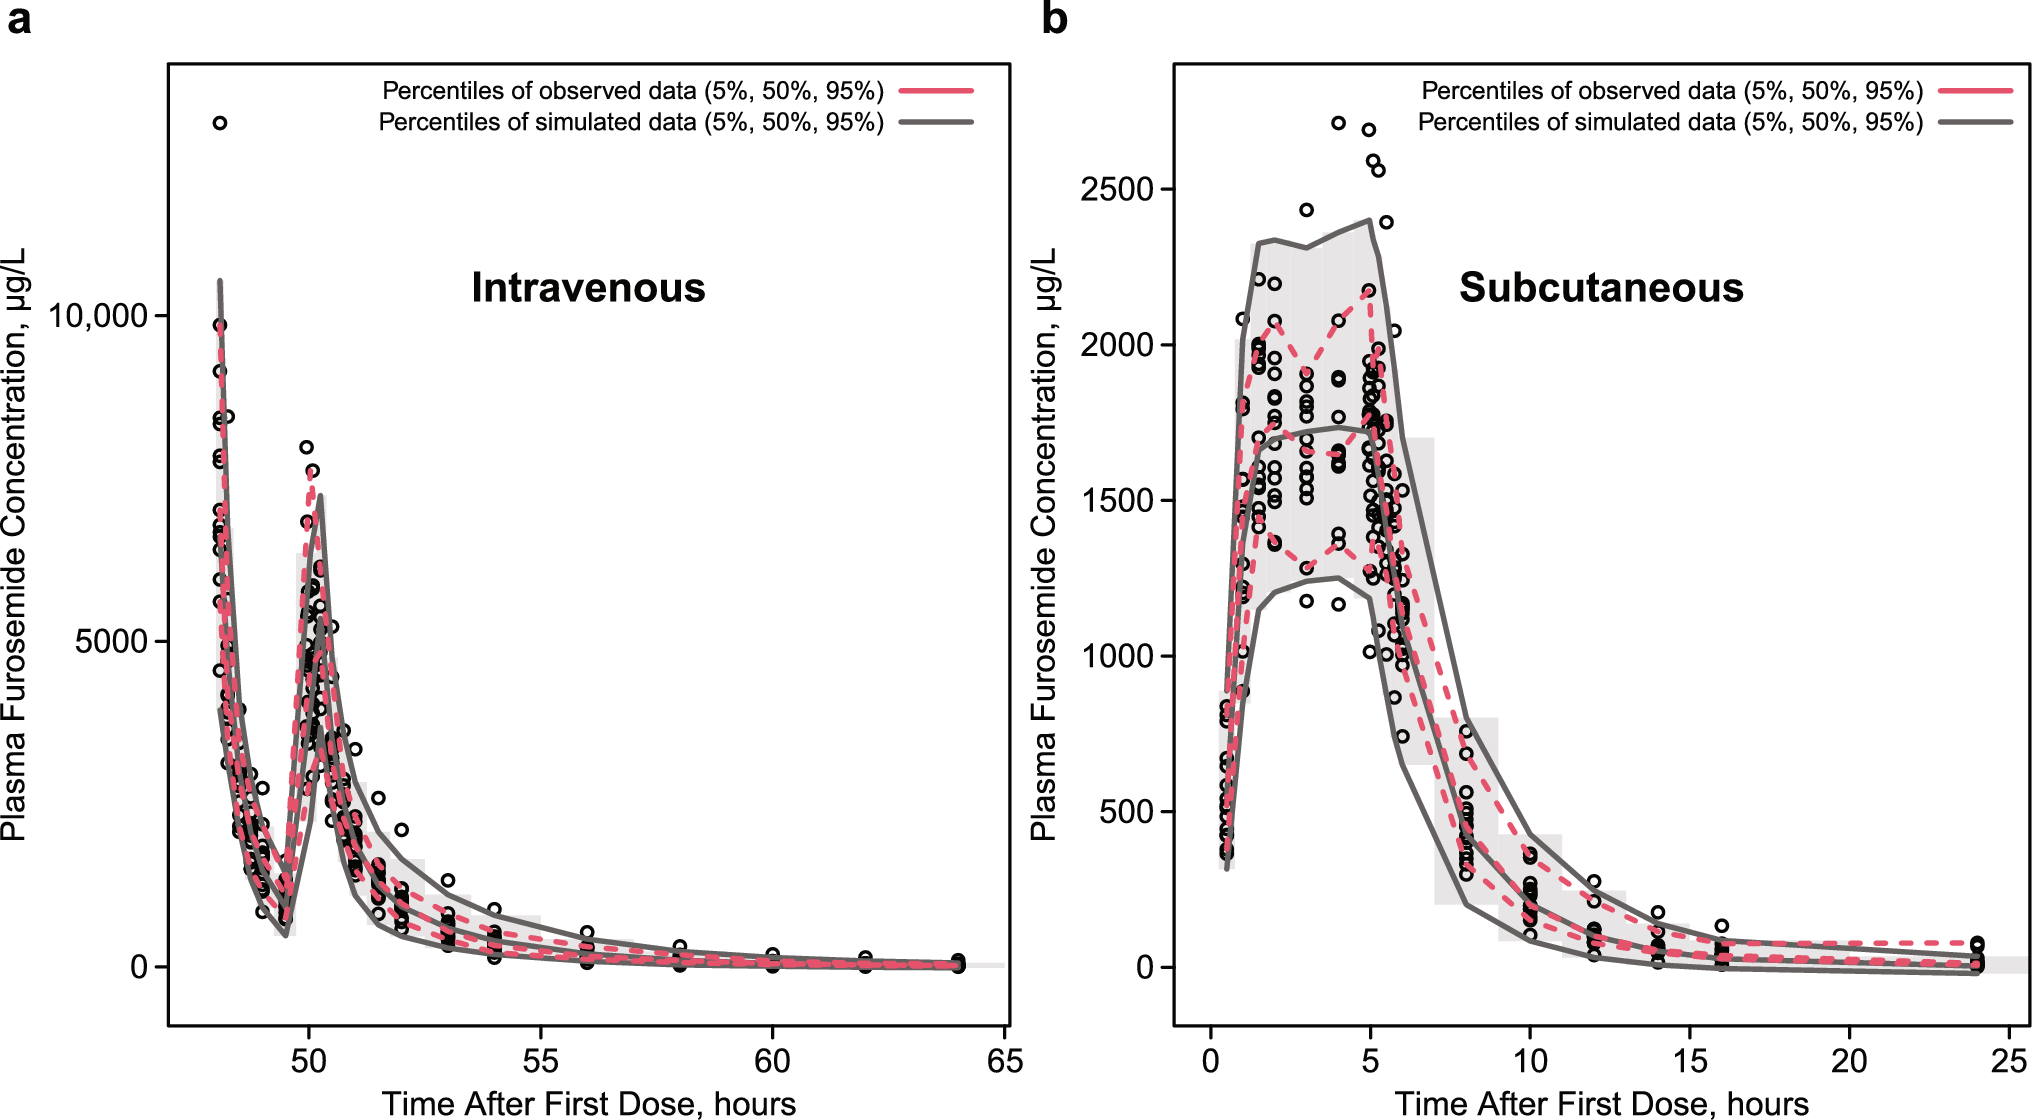
Table 1 Baseline demographics and covariates of patients included in the population pharmacokinetic (PopPK) analysis and of patients included in the DREAMM-8 pharmacokinetic dataset used for external validation3.2 Plasma Concentration–Time DataOverall, concentration–time data showed that the time course of ADC concentrations was similar to a typical biphasic disposition profile. The cys-mcMMAF concentrations were significantly lower than ADC concentrations and were found to potentially decrease more rapidly over time than ADC concentrations (Fig. 2; Fig. S1 in the ESM).
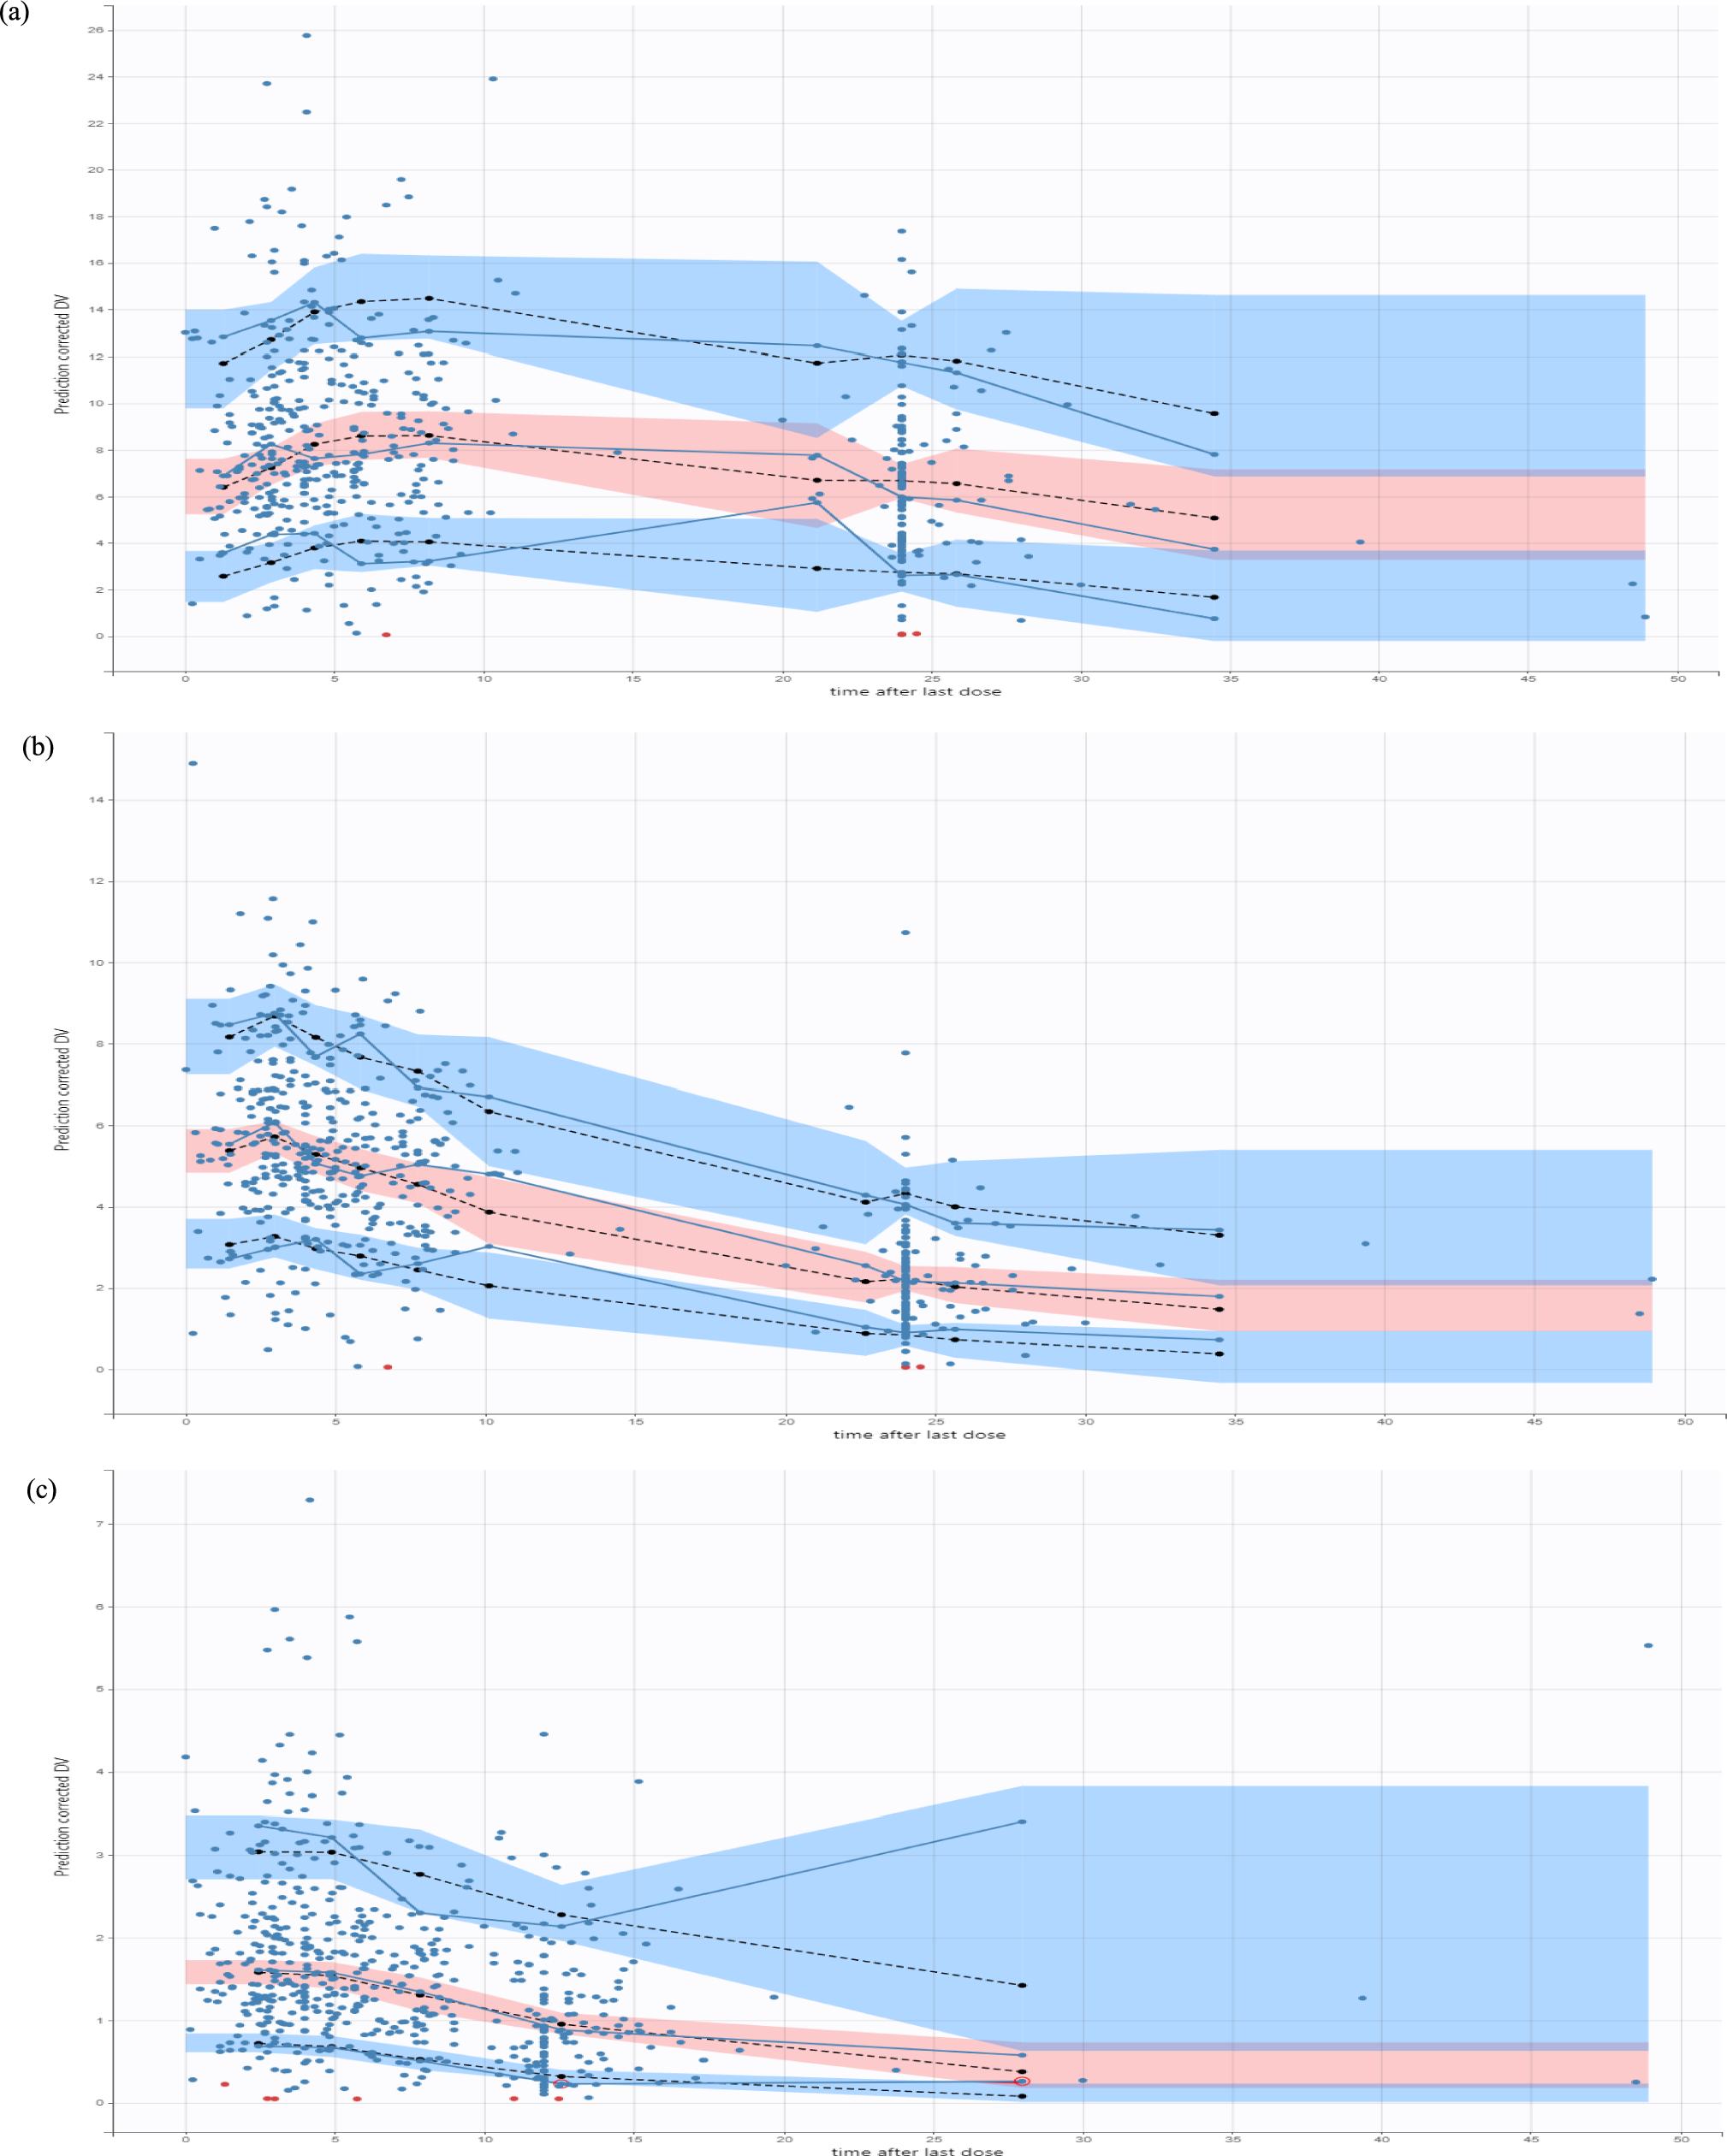
Fig. 2
Visual predictive check for dose 1 using the final antibody–drug conjugate (ADC) and cysteine maleimidocaproyl monomethyl auristatin F (cys-mcMMAF) population pharmacokinetic models. Black dots are observed data points. The black solid line is the observed median, and the black dashed lines are the observed 5th and 95th percentiles. The blue solid line is the predicted median, and the red solid lines are the predicted 5th and 95th percentiles. The blue area is the 95% confidence interval of the simulated median, and the red areas are the 95% confidence interval of the simulated 5th and 95th percentiles. Observed and simulated concentrations below the lower limit of quantification (LLOQ) are set to 1/2 LLOQ for visual predictive check analysis. The thin horizontal black dashed lines represent the LLOQ (0.05 ng/mL). All concentrations have been dose-normalized to a belantamab mafodotin 2.5 mg/kg dose
3.3 PopPK Model for ADCOutlying samples were removed following exploratory data analyses. Following the initial run using the legacy model 2023 for ADC (pharmacokinetic parameter estimates shown in Table S3 in the ESM), covariate analyses were performed. Correlations between continuous covariates are shown in Fig. S2 in the ESM. The final ADC model included baseline covariates of albumin, sBCMA, serum IgG, body weight, and race on CL; baseline albumin, body weight, BMI, and sBCMA on ADC central volume of distribution (Vc); baseline body weight on intercompartmental CL (Q); baseline body weight and albumin on ADC peripheral volume of distribution (Vp); and baseline sBCMA, serum IgG, and combination therapy on Imax (Table S4 in the ESM).
Pharmacokinetic parameter estimates from the final PopPK model for ADC are shown in Table 2. For a typical patient, ADC had an initial systemic CL of 0.926 L/day, a steady-state volume of distribution of 10.8 L, and an elimination phase half-life of 13.0 days. Following monotherapy treatment, CL was reduced by 33.2% to 0.619 L/day over time, resulting in an elimination half-life of 16.8 days. Following combination treatment (belantamab mafodotin with bortezomib plus dexamethasone or with lenalidomide plus dexamethasone), CL was reduced by 44.0% to 0.518 L/day, resulting in an elimination half-life of 19.1 days. Asian and Black/African American races were associated with decreases in the typical value of CL (by 8.7% and 13.9%, respectively). Overall, the time to 50% change in CL was 66.4 days, and the time to reach 95% of steady-state CL was approximately 172 days.
Table 2 Pharmacokinetic parameter estimates for the antibody–drug conjugate (ADC) final population pharmacokinetic (PopPK) modelThe final ADC PopPK model adequately described ADC pharmacokinetics and concentrations, as indicated by VPCs (Fig. 2), prediction corrected VPCs (Fig. S3 in the ESM), GoF plots (Fig. S4 in the ESM), normal inter-individual variability random effect distributions, and the distribution of normal prediction distribution error (Fig. S5 in the ESM). The alternative B2M ADC model, which replaced sBCMA with β2 microglobulin, had model parameter estimates similar to those of the final ADC model (Table S5 in the ESM), with an objective function value of − 11,130.8 (43.1-point increase from the final ADC model). Based on GoF plots, this model is qualified for use in cases where baseline sBCMA is not available. Model parameters, including random effects, were estimated with acceptable precision, and the relative standard errors were ≤ 39%, with the majority < 10%. NONMEM model codes for the final ADC and cys-mcMMAF models are available in the ESM. Comparison of simulated pharmacokinetic trajectories for a typical patient receiving monotherapy of 2.5 mg/kg every 3 weeks generated from the previously developed models and the updated final model (Fig. S6 in the ESM) showed that all three models led to similar ADC pharmacokinetic trajectories across the dosing interval and over time for a typical patient.
3.4 PopPK Model for cys-mcMMAFOutlying samples were removed after the exploratory data analyses. Following the initial run using the legacy model 2023 for cys-mcMMAF (pharmacokinetic parameter estimates shown in Table S6 in the ESM), covariate analyses were performed. The final cys-mcMMAF model included baseline covariates of sBCMA and body weight on CL of cys-mcMMAF [CLMMAF]; and sBCMA, serum IgG, body weight, BMI, albumin, and race on cys-mcMMAF Vc (Table S4 in the ESM).
Pharmacokinetic parameter estimates from the final PopPK model for cys-mcMMAF are shown in Table 3. A typical patient had a CLMMAF of 642 L/day and a cys-mcMMAF Vc of 12.3 L. The final cys-mcMMAF PopPK model adequately described cys-mcMMAF pharmacokinetics and concentrations, as indicated by VPCs (Fig. 2), prediction-corrected VPCs (Fig. S3 in the ESM), and GoF (Fig. S7 in the ESM). The alternative B2M cys-mcMMAF model had model parameter estimates similar to those of the final cys-mcMMAF model (Table S7 in the ESM), with an objective function value of − 14,106.8 (39.8-point increase from the final cys-mcMMAF model). Based on GoF plots, this model also qualified for use in cases where baseline sBCMA is not available. Model parameters including random effects were estimated with acceptable precision for the final PopPK model for cys-mcMMAF, and the relative standard errors were < 34%, with the majority < 15%.
Table 3 Pharmacokinetic parameter estimates for the cys-mcMMAF final population pharmacokinetic (PopPK) modelParameter estimates obtained using ADVAN5 were comparable to those obtained using ADVAN6 based on sensitivity analyses (Table S8 in the ESM). Comparison of simulated pharmacokinetic trajectories for a typical patient receiving monotherapy of 2.5 mg/kg every 3 weeks generated from the previously developed models and the updated final model (Fig. S6 in the ESM) showed that all three models led to similar cys-mcMMAF pharmacokinetic trajectories across the dosing interval and over time for a typical patient.
3.5 External Validation of the Final PopPK ModelsExternal validation of the final ADC and cys-mcMMAF PopPK models was performed using data from the DREAMM-8 study. This analysis included 150 patients, with 1221 measurable ADC concentrations and 829 measurable cys-mcMMAF concentrations. The median age of patients in the DREAMM-8 pharmacokinetic dataset was similar to that in the overall population for the PopPK analysis (66.0 [range 40.0–82.0] and 66.0 [range 32.0–89.0], respectively), but DREAMM-8 had a slightly higher proportion of male patients (65.3% and 56.4%, respectively) (Table 1). VPCs (Fig. S8 in the ESM), prediction-corrected VPCs (Fig. S9 in the ESM), and GoF plots (Figs. S10 and S11 in the ESM) showed that the bulk of the ADC and cys-mcMMAF concentrations were within the prediction intervals from the model, with some slight overprediction seen in the later time points for ADC. Overall, external validation with VPCs indicated that the final ADC and cys-mcMMAF PopPK models adequately described DREAMM-8 concentration data.
3.6 Post Hoc Pharmacokinetic Parameter Estimates and Simulation of Exposure ParametersIn the overall pharmacokinetic analysis population, the geometric mean (geometric coefficient of variation [GCV] %) initial ADC systemic CL was 0.901 L/day (40.0%), steady-state volume of distribution was 10.8 L (22.2%), and elimination half-life was 13.2 days (25.5%). Following treatment, steady-state CL was 0.605 L/day (43.2%), or approximately 32.9% lower than initial systemic CL, with an elimination half-life of 17.0 days (31.2%).
Individual cycle 1 exposures were simulated for all patients using the final ADC and cys-mcMMAF PopPK models and post hoc individual deviation from the population (ETA) values. For patients who received belantamab mafodotin 2.5 mg/kg on cycle 1 day 1 during a 21-day cycle (n = 690), the geometric mean (GCV %) exposure estimates for ADC were 3947 μg*h/mL (30.6%) for the AUC over the dosing interval of 0–21 days (AUC0–21), 7.83 μg/mL (30.6%) for Cavg over a dosing interval of 21 days (Cavg21), 43.7 μg/mL (22.1%) for Cmax, 2.03 μg/mL (62.5%) for Ctau of 21 days (Ctau21), and 0.498 h (4.6%) for time to Cmax. For cys-mcMMAF, the geometric mean (GCV %) exposure estimates were 94.2 ng*h/mL (42.3%) for AUC0–7, 0.243 ng/mL (42.4%) for Cavg21, 0.976 ng/mL (45.3%) for Cmax, and 22.9 h (49.9%) for time to Cmax. When evaluated by monotherapy and by each combination therapy, there were no clear differences in cycle 1 Cavg21 for ADC or cys-mcMMAF, including with the DREAMM-8 regimen (belantamab mafodotin with pomalidomide and dexamethasone) (Fig. 3).
Fig. 3
Normalized cycle 1 post hoc exposures by monotherapy and combination therapy. ADC antibody–drug conjugate, Bor-Dex bortezomib + dexamethasone, Cavg21 average concentration over a dosing interval of 21 days, cys-mcMMAF cysteine maleimidocaproyl monomethyl auristatin F, Len-Dex lenalidomide + dexamethasone, Mono monotherapy, Pom-Dex pomalidomide + dexamethasone
3.7 Impact of Covariates on Exposure ParametersThe impact of baseline covariates on ADC and cys-mcMMAF exposures was demonstrated by calculating the percent change in exposure from the typical patient value. Covariates, including baseline sBCMA, serum IgG, and albumin, had a statistically significant impact on ADC exposure; their effects generally led to a less than 20% difference from a typical patient for ADC Cavg across their 5th and 95th percentiles, with smaller changes observed for cys-mcMMAF exposure (Fig. 4 and Table 4). The impacts of baseline body weight and race on ADC and cys-mcMMAF exposure were minor (Table 4).
Fig. 4
Percent change in exposure parameters by covariate. The solid black vertical line represents the typical patient. The dashed vertical lines represent the 5th and 95th percentiles of covariate values. ADC antibody–drug conjugate, Cavg average concentration over a dosing interval, Cmax maximum concentration, Ctau concentration at the end of a dosing interval, cys-mcMMAF cysteine maleimidocaproyl monomethyl auristatin F, IgG immunoglobulin G, sBCMA soluble B-cell maturation antigen
Table 4 Predicted percent change from typical patient values for antibody–drug conjugate (ADC) and cys-mcMMAF exposure measures for covariates included in the population pharmacokinetic (PopPK) modelsThe impact of patient characteristic subgroups on cycle 1 ADC Cavg21 with a normalized belantamab mafodotin dose of 2.5 mg/kg is presented in Fig. 5. Across the subgroups of age, sex, race, ethnicity, region, renal function, hepatic function, and number of prior treatments, no major differences were observed in ADC Cavg21. The baseline covariates that led to the largest deviation in geometric mean compared with the entire analysis population were albumin <35 g/L, serum IgG >27.39 g/L, β2 microglobulin >423 nM, sBCMA >147 μg/L, and BMI <18.5 kg/m2, all of which were associated with low ADC Cavg. Genetic variants in the activity of transporters present in the liver had no impact on ADC Cavg. For cys-mcMMAF, all subgroups had geometric means within 0.8–1.25 times that of the total analysis population, though CIs were wide because of the small patient numbers (Fig. S12 in the ESM).
Fig. 5

Cycle 1 antibody–drug conjugate (ADC) average concentration over a dosing interval of 21 days (Cavg21) by subgroup. The solid black circle represents the geometric mean, and the error bar represents the 95% confidence interval (CI). The solid black line represents the geometric mean value of all participants. Dashed red lines represent an interval of 0.8–1.25 times the geometric mean of all patients. All the patient exposures were normalized to a belantamab mafodotin 2.5 mg/kg dose. Subgroups with fewer than five patients were omitted from the plot. Missing data were imputed at the median value for the population except for pharmacogenomic activity, where unknowns were left uncategorized. BMI body mass index, BSEP bile salt export pump, CD cluster of differentiation, ECOG PS Eastern Cooperative Oncology Group performance status, IgG immunoglobulin G, ISS International Staging System, LDH lactate dehydrogenase, MRP multidrug resistance-associated protein, OATP organic anion transporting polypeptide, P-gp P-glycoprotein, PGx pharmacogenomic, sBCMA soluble B-cell maturation antigen
Comments (0)