
Remember me
KarMMa-3 is an international, randomized, open-label, phase 3 trial. This trial enrolled patients 18 years of age or older who had received two to four previous therapies including daratumumab, an immunomodulatory agent, and a proteasome inhibitor for at least two consecutive cycles and who had documented disease progression within 60 days after the completion (last dose) of the last therapy. Patients were randomly assigned in a 2:1 ratio to receive either ide-cel (a single intravenous infusion, target dose range: from 150 × 106 to 450 × 106 CAR+ T cells; doses of ≤ 540 × 106 CAR+ T cells were permitted) or one of five standard regimens, with a primary endpoint of progression-free survival. The target dose range in KarMMa-3 was selected on the basis of findings of positive benefit–risk profiles at dose levels above 150 × 106 CAR+ T cells from the Phase 1 dose escalation and expansion study CRB-401 [NCT02658929] [22]. A total of a maximum of 25 CK samples per patient were planned to be collected from peripheral blood at prespecified time points, including predose and Day 3, 5, 8, 10, 12, 15, 18, and 22 in Month 1 postinfusion, followed by 1-month intervals from Month 2 to 4, 3-month intervals from Month 7 to 25, and 6-month intervals until Month 60 postinfusion. A total of a maximum of eight immunogenicity samples per patient were planned to be collected at prespecified time points, including predose and Day 25 in Month 1, followed by Day 1 in Month 2, 4, 6, 10, 19, and 31 postinfusion. In total, two different formulations were used during the manufacturing process of ide-cel. A detailed description of the trial design and the eligibility and exclusion criteria are provided in the protocol [7].
The KarMMa-3 trial was designed by the sponsors, 2 seventy bio and Celgene (a Bristol Myers Squibb company), in collaboration with academic investigators and was conducted in accordance with the Good Clinical Practice guidelines of the International Council for Harmonization. The protocol was approved by the institutional review board or independent ethics committee at each participating center before trial initiation. All patients provided written informed consent.
2.2 Bioanalytic Methods2.2.1 Polymerase Chain Reaction (PCR)Ide-cel CAR-T transgene levels were quantified using a droplet-digital polymerase chain reaction (ddPCR). A detailed description of the Ide-cel ddPCR method has been reported before [23]. Briefly, DNA was isolated from whole blood in dipotassium ethylenediaminetetraacetic acid (K2-EDTA) anticoagulant from subjects undergoing CAR-T cell therapy. A validated ddPCR was performed on the DNA using the following primer and probes: forward primer: 5′-TCA GAA GGC TGT AGA CAA ATA C-3′; reverse primer: 5′-TGA TCT AAG TTC TTC TGA TCC TGT-3′; and probe: 5′-FAM-TGG GAC AGC TAC AAC CAT CCC TTC AG-NFQ. The ddPCR was run at 95 °C for 10 min, followed by 40 cycles of 95 °C for 30 sec and 55 °C for 1 min, and, finally, 98 °C for 10 min and a hold temperature of 4 °C. The linearity of ddPCR assay ranged from 1 to 180,000 gag copies/well. The validated assay range for the ddPCR method was between 8 and 720,000 copies/reaction with a lower limit of quantification (LLOQ) of 40 copies/µg at a target DNA input of 400 ng.
2.2.2 Immunogenicity AssayClinical serum samples were analyzed for the presence of anti-CAR antibodies using a validated electrochemiluminescence (ECL) immunoassay. The formation of adenosine deaminase (ADA) to the ECD of the CAR was evaluated using a multitiered approach including a screening assay, a confirmatory assay, and a titer assay. Samples and controls were preincubated with biotinylated and ruthenylated ide-cel-CAR-ECD. Any ADA present in the human serum forms a bridge between the conjugated reagents. This complex is bound to a blocked MSD-streptavidin (MSD-SA) plate and detected by a chemiluminescent signal that is generated when voltage is applied. The resulting electrochemiluminescent signal (ECL or relative lights units, RLU) is directly proportional to the amount of ADA present in the human serum. The sensitivity of the ADA assay was 1.08 ng/mL. The validation of the ADA method and sample analysis were conducted in accordance with scientific guiding principles and in compliance with the appropriate regulations in place at the time of execution [24].
2.3 Modeling DataIn the KarMMa-3 ide-cel arm, as of the PK data cutoff date of 1 March 2023, a total of 225 patients received ide-cel infusion. All 225 patients had postinfusion measurable CAR transgene copy numbers in whole blood quantified by the ddPCR method and were included in the population CK analysis population. Because different bioanalytical methods were used to quantify cellular kinetics between KarMMa and KarMMa-3 [23], no data pooling or direct comparison of model parameters was conducted between the two studies. A total of 3525 transgene data points were available from 225 CK-evaluable subjects in KarMMa-3 ide-cel arm and included in the population CK modeling. Of these transgene data points, 18% (639/3525) transgene were below the lower limit of quantification (LLOQ) and treated as left-censoring data on the basis of the likelihood of being less than the LLOQ for these values in the model development [25]. Additional information of left-censoring data treatment in Monolix is available at its official site (https://monolix.lixoft.com/censoreddata/).
Covariate analyses were conducted to identify the potential effects of covariates on the population CK of ide-cel. The covariates included baseline demographic and physical characteristics, disease factors, biomarker levels, clinical variables, immunogenicity, and product attributes. The proportion of missing data was determined for each subject covariate in the dataset, and missing covariates were handled as follows. For covariates missing for ≤ 10% of the subjects, continuous covariates were imputed as the population median and categorical covariates were imputed as the most frequent category. For covariates missing for > 10% of the subjects, covariates were excluded from the analysis. Refer to the summary of covariates (see Supplementary Material Table S1) for a detailed list of covariates.
In the post hoc analysis, the cellular expansion parameters were estimated using model-simulated time course data of CAR transgene copy numbers through noncompartmental analysis (NCA) methods. In this analysis, the key cellular expansion parameters included area under the curve of CAR transgene levels from 0 to 28 days (AUC0-28D) and Cmax (peak transgene level), which are highly correlated with each other (see Supplementary Material Fig. S6). The efficacy data included progression-free survival (PFS) and objective response rate (ORR). The efficacy assessments on PFS and ORR were adjudicated by the IRC according to the International Myeloma Working Group (IMWG) Uniform Response Criteria for Multiple Myeloma [26]. Since the previous analyses on KarMMa [27] suggested apparent relationships between exposure and cytokine release syndrome (CRS) requiring anti-interleukin (IL)−6 treatment (tCRS) or CRS requiring steroid treatment (sCRS), these two safety endpoints were included in the post hoc analysis of this population CK modeling study for KarMMa-3.
2.4 Model DevelopmentThe population PK analysis and model performance evaluation were conducted in Monolix® (version 2020R1; Lixoft SAS, Antony, France) using the software-supplied stochastic approximation expectation–maximization (SAEM) algorithm. The additional postprocessing and diagnostic analyses on the results were conducted in R version 4.0.3.
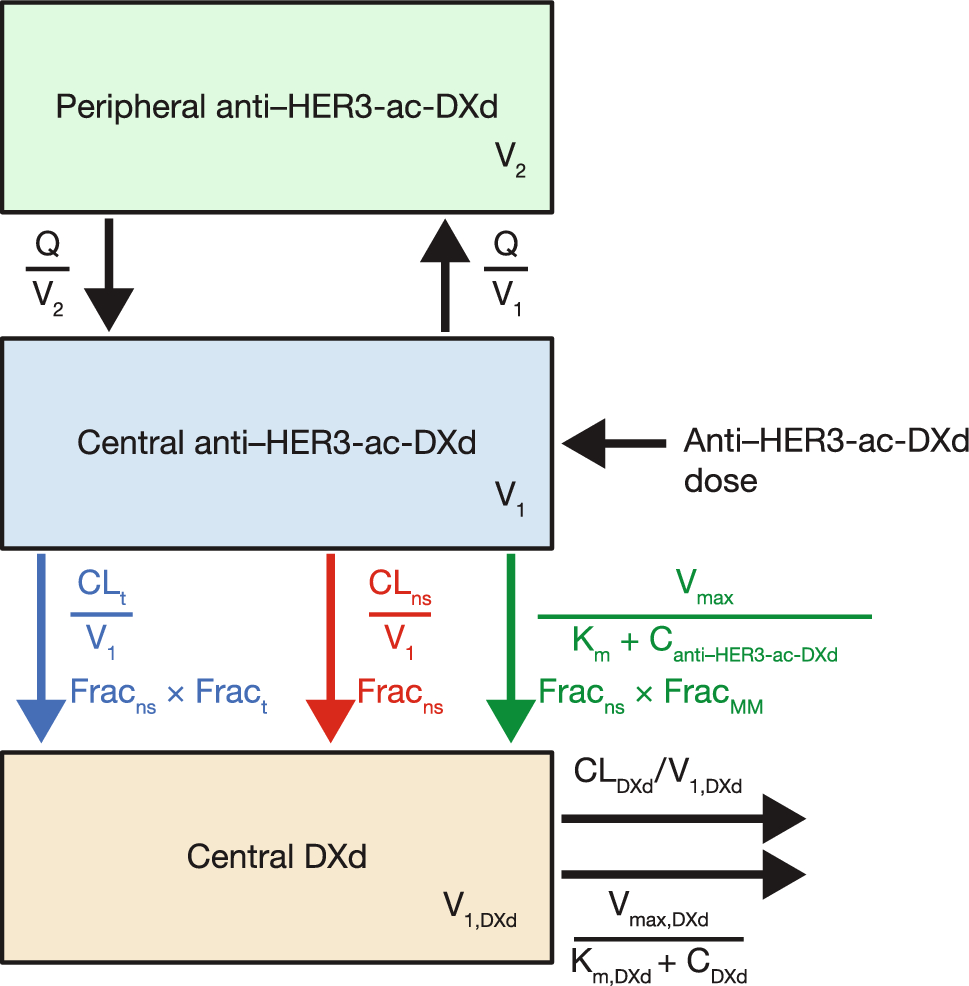
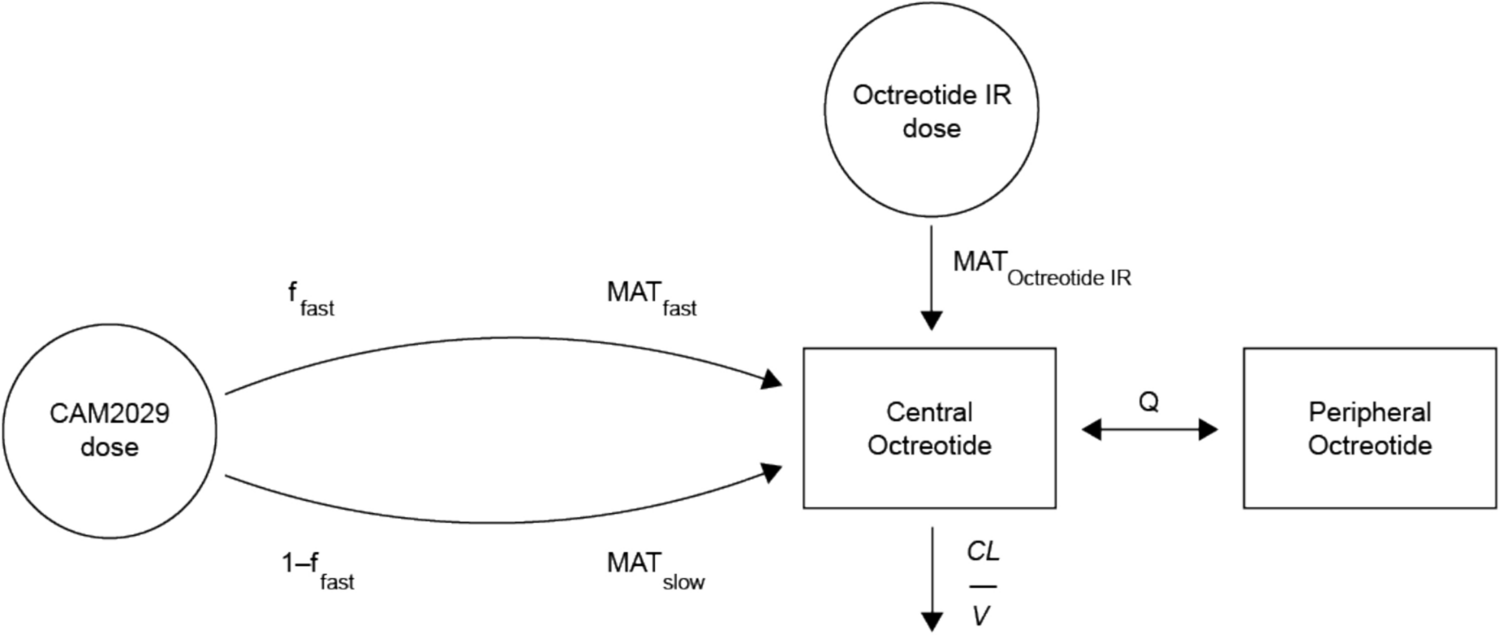
By examining the model fitting and performance, a modified piecewise structural model was developed to characterize the cellular kinetics (CK), with an initial lag phase and then saturable cell expansion, followed by conversion from effector cells to memory cells and their elimination (Fig. 1). The structural parameters include initial transgene level (E0), lag in expansion (Tlag), time of maximal expansion (Tmax), maximal expansion rate (Vmax), transgene level at which expansion rate is saturated to half of Vmax (Km), conversion rate from effector cells to memory cells (r), elimination rate of effector cells (δE), and elimination rate of memory cells (δM). This piecewise structural model allows for characterizing multiple phases in CAR-T cellular kinetics including distribution, expansion, contraction, and persistence. The early distribution occurring immediately after CAR-T infusion was observed in patients with relapsed or refractory diffuse large B-cell lymphoma (DLBCL) treated with tisagenlecleucel [11, 28]. However, it was not captured in the KarMMa-3 study because the first PK sample was collected at 2 days postdose. Tlag was therefore used to reflect the potential time required for initial distribution of CAR-T cells. Additionally, random effects were incorporated into the structural model to account for interindividual variability (IIV). The random effects and error models are described in the Supplementary Material (Text S1).
Fig. 1
Diagram illustrating the modified piecewise model of cellular kinetics
The covariate model was developed by adding covariates according to the diagnostic plots and statistical tests provided in Monolix and by examining modeling performance after incorporating the covariates effects into the base model. No apparent correlation was observed between the candidate covariates. The postinfusion ADA status was further included to the model as a time-varying covariate to estimate effects of treatment-emergent immunogenicity on cellular kinetics. Following the stepwise covariate building approach as suggested by Traynard et al. [29], the covariate effect was included into the final model using a forward selection approach when the difference in corrected Bayesian Information Criterion (BICc) from the previous optimal run decreased (ΔBICc < 0). The final model’s covariates were then confirmed by a backward elimination approach. Additionally, the postinfusion ADA was included as a time-varying covariate to characterize its effect on δM. The final covariate models were described below.
$$\text\left(\text0\right)= \text\left(0}_}\right) + _0,\text} \times \text + _0,\text} \times \text + _0}$$
$$\text\left(T\text\right) = \text\left(}_}\right) + _}$$
$$\text\left(T\text\right)=\text\left(}_}\right)+_,\text} \times \text + _}$$
$$\text\left(V\text\right) =\text\left(}_}\right) + _,\text} \times \text +_,\text} \times \text+ _}$$
$$\text\left(\text\right)=\text\left(}_}\right) +_}$$
$$\text\left(r\right)=\text\left(_}\right) +_$$
$$\text\left(\delta \text\right)=\text\left(}_}\right)+ _,\text} \times \text+ _}$$
$$\text\left(\delta \text\right)=\text\left(}_}\right)+_,\text}\times \text +\text(f_})+ _}$$
$$\text\left(f_}\right) = \text\left(}}_}\right) +_}$$
where, \(\beta\) represents the model estimated effects for the respective covariate effect, η represents the random effect at the individual level, and fADA represents the effect of postinfusion ADA. BADA is 0 if baseline ADA status is negative or 1 otherwise, FORMU is 0 if Formulation A was used or 1 if Formulation B was used, logtCRCLBL represents log(baseline creatinine clearance/87.0 mL/min), logtDOSE represents log(actual dose/445 × 106 CAR+ cells), and logtPRSB represents log(baseline serum soluble BCMA level/145 ng/mL), with log transformation applied to continuous covariates normalized to their median values. The log error model was used during the model development (see Supplementary Material Text S1).
The model performance was evaluated on the basis of scientific plausibility, BICc, log-likelihood, goodness of fit, and visual predictive check (VPC) plot, following the Monolix modeling workflow recommended in a previous publication [29]. In addition, dataset preparation, statistical summary, and graphic presentation were conducted in R (Version R4.0.3).
2.5 SimulationsSimulations using the final population cellular kinetic model estimated the impact of significant covariate effects on ide-cel exposure parameters including area under the transgene level curves from 0 to 28 days postinfusion (AUC0-28D), peak expansion (Cmax), and time to Cmax (Tmax). Individual parameters were sampled 100 times for each of the 225 patients from conditional distribution using a Markov chain Monte Carlo procedure (MCMC) supplied in Monolix, with fixed-effects set as the population estimates and covariate values set as the observed values for each patient. The covariate effects on exposure parameters from 22,500 simulated patients were explored using forest plots.
2.6 Analyses of Relationships Between CK Parameters and Clinical ResponsesThe relationships between CK parameters and clinical responses were examined by graphical inspection and statistical analyses. For the time-to-event data such as progression free survival (PFS), Kaplan–Meier (K–M) curves were stratified by quartiles of CK parameter values with median PFS estimated for each quartile. For the binary endpoints such as overall response rate (ORR), cytokine release syndrome requiring anti-IL6 treatment (tCRS), and cytokine release syndrome requiring steroid treatment (sCRS), the Wilcoxon test was conducted on CK parameters values between subjects in presence versus absence of the corresponding events.
Comments (0)