2.1 Data2.1.1 Study Design and Investigated Population
The data used originate from two multicentre, prospective, open-label, phase II/III PK bridging studies of the LENA project [15]. In the LENA project, children pretreated with ACEi and ACEi naïve children with heart failure due to DCM (EudraCT 2015-002335-17) or CHD (EudraCT 2015-002396-18) were administered enalapril in the form of ODMT for 8 weeks. The studies were conducted in hospitals in Austria, Germany, Hungary, the Netherlands (two sites) and Serbia (two sites).
The ethics committees of the participating institutions had given their approval and informed parental consent was obtained before each subject was enrolled in the study. Assent of participating children was obtained in accordance with national requirements.
Male and female patients with a weight greater than 2.5 kg and heart failure due to CHD or DCM were included in the studies. Both ACEi naïve patients and patients with ACEi pretreatment were included in the studies. Patients who were already receiving an ACEi had to be willing to switch to enalapril ODMT. Subjects with CHD were eligible if they required after load reduction by drug therapy and were between birth to under 6 years of age. Subjects with DCM and without ACEi treatment were eligible if they had left ventricular end-diastolic dimension ˃ P95 and/or left ventricular shortening fraction < 25%. Subjects with DCM and ACEi pretreatment must have documented evidence of having fulfilled these criteria before the start of the ACEi therapy. In addition, the subjects with DCM had to be between 1 month and 12 years old.
The exclusion criteria were:
Severe heart failure and/or end stage heart failure precluding introduction or continuation of ACEi.
Too low blood pressure, e.g. less than P5 for age.
Restrictive and hypertrophic cardiomyopathies.
Obstructive valvular disease (peak echocardiographic gradient more than 30 mmHg).
Uncorrected severe peripheral stenosis of large arteries including severe coarctation of the aorta.
Severe renal impairment with serum creatinine above two times the upper limit of normal according to the hospital’s test methodology.
History of angioedema.
Hypersensitivity to ACEi.
Concomitant medication: dual ACEi therapy, renin inhibitors, angiotensin II antagonists or non-steroidal anti-inflammatory drugs except acetylsalicylic acid only for antiplatelet therapy.
Already enrolled in an interventional trial with an investigational drug, unless no interference with the current study can be shown.
Both studies together involved 35 ACEi naïve subjects and 67 subjects with ACEi pretreatment. This analysis used the serum concentrations of enalapril and enalaprilat of the ACEi naïve subjects collected from January 2016 to April 2018.
2.1.2 Dosing
The dosing regimen used was previously developed using a physiologically based pharmacokinetic simulation with the aim of achieving similar enalapril and enalaprilat exposures as in adults for a starting dose of 2.5 mg and a maintenance dose of 20 mg [11]. The dosing regimen contains age- and weight-dependent recommended titration doses, target doses and maximum doses (Supplementary Table 1). The dosage for the subjects was selected according to the investigator’s judgement.
For dosing, the appropriate number of ODMT with 0.25 mg enalapril maleate (now approved as Aqumeldi®, Proveca Pharma Limited, Dublin) or 1 mg enalapril maleate were administered orally. The ODMT were placed in the patient's cheek pouch, where they rapidly disintegrate into small particles that could be easily swallowed. A drink of the patient’s/parent’s choice (e.g. breast milk, formula milk, cow milk, and water) could be taken to facilitate swallowing. By dissolving the 0.25 mg ODMT in tap water directly in a syringe, it was also possible to administer 0.025 mg and 0.125 mg enalapril maleate if the investigator considered a starting dose of 0.25 mg too high for the patient. In this case, the appropriate volume of the resulting dispersion was administered. According to the dosing regimen, daily doses ≤ 0.25 mg were administered once daily in the morning and daily doses > 0.25 mg were divided into two equal doses, each administered in the morning and evening.
The dosing times at the study visits and 7 days before were recorded by the investigator or study nurse in electronic case report forms. The dosing times 7 days before were taken from the patient diary in which the parents noted the dosing times.
2.1.3 Sampling
The sampling regimen consists of a PK full profile day with blood sampling at five or six predefined time points and single PK samples on the remaining study visits. For the investigated ACEi naïve subjects, it was recommended to obtain the PK full profile at the initial dose visit. The predefined time points for PK sampling were before as well as 1, 2, 4, 6 and 12 h after administration of enalapril ODMT. Alternatively, the PK full profile could also be obtained after reaching steady state at the optimal dose, that is, after at least 7 days at this dose. In this case, the predefined time points for PK sampling were before as well as 1, 2, 4 and 6 h after administration of enalapril ODMT. A deviation of ± 15 min from the predefined time point was permitted. The exact time point of each PK sampling was noted.
Single PK samples were collected during titration, dose confirmation, study control visits and at the end of the study. The predefined time points of the study visits are listed in Supplementary Table 2. During titration and at the end of the study, the PK sample was collected predose and the sampling time was noted. The time point of the single PK sample at the dose confirmation visit or at the study control visits could be determined by the investigator if the exact time of sampling and the time of the last dose intake were specified in the electronic case report form.
A total of 200 µL of whole blood was taken per PK sample. If possible, an additional back-up sample was taken for reanalysis, which also comprised up to 200 µL of whole blood. The sampling regimen was designed using modelling and simulation techniques. The total collected blood volume during the study did not exceed the recommended limits for blood loss in paediatrics in clinical studies according to the European Medicines Agency guideline [16].
2.1.4 Analytical Methods
Serum samples were analysed after solid phase extraction using liquid chromatography–triple quadrupole tandem mass spectrometry (Shimadzu HPLC 10 [Shimadzu, Duisburg, Germany] coupled with AB Sciex API 2000 mass spectrometer [Sciex, Darmstadt, Germany]). The lower limit of quantification was 0.195 µg/L for enalapril and 0.180 µg/L for enalaprilat. Further information can be found elsewhere [11].
2.2 Population Pharmacokinetic Modelling
PopPK analysis was performed by nonlinear mixed effects modelling using NONMEM® version 7.2.0 (ICON plc, Dublin, Ireland) and Perl-speaks-NONMEM version 4.9.0 [17, 18] via the graphical user interface Pirana® version 2.9.6 (Certara, Radnor, PA, USA). The first-order conditional estimation method with interaction was used to estimate PK parameters and their variability. The dataset for the PopPK analysis was created with Excel® version 2406 (Microsoft, Redmond, WA, USA) and R version 4.2.2 (The R Foundation for Statistical Computing, Vienna, Austria). Statistical analyses and graphics were realized with R version 4.2.2 (The R Foundation for Statistical Computing, Vienna, Austria). The R packages used included nonmem2R for the goodness-of-fit plots, mrgsolve [19] for the simulations and coveffectsplot [20] for the creation of the forest plot.
2.2.1 Base Model Development
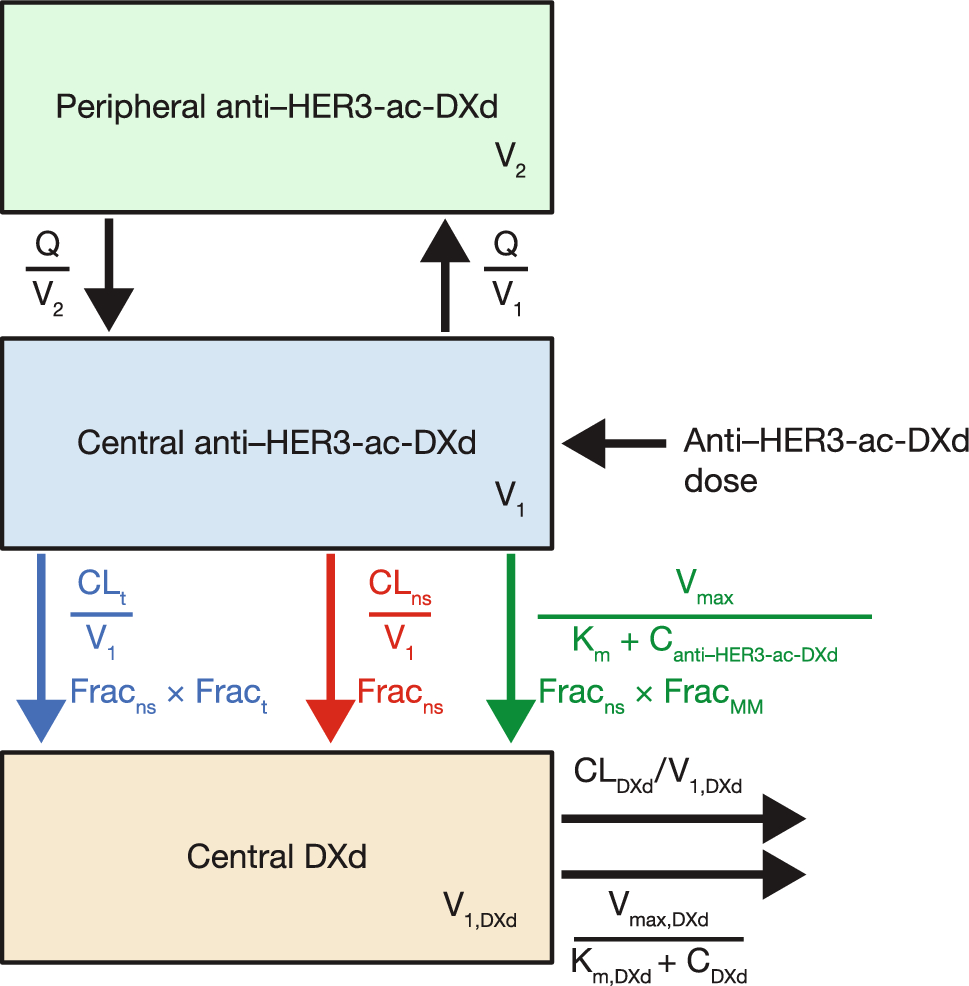
The starting point for the model development was a combined model in which a one-compartment model of enalapril is coupled with a one-compartment model of enalaprilat with first-order absorption and elimination. This starting point was chosen because a combined model with one-compartment models for enalapril and enalaprilat had previously been used for an initial analysis of all LENA subjects [21]. As no urine data are available for enalapril and enalaprilat, a fixed value of 0.7 was used for the metabolised fraction of enalapril in this model based on literature data [9]. Due to the small number of samples in the absorption phase, the absorption rate constant (ka) was fixed to the estimated value of the aforementioned final model (0.6 1/h) [21]. It was assumed that the interindividual variability of the parameters was lognormally distributed. The interindividual variability of the apparent clearance and apparent volume of distribution of enalapril and enalaprilat was therefore built in exponentially. For enalapril, a proportional error model and a combined error model with an additive and a proportional error were tested as a residual error model. For enalaprilat, the residual error was described by a proportional error model. Allometric scaling was applied to the apparent clearance and apparent volume of distribution of enalapril and enalaprilat as follows:
$$} = \theta \times \left( }_}}} }}}_}}} }}} \right)^ ,$$
where TV represents the typical value of the PK parameter at given weight, θ represents the population mean of the PK parameter at median body weight of the analysed population (BWmedian) and BWind represents the individual body weight. The exponent, n, was fixed to 0.75 for apparent clearances and fixed to 1 for apparent volumes of distribution. For missing weight values, the last observation carried forward approach was used, in which the missing value is replaced by the last observed value of the subject. For enalapril, both the addition of an absorption lag time and the use of a two-compartment model were tested. For the apparent clearance of enalapril and enalaprilat, the addition of an exponential function and a (sigmoid) maximum effect (Emax) function with postmenstrual or postnatal age was tested as a maturation function.
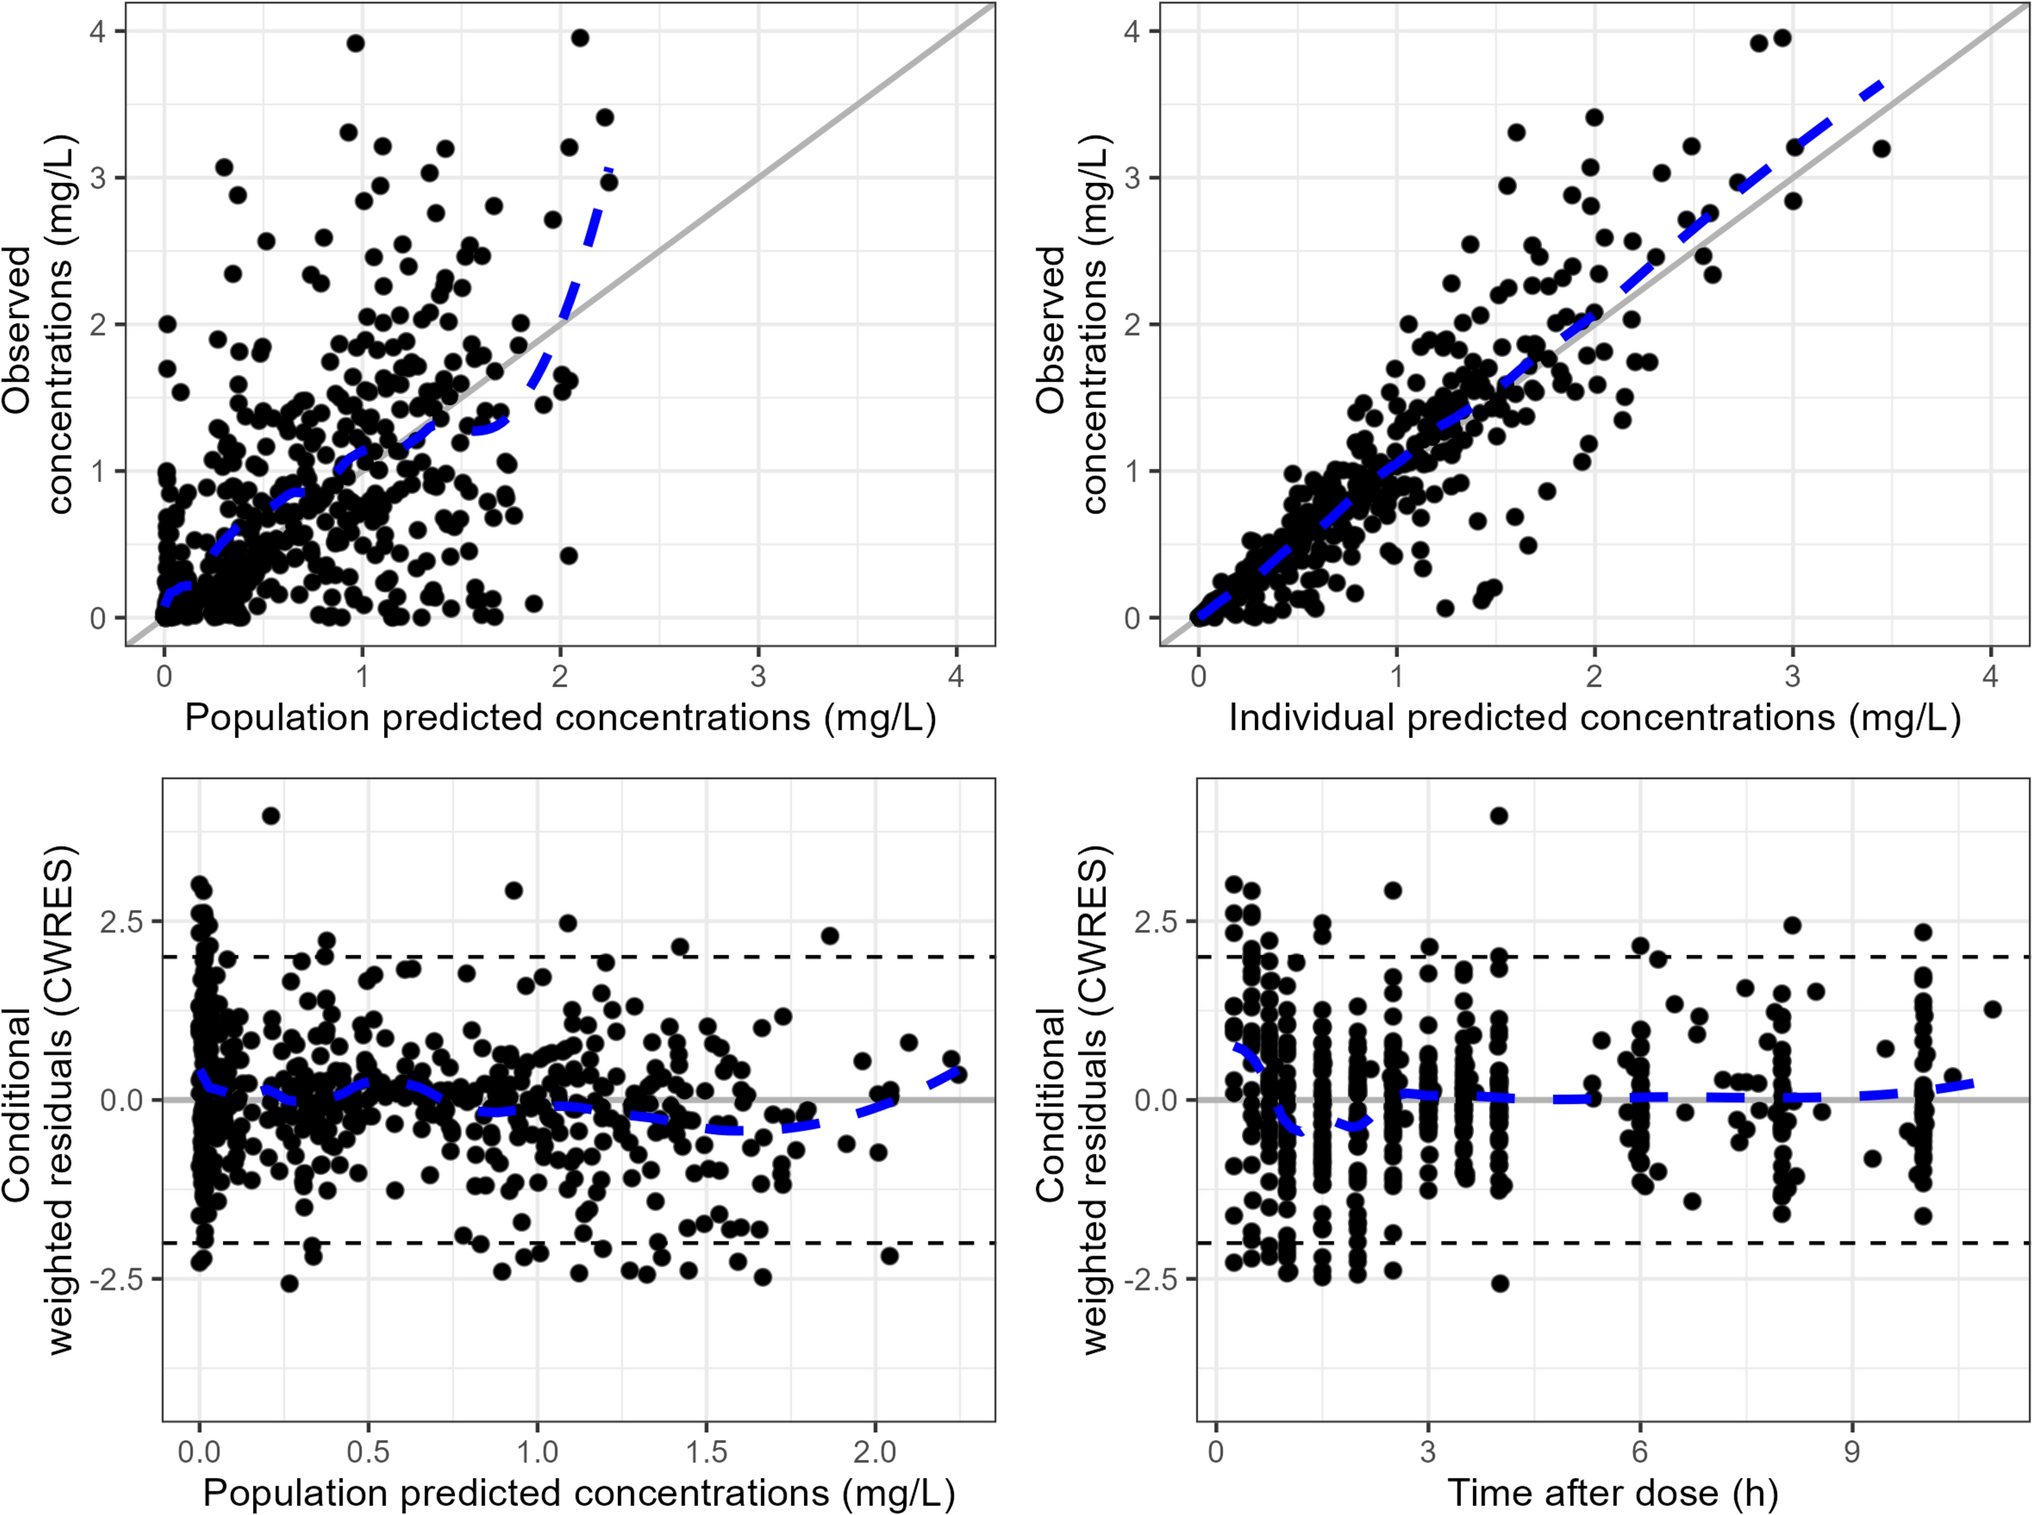
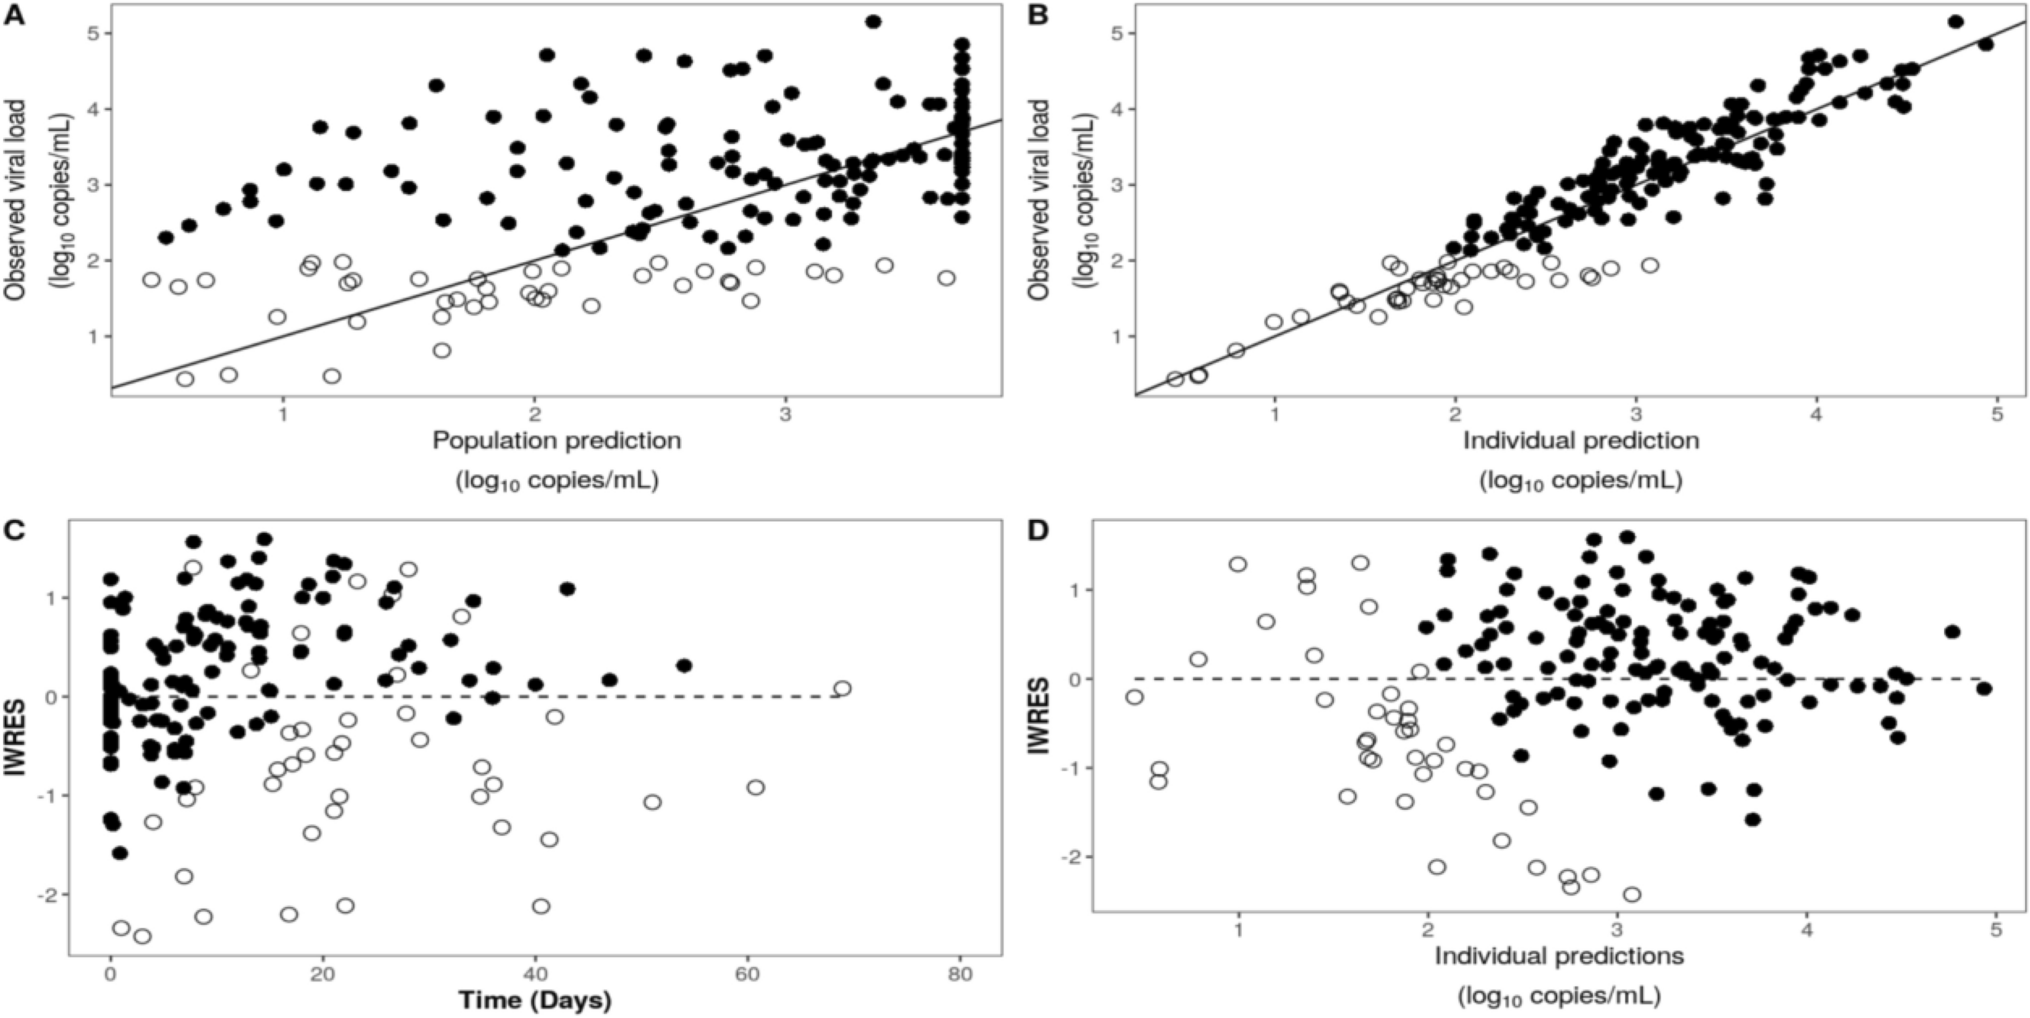
Model selection was based on the change in the objective function, the change in the residual and interindividual variability, the change in the relative standard errors of the parameter estimates and the visual inspection of the goodness-of-fit plots. Since bioavailability could not be determined on the basis of the available data, the apparent clearance and apparent volume of distribution for enalapril and enalaprilat are given. Samples collected prior to the first administration of enalapril were excluded from the analysis, as no concentration was to be expected at that time in the ACEi naïve subjects. Furthermore, samples with insufficient information on dosing were excluded from the analysis. Samples with concentrations below the limit of quantification were either excluded (M1 method) or treated as censored (M3 method), and the respective estimates of the PK parameters were compared [22].
2.2.2 Covariate Model Development
The stepwise covariate modelling approach was used to test potential covariates. Physiologically plausible covariate relationships were previously defined. Thus, age, sex, serum creatinine and Ross score were tested as covariates for the apparent clearance of enalapril and enalaprilat. In addition, age, sex and Ross score were tested as covariates for the apparent volume of distribution of enalapril and enalaprilat. The covariate Ross score represents the modified Ross score determined by the investigator [23]. In the forward step, a reduction in the objective function value of at least 3.84 (p < 0.05, one degree of freedom) led to the inclusion of the covariate in the model. To retain the covariate in the model, the increase in the objective function value after removal of the covariate had to be at least 6.63 (p < 0.01, one degree of freedom) in the backward step. A linear function model was tested for continuous and categorical covariates. For age and serum creatinine, a power function model was initially tested. If this led to the inclusion of the covariate, in the next step it was tested whether an exponential function model was superior to the power function model. For the Ross score, the exponential function model was tested directly, as the Ross score can also be zero and therefore the power function model cannot be used. As the continuous covariates age, serum creatinine and Ross score were time-varying covariates, this was considered in the stepwise covariate modelling. The only categorical covariate, sex, was included in the model as follows for the covariate search:
$$} = \theta_ \times \left( \times } \right),$$
where TV represents the typical value of the PK parameter for the respective sex (female = 0, male = 1), θ1 represents the population mean of the PK parameter for female subjects and θ2 represents the proportional change in the population mean of the PK parameter in male subjects compared with female subjects.
2.2.3 Model Evaluation
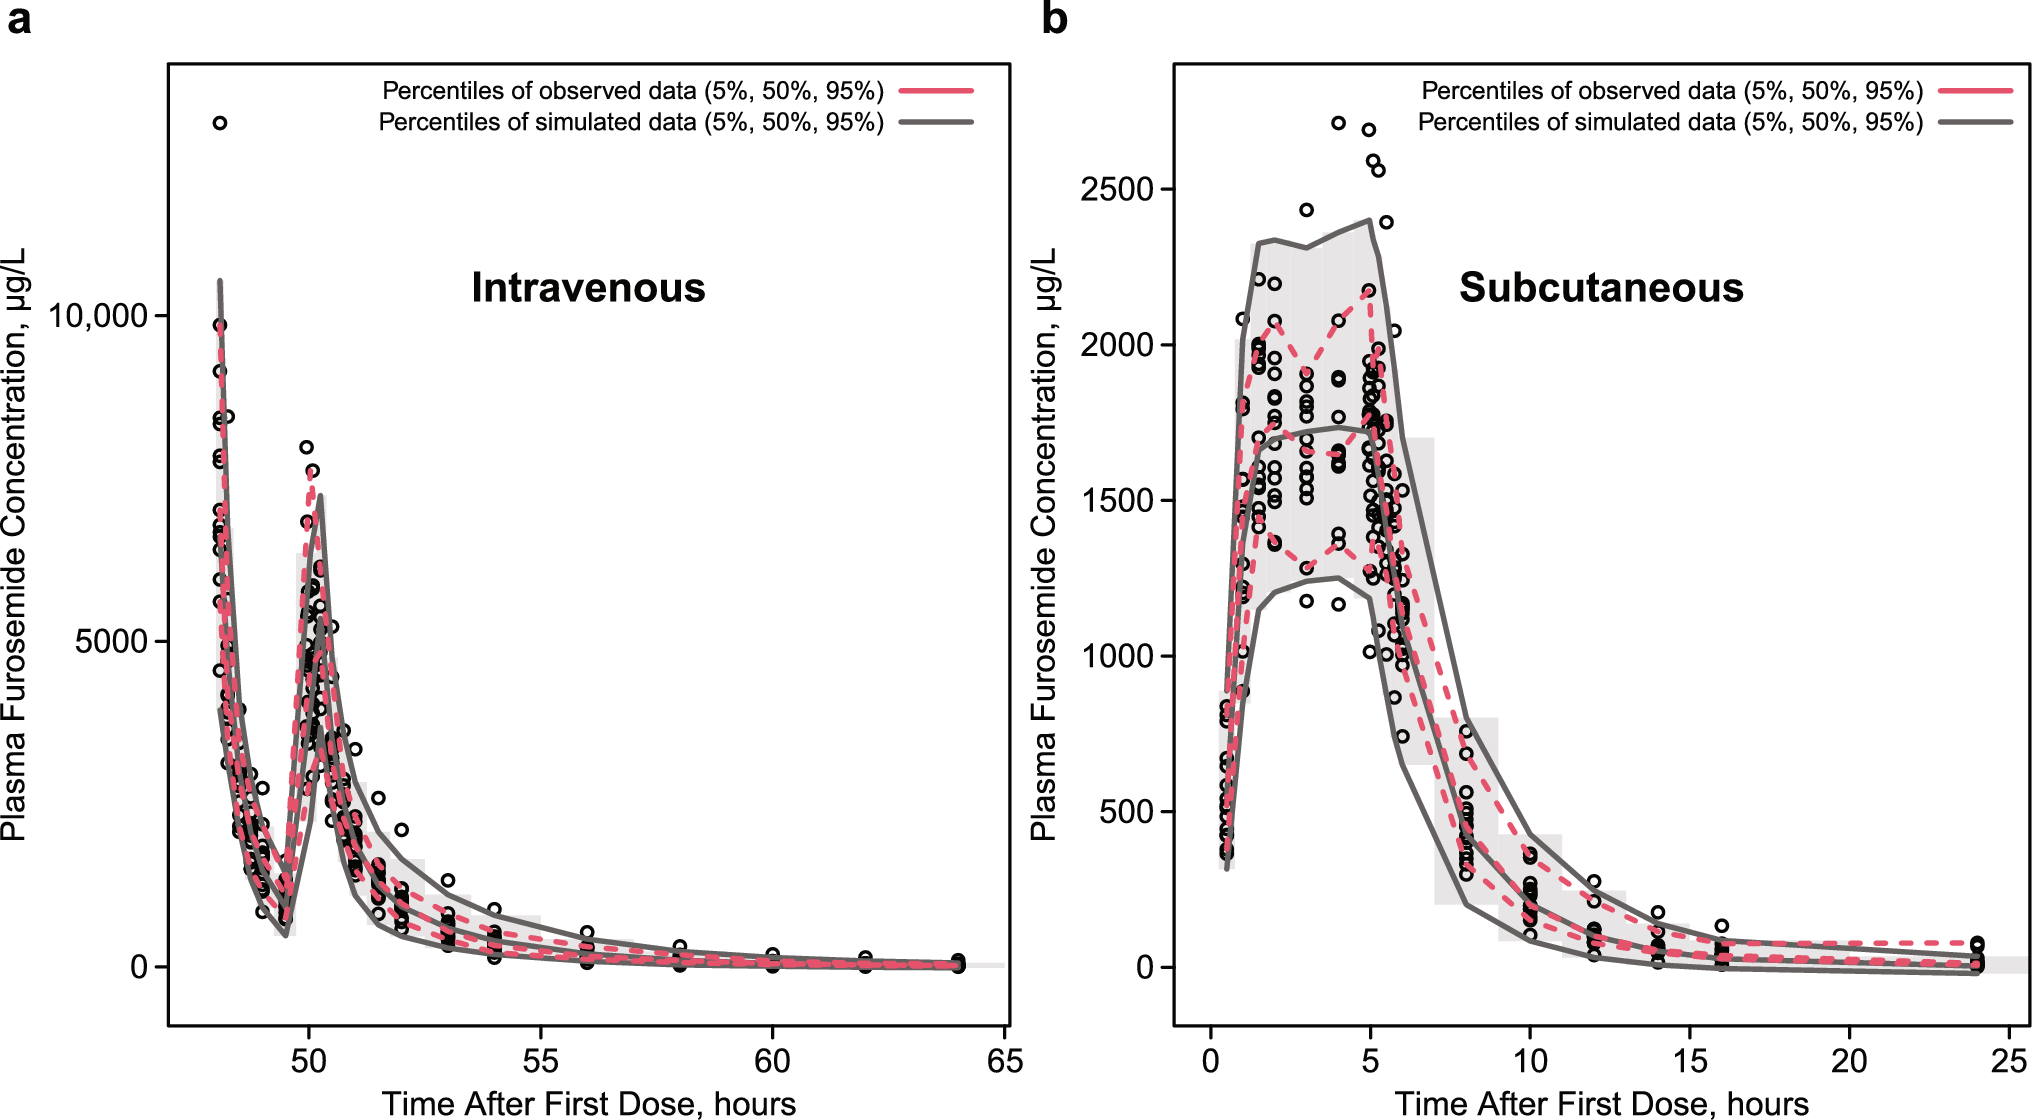
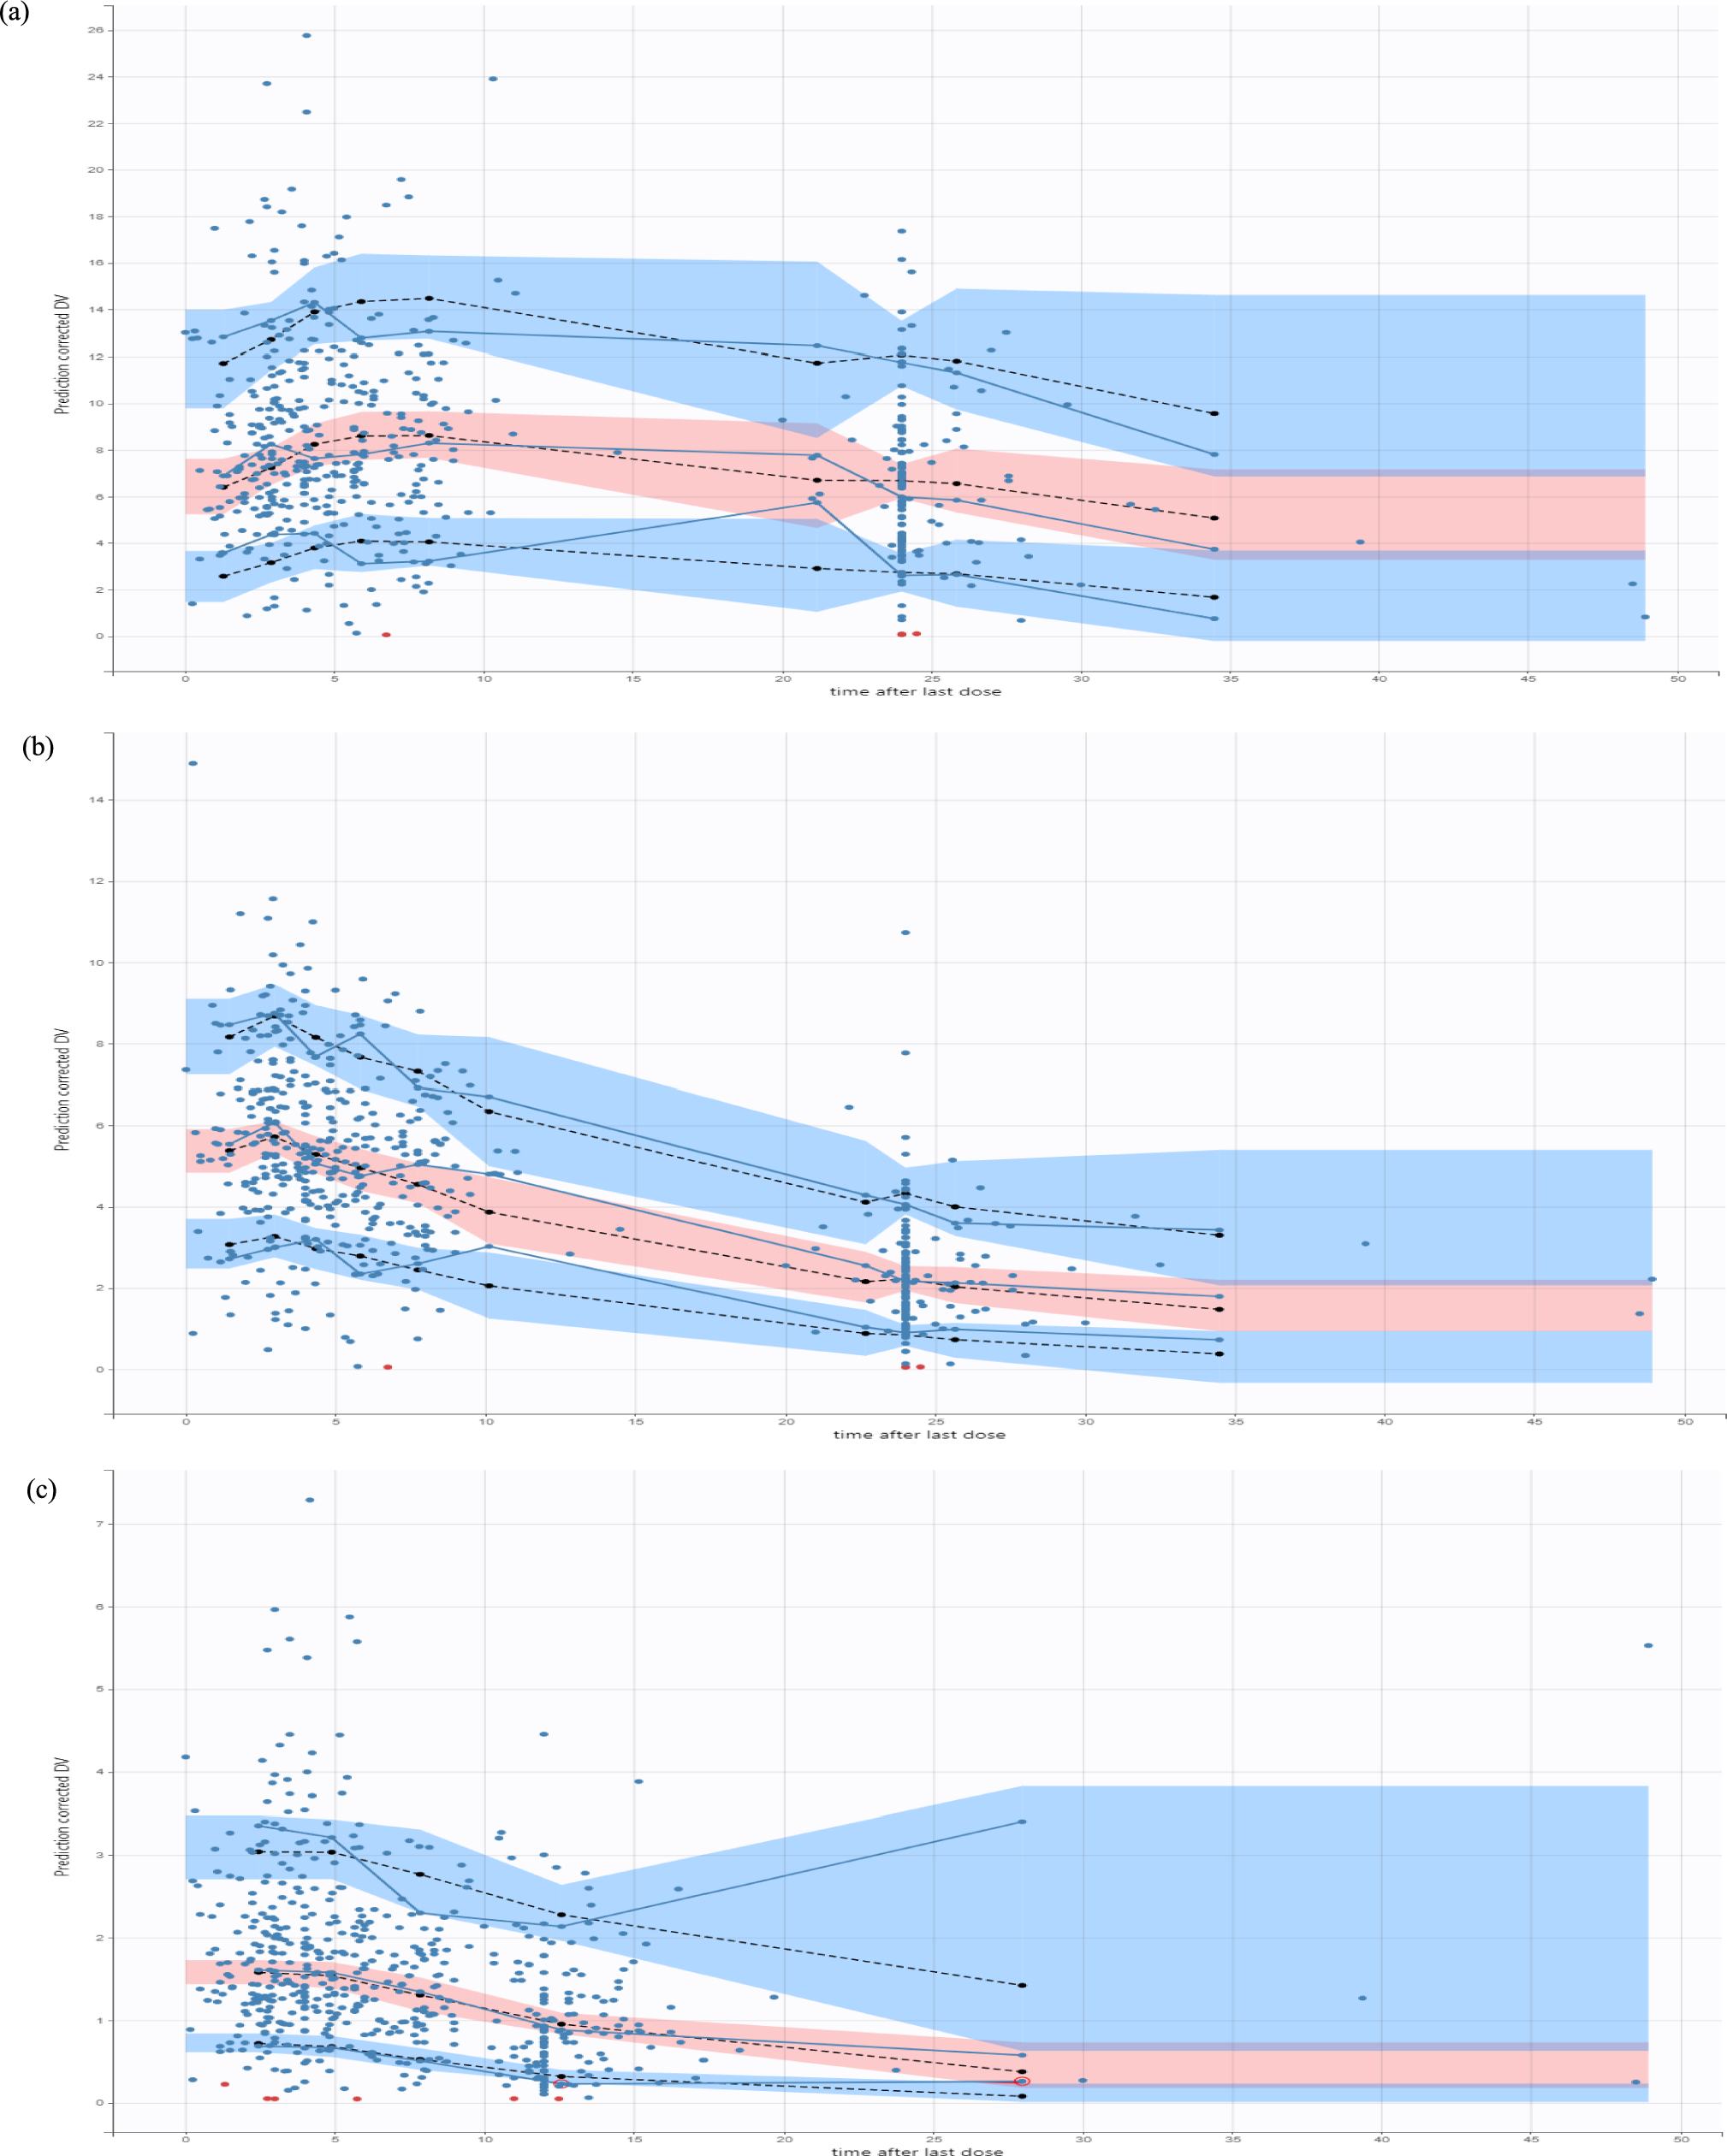
The final model was evaluated by visual inspection of the goodness-of-fit plots and the prediction- and variability-corrected visual predictive checks (pvcVPCs) [24]. The pvcVPCs were generated based on 2000 simulated replicates of the original dataset design. In addition, a nonparametric bootstrap was performed. Therefore, a total of 1000 bootstrap datasets were generated by resampling with replacement from the original dataset. The calculation of the median and the 95% confidence interval (CI) of the model parameters was carried out once with and once without the runs with rounding errors. Furthermore, the condition number was calculated for the final model to check for overparameterisation, where a value above 1000 may indicate overparameterisation [24].
2.3 Simulations
Simulations were performed with the final model to assess the impact of weight and the included covariates. A subject with the weighted median weight of the population and the weighted medians of the included covariates (calculated by Perl-speaks-NONMEM) served as the reference subject. For the variation of the covariates, the 5th, 25th, 75th and 95th percentiles of the weight and the included covariates of the analysed population were calculated. One covariate was varied at a time and serum concentrations of enalaprilat were simulated for the different scenarios. As the subjects were children, it was not sensible to vary the age and weight completely independently. Therefore, a suitable weight was selected for the above-mentioned percentiles of age using the World Health Organization (WHO) weight percentiles [25]. Similarly, a suitable age for the above-mentioned percentiles of weight was selected using the WHO weight percentiles. The population analysed included both underweight and normal weight subjects. Therefore, when selecting the appropriate weights and ages, the first WHO weight percentile was used to represent underweight children and the 50th WHO weight percentile was used to represent normal weight children. As there are separate WHO weight percentiles for girls and boys, the mean of the values determined for girls and boys was used.
The parameter uncertainty was considered by using the estimates of the fixed-effect parameters of the bootstrap runs, while the interindividual variability was omitted. For each bootstrap dataset, AUC and the maximum serum drug concentration (Cmax) after the first dose and at steady state were determined for each covariate scenario. The AUC and Cmax were dose normalised by dividing by the simulated dose and standardised by dividing by the respective AUC and Cmax of the reference person. Finally, the 5th, 50th and 95th percentiles for the dose normalised and standardised AUC and Cmax were calculated for each covariate scenario investigated and presented graphically in a forest plot.
Simulated serum concentrations of enalaprilat over 240 h after a single dose of 0.25 mg enalapril maleate were used to obtain an approximation of the area under the concentration–time curve from time zero to infinity (AUC∞) after the first dose. The dose of 0.25 mg enalapril maleate was chosen according to the dosing regimen. For the steady state simulation, it was assumed that the age-appropriate target dose according to the dosing regimen was administered every 12 h. The serum concentration of enalaprilat was simulated for 252 h and then the AUC from 240 to 252 h was calculated to obtain the area under the concentration–time curve during a dosage interval (AUCτ) at steady state. To obtain the maximum serum drug concentration after the first dose (Cmax,1) and the maximum steady state serum drug concentration during a dosage interval (Cmax,ss), the highest concentration reached after the first dose and at steady state was determined.
In addition, analogue simulations after the first dose were performed solely with the variation of the Ross score. Every possible expression of the Ross score between the minimum and maximum Ross score of the population was tested. As only the single dose of 0.25 mg enalapril maleate was used in the simulations, no dose normalisation was performed. The Cmax,1 at different Ross scores was illustrated with boxplots.

Comments (0)