Animals
All animal protocols were approved by the Institutional Animal Care and Use Committee of the University of Virginia (Charlottesville, VA, USA). The approved protocol number was 3114. All surgical and experimental procedures were carried out in accordance with the National Institutes of Health Guide for the Care and Use of Laboratory Animals (NIH publications number 23–80) revised in 2011. All mice were kept in a vivarium room at constant temperature (23 ± 2℃) and 12 h light/dark cycle with free access to food and water. Six- to eight-week-old male CD-1 mice were purchased from Charles River (Wilmington, MA). Our manuscript was written up in accordance with the Animal Research: Reporting In Vivo Experiments.
Animal Groups
CLP successfully induced SAE in mice in our previous study [7]. This current study was designed to determine the role of autophagy and inflammation in SAE. For this purpose, CD-1 mice were randomly assigned to four groups: sham-operated group, CLP group, 3-methyladenine (3-MA) group, and PDTC group. The 3-MA and PDTC groups had CLP in addition to receiving 3-MA and PDTC treatments, respectively. A control group that animals did not have any surgery or treatments was not included because the sham-operated group was not different from the control group in the inflammatory cytokine levels, learning and memory in our previous study [7]. Control groups that animals with CLP received injection of solvent (normal saline, NS) for 3-MA and PDTC were not included because the injections of solvents alone into the brain did not affect the presentations of SAE [7]. Limiting these non-essential groups simplified our study. The learning and memory of the 4 groups of mice were assessed by Barnes maze and fear conditioning tests from 6 days after the CLP. Different cohorts of mice with the same experimental conditions were sacrificed at 24 h after surgery. Their brains were harvested for Western blotting, immunohistochemistry, ELISA enzyme-linked immunosorbent assay (ELISA), Golgi staining, and electron microscopy. The sample size per experimental group was from 7 to 14 depending on the tests of experiments (more animals per group were used in behavioral studies).
Anesthesia and Surgery
Polymicrobial sepsis was induced by CLP with a method as we described previously [7]. Animals were anesthetized with 1.8% isoflurane. A 1-cm long ventral midline incision was performed. The cecum was then carefully exposed, ligated just distal to the ileocecal valve with a 3–0 silk suture to avoid intestinal obstruction, and punctured twice using a 19-gauge needle. The punctured cecum was squeezed to expel a small amount of fecal material and returned to the abdominal cavity. The abdominal incision was closed in layers with a 7 − 0 silk suture and wound clips. The wound was infiltrated with 0.25% bupivacaine. Immediately after the surgery, some mice received an intracerebroventricular injection of the autophagy suppressor 3-MA (200 nmol in NS, Sigma, M9281) or intraperitoneal injection of PDTC (50 mg/kg in NS, Sigma, P8765), an anti-inflammatory agent [25, 26]. All animals received subcutaneous administration of 1 ml NS immediately after the operation to provide fluids. Sham-operated mice had the abdominal incision but did not have cecum ligation and puncture.
Barnes Maze Test
Six days after surgery, mice were assessed by Barnes maze test as we described before [7]. The Barnes maze (SD Instruments, San Diego, CA) is a circular platform with 20 equally spaced holes. One of the holes was connected to a dark chamber that was called target box. The test was started by placing mice in the center of platform. Aversive noise (85 dB) and bright light (200 W) shed on the platform were used to encourage mice to find the target box. They were trained in 4 consecutive days with 3 min per trial, 2 trials per day and 15 min between trials. Their reference memory was then tested on day 5 (short-term retention) and day 12 (long-term retention). Each mouse had one trial on each of these two days. No test was performed during the period from day 5 to day 12. The latency to find the target box during each trial was recorded with the assistance of ANY-Maze video tracking system (SD Instruments).
Fear Conditioning Test
Mice were assessed by fear conditioning test 24 h after the Barnes maze test. Each mouse was placed in a test chamber wiped with 70% alcohol and subjected to three tone-foot shock pairings (tone: 2000 Hz, 85 db, 30 s; foot shock: 0.7 mA, 2 s) with a 1-min interval between pairings in a dark room. The mouse was removed from the test chamber after training. The mouse was placed back to the same chamber 20 h later for 6 min without receiving tone or shock stimulation. The amount of time with freezing behavior was recorded in the 6-min interval (context-related freezing behavior). The mouse was then placed in a different test chamber wiped with lemon juice 2 h later in a light room. After 3 min without any stimuli, the tone stimulus was turned on for 30 s followed by 1-min interval for three cycles (4.5 min in total). The freezing behavior in this 4.5-min interval was recorded (tone-related freezing behavior). The time of freezing behavior was counted by an observer who was blind to group assignment of animals.
Brain Tissue Harvest
Mice were deeply anesthetized with isoflurane and perfused transcardially with NS. The cerebral cortex and hippocampus from Bregma − 2 to -5 were harvested for immunohistochemistry. Also, the cerebral cortex and hippocampus were dissected out immediately after transcardial perfusion for ELISA and Western blotting. These brain tissues were harvested 24 h after surgery. Brain tissues were harvested 7 days after surgery for Golgi staining.
Western Blotting
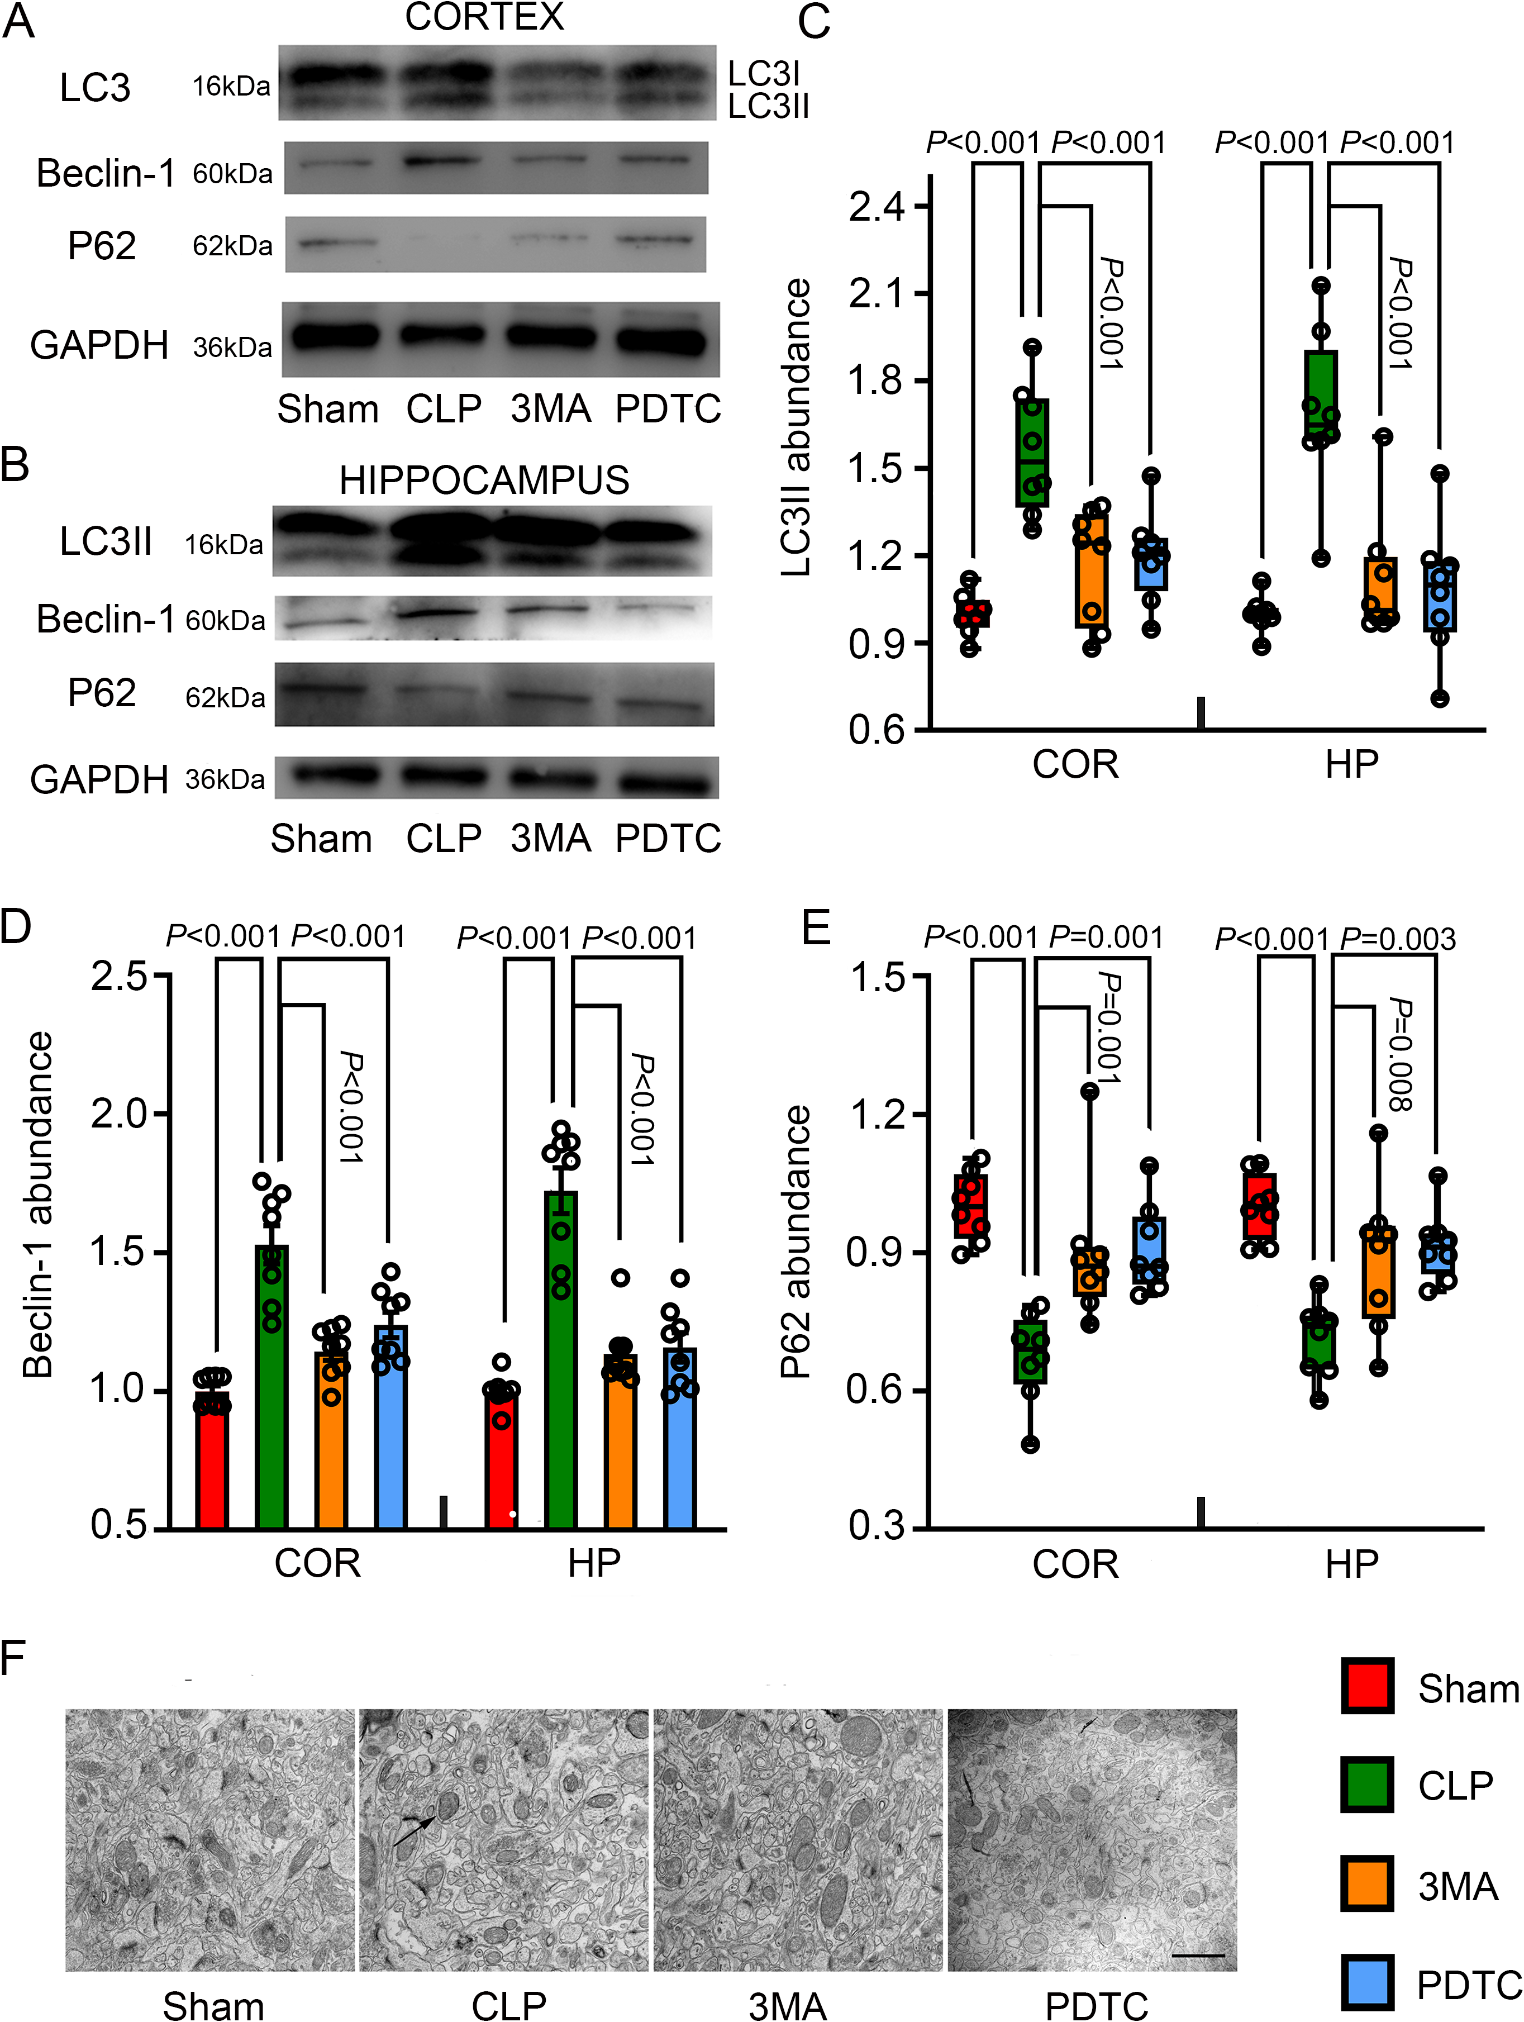
Briefly, cerebral cortex and hippocampus tissues were homogenized in RIPA buffer (Sigma-Aldrich, St. Louis, MO) containing protease inhibitor cocktail (10 mg/ml aproteinin, 5 mg/ml pepstatin, 5 mg/ml leupeptin, and 1 mM phenylmethanesulfonylfluoride) and placed on ice for 30 min. The homogenates were centrifuged at 13,000 rpm for 25 min at 4 °C. The supernatant was collected for Western blotting. Protein concentration was determined by BCA assay.
Twenty micrograms of proteins per lane were separated on a polyacrylamide gel (Catalog number: 456–1025; Bio-rad, Hercules, CA) and then blotted onto a polyvinylidene difluoride membrane. The membranes were blocked with Protein-Free T20 Blocking Buffer (Catalog number: 37573, Thermo Scientific, Logan, UT) and incubated with the following primary antibodies overnight at 4 °C: the rabbit polyclonal anti-LC3B antibody (1:500 dilution; catalog number: 48394; Abcam), the rabbit polyclonal anti-p62 antibody (1:500 dilution; catalog number: 56416; Abcam), the rabbit polyclonal anti-Beclin-1 antibody (1:500 dilution; catalog number: 62557; Abcam), and the rabbit polyclonal anti-glyceraldehyde 3-phosphate dehydrogenase (GAPDH) antibody (1:2000 dilution; catalog number: G9545; Sigma-Aldrich). Appropriate secondary antibodies were used. Protein bands were visualized by Genesnap version 7.08 and quantified by Genetools version 4.01. The relative protein expression was normalized to those of GAPDH proteins from the same sample to control for errors in protein sample loading and transferring during Western blotting analysis, respectively. The results from animals under various experimental conditions were then normalized by the mean values of the corresponding control animals.
Immunohistochemistry
Cerebral hemisphere from Bregma − 2 to -5 was harvested, fixed in 4% paraformaldehyde in 0.1 M phosphate-buffered saline at 4 °C for 24 h, and embedded in paraffin. Coronal sections at 5 μm were cut and mounted on slides. Antigen retrieval was performed in sodium citrate buffer (10 mM sodium citrate, 0.05% Tween 20, pH 6.0) for 20 min. The slides were immersed in 5% normal goat serum and 1% bovine serum albumin (BSA) in Tris-buffered saline plus 0.05% triton-X 100 (TBST) for 2 h at room temperature. The sections were incubated with (1) the rabbit polyclonal anti-LC3B antibody (1:500 dilution; catalog number: 48394; Abcam) and mouse monoclonal anti-microtubule-associated protein-2 (MAP-2) antibody (1:500 dilution, catalogue number: ab254143; Abcam); (2) the rabbit polyclonal anti-LC3B antibody (1:500 dilution; catalog number: 48394; Abcam) and goat polyclonal anti-glial fibrillary acidic protein (GFAP) antibody (1:500 dilution, catalog number: 53554; Abcam); or (3) the rabbit polyclonal anti-LC3B antibody (1:500 dilution; catalog number: 48394; Abcam) and goat polyclonal anti-ionized calcium-binding adapter molecule 1 (Iba-1) antibody (1:500 dilution, catalog number: 5076; Abcam) at 4 °C overnight. Sections were rinsed in TBS. The brain sections were then incubated for 1 h at room temperature in a dark room with (1) the donkey anti-rabbit IgG antibody conjugated with Alexa Fluor 594 (1:200 dilution, catalog number: A-21209; Invitrogen, Eugene, ON) and the donkey anti-mouse IgG antibody conjugated with Alexa Fluor 488 (1:200 dilution, catalog number: A-21202; Invitrogen); (2) the donkey anti-rabbit IgG antibody conjugated with Alexa Fluor 594 (1:200 dilution, catalog number: A-21209; Invitrogen) and the donkey anti-goat IgG antibody conjugated with Alexa Fluor 488 (1:200 dilution, catalog number: A-11055; Invitrogen); or (3) the donkey anti-rabbit IgG antibody conjugated with Alexa Fluor 594 (1:200 dilution, catalog number: A-21209; Invitrogen) and the donkey anti-goat IgG antibody conjugated with Alexa Fluor 488 (1:200 dilution, catalog number: A-11055; Invitrogen). After being washed in TBS, sections were counterstained with DAPI (1:1000 dilution, catalog number: MBD0020; Millipore Sigma) for 5 min, then rinsed and mounted with Vectashield mounting medium (catalog number: H-1000; Vector Laboratories). Images were acquired with a fluorescent microscope with a charge-coupled device camera (Olympus DP70, Olympus Corporation, Tokyo, Japan).
In all immunostaining studies, a negative control omitting the incubation with the primary antibody was included. Quantification was performed as follows. Briefly, six sections per mouse in the cerebral cortex area or hippocampus were randomly acquired, and one independent microscopic field in each section was imaged. The areas in the image with intensity above a predetermined threshold level were considered positively stained areas. This measurement was performed by using Image J 1.47n software. The degree of positive immunoreactivity was reflected by the percentage of the positively stained area in the total area of interested structure in the imaged field. All quantitative analyses were performed in a blinded fashion.
ELISA Assay of Cytokines
Interleukin (IL)-1β, IL-6, IL-10 and tumor necrosis factor α (TNFα) levels in the cerebral cortex and hippocampus were determined with Quantikine ELISA kits (R&D Systems, Minneapolis, MN) according to the manufacturer’s instructions. Briefly, brain tissues were homogenized on ice in 20 mM Tris-HCl buffer (pH 7.3) for 30 min. Homogenates were centrifuged at 10,000 g for 10 min at 4 °C. The supernatant was ultra-centrifuged at 150,000 g for 2 h at 4 °C. The supernatant was collected for ELISA. The quantity of IL-1β, IL-6, IL-10, and TNFα in each sample was standardized to its protein contents.
Golgi Staining
Brains were harvested and stained using the FD Rapid Golgi Stain kit (FD Neuro Technologies) [19, 29]. After being immersed in a 1∶1 mixture of FD Solution A∶B for 2 weeks at room temperature in the dark, brains were then transferred to FD Solution C and kept in the dark at 4 °C for 48 h. Solution C was replaced after the first 24 h. Coronal sections of 150 μm thickness were cut with a vibratome (DTK-1500E, DSK Corporation, Pittsburgh) and transferred to gelatin-coated slides (LabScientific) onto small drops of FD Solution C. After allowing sections to dry at room temperature in the dark for at least 4 h or overnight, slides were then stained as described in the FD Rapid Golgi Stain instructions. Permount mounting medium (Fisher) was used for cover-slipping. For each mouse, three independent coronal sections that contained the cerebral cortex and hippocampus (Bregma − 2.5 to − 3.2 mm) were imaged. Secondary and tertiary dendrites of these neurons were selected for analysis. Z-stacks of Golgi-stained dendrites (up to 80 microns in total on Z-axis; optical section thickness at 0.5 μm, i.e., 160 images per stack) were taken at 63x magnification on a Zeiss AxioImager Z2.5. Z-stacks were taken from each mouse. With the freely available RECONSTRUCT software, the images were imported and calibrated before dendritic segment identification and measurement. Spine width measurements made by drawing a straight line across the widest part of the spine head when it was in focus, then scrolling up and down through the Z-stack to get the accurate Z-length of the spines. After the information about the width, length, and length-to-width-ratio (LWR) of the spine was obtained, the spines were classified into different types as the final data. These measurements and analyses were performed as described previously [30, 31].
Electron Microscope
As we described before [32], the hippocampus for electron microscopy was obtained in a coronal plane (1 mm long) and then fixed in a buffer containing 2% (w/v) paraformaldehyde and 2.5% (w/v) glutaraldehyde in 0.1 M PBS at 4 °C for 24 to 36 h. Afterwards, they were post-fixed in 3% (v/v) glutaraldehyde and 1% (w/v) phosphate-buffered osmium tetroxide and embedded in Epon812. The sections were cut at 0.12 μm thickness and stained with 0.2% (w/v) lead citrate and 1% (w/v) uranyl acetate. The sections were subsequently observed under a JEOL 1230 transmission electron microscope (JEOL, USA).
Statistical Analysis
Parametric data in normal distribution were presented as mean ± S.E.M. Non-parametric data or parametric data that were not in normal distribution were presented in box plot. Data from the training sessions of Barnes maze were analyzed by a two-way repeated measures analysis of variance followed by Tukey test. The other data were tested by one-way analysis of variance followed by Tukey test or one-way analysis of variance on rank followed by Tukey test as appropriate. Differences were considered significant at P < 0.05. All statistical analyses were performed with SigmaStat (Systat Software, Inc., Point Richmond, CA).


Comments (0)