
Remember me
Serum concentrations of adalimumab were measured using a validated enzyme-linked immunosorbent assay (ELISA). Briefly, tumor necrosis factor (TNF)-α was coated on a 96-well microtiter plate and the plate was blocked with a blocking buffer to prevent non-specific binding. SB5B was used to prepare calibration standards and quality control (QC) samples. Calibration standards, QC samples, and study samples were undergone 100-fold dilution for MRD and loaded to coated plate. Adalimumab in samples, captured by TNF-α, were measured by a subsequent addition of horseradish peroxidase conjugated anti-human IgG (Fc-specific) and chromogenic substrate (TMB). The concentration of adalimumab was estimated by the calibration standard curve. The validation of the assay followed the guidance of M10 [7].
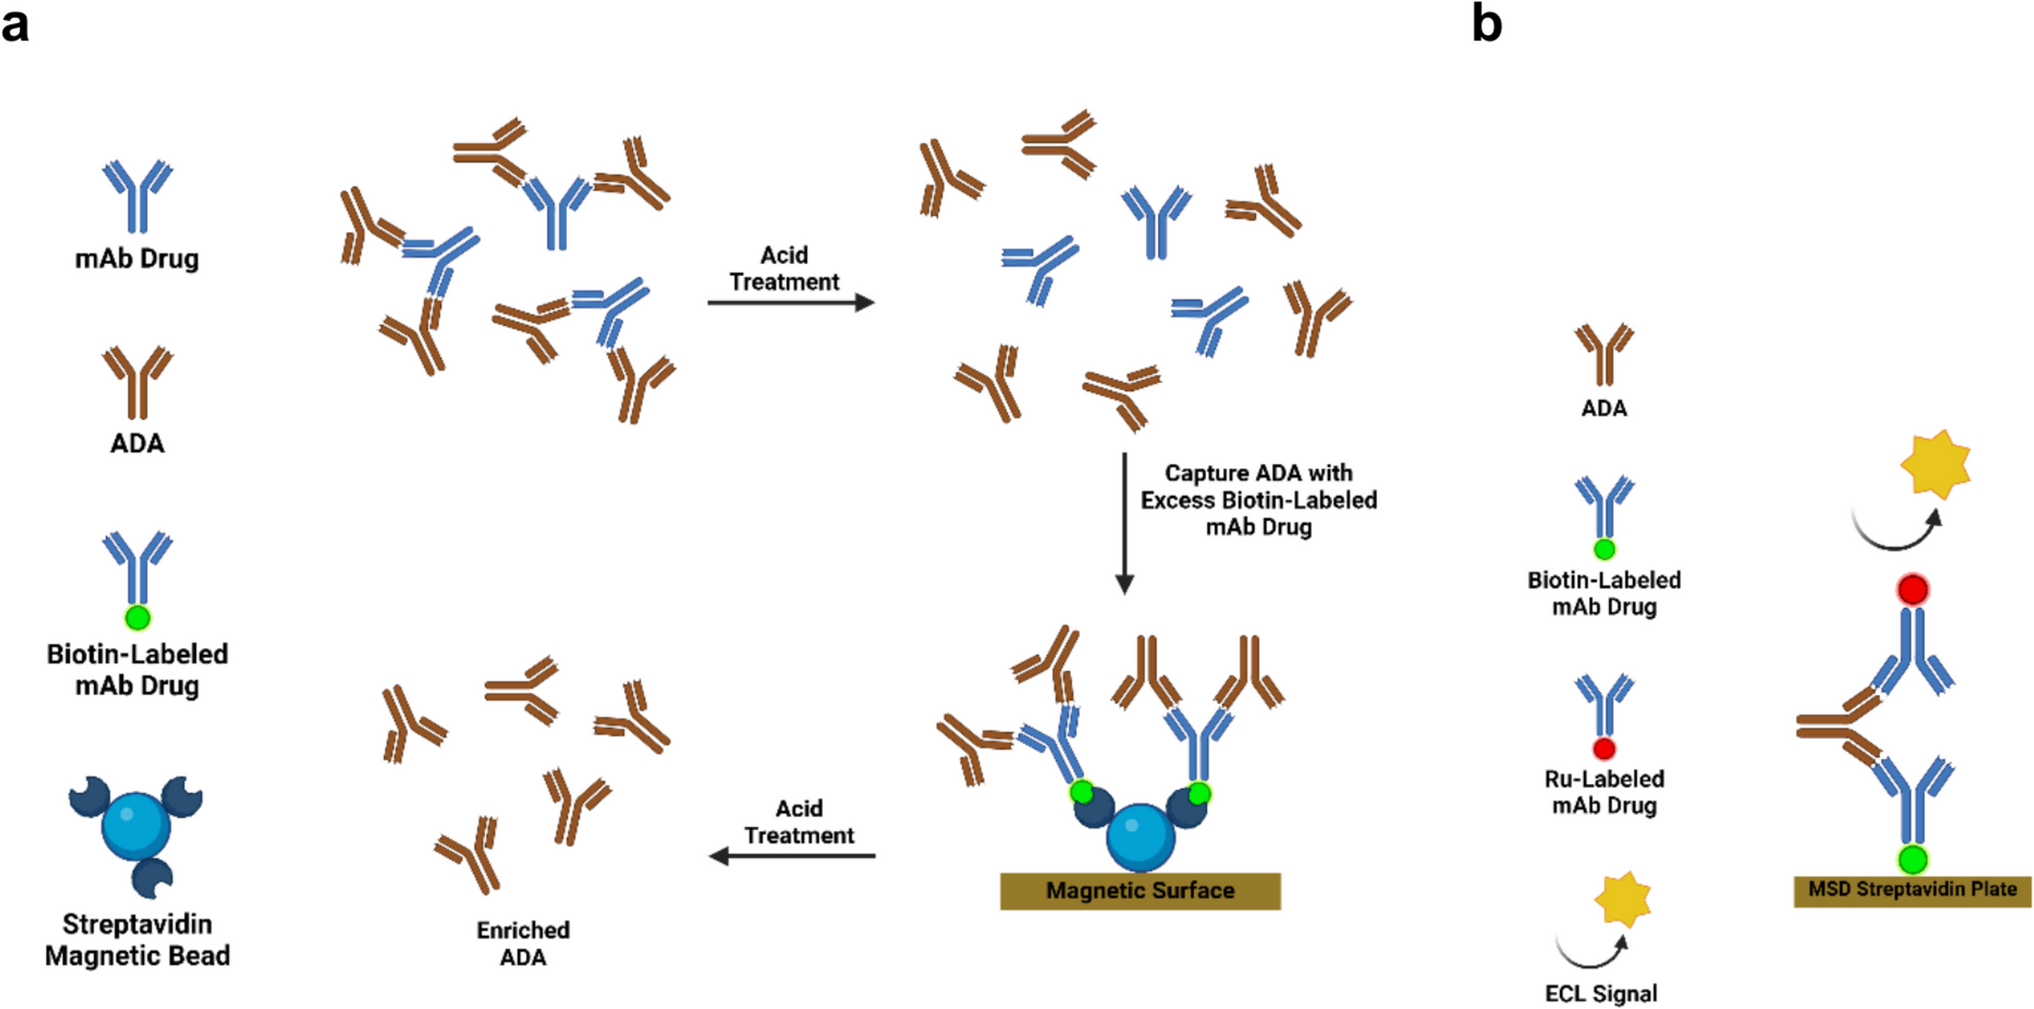
Assays for Anti-adalimumab AntibodiesElectrochemiluminescence (ECL)-bridging immunoassays were used to evaluate binding ADAs. Two different assays were used for ADA sample analyses in SB5-1003 and SB5-4001 studies, respectively (Fig. 1). The validation of the assays followed the guideline from FDA [2].
Fig. 1
Overview of Electrochemiluminescence Bridging Immunogenicity Assay for Detection of Anti-Drug Antibody (ADA). a Schematic Flow of ADA Method Used in SB5-1003 b Schematic Flow of ADA Method Used in SB5-4001
For SB5-1003, all serum samples were first analyzed in a screening assay. The samples were diluted to MRD50, treated with acid and then neutralized with neutralization buffer and bridged with master mix containing biotinylated SB5B, sulfo-tag conjugated SB5B, and TNF blocker. The mixtures were then transferred to specific streptavidin coated carbon electrode plates (MesoScale Discovery, US) so that biotin-SB5B/ADA/sulfo-SB5B complexes can be bound to streptavidin. After incubation, the tripropylamine reagent was added under appropriate voltage stimulation, triggering an oxidation–reduction reaction of ruthenium ions, generating chemiluminescence which is measured using a vendor-specific instrument (Sector Imager, MesoScale Discovery, US). Relative light unit (RLU) intensity is proportional to the amount of ADAs. Samples with signals lower than the screening cut-point were reported as negative, and samples with signals equal to or above the cut-point were further measured in a confirmatory assay.
A confirmatory assay was performed to test ADA-positive samples for the presence of ADAs specific to adalimumab. A sample unspiked, and spiked with excess amount (500 µg/mL) of SB5B in neutralization buffer were analyzed in a plate. If a signal reduction from the unspiked sample over the spiked sample is equal to or above the confirmatory cut-point, the sample is confirmed to be positive for ADAs specific to adalimumab. Otherwise, the sample was considered negative.
The titers of confirmed-positive samples were evaluated in the titer assay. The titer assay follows the same operational setup as the screening assay except that the samples are diluted until a negative response is obtained; titers are determined as the reciprocal of the greatest dilution inclusive of assay MRD resulting positive response equal to or above the titer cut-point.
General procedure of determining sample results from SB5-4001 was identical with SB5-1003 assay. The assay was slightly modified from the assay used for SB5-1003; TNF blocker was removed from the master mix. Only pre-dose samples collected in the study were analyzed in screening assay. Since high ADA incidence was expected based on previous studies [8,9,10,11] and the clinical trial of adalimumab biosimilar product (BI695501) conducted for interchangeability [12], all post-dose samples were initially analysed with a confirmatory assay. A sample unspiked and spiked with excess amount (50 µg/mL) of SB5B in neutralization buffer were analyzed in a plate. Confirmed-positive samples were evaluated in the titer assay.
Clinical Study DesignThe phase I study, SB5-1003, was a randomized, single-blind, two-arm, parallel group, single-dose study, and subjects were randomized to receive either SB5B or SB5A. Blood samples for PK analysis were collected on Day 1 (pre-dose), Day 2, 3, 5, 6, 7, 8, 10, 12, 15, 18, 22, 26, 30, 36, 43, and 57 post-dose. Samples for immunogenicity were collected on Day 1 (pre-dose), 26, and 57 post-dose [11]. Given that all subjects received the same dose of 40 mg adalimumab, the analyses described in this work did not discriminate between the two treatment groups.
The phase IV study, SB5-4001, was randomized, double-blind, parallel-group, active comparator, multicenter interchangeability study, and all entered patients were treated with Humira during a lead-in period of 13 weeks, followed by a randomized 12-week 2-arm switching period from Week 13. SB5B or Humira were administered up to Week 23 and the last assessment was done at Week 29. During 13-week lead-in period, an initial dose of Humira 80 mg at Week 0, followed by 40 mg every other week starting 1 week after initial dose was administered subcutaneously. At Week 13, patients who achieved ≥ 50% improvement of Psoriasis Area and Severity Index (PASI) score from baseline were randomized in 1:1 ratio to either be switched between Humira and SB5B (i.e., switching group) or continue on Humira (i.e., continuous group). Treatment in the switching group consisted of SB5B at Weeks 13 and 15, followed by Humira at Week 17, and then SB5B at Weeks 19, 21, and 23. The patients in the continuous group continued Humira every other week up to Week 23. Immunogenicity was assessed at Day 1 (pre-dose), 36, 64, 92, 120, 134, 162 and 176 post-dose. Due to the complexity of the clinical design, which included various factors that could potentially impact pharmacokinetic outcomes, only data from the continuous group were subjected to analysis.
Determination of S/N Ratio per SampleFor SB5-1003, instrument response of each sample from the screening assay was normalized against the mean response of NCs assayed in the corresponding plate to determine the sample’s screening S/N ratio, while instrument response from undiluted samples from the titer assay was normalized against the mean response of NCs in the corresponding plate to determine titer S/N ratio.
For SB5-4001, screening S/N ratios were substituted with confirmatory S/N ratios since all post-dose samples were first analyzed in a confirmatory assay, calculated using responses from non-inhibited samples and NCs assayed without excess amount of drug in confirmatory assay. Titer S/N ratios were calculated in the same way with SB5-1003.
ADA Values and PK Parameters per SubjectADA values, maximum titer (Titermax) and maximum S/N ratio (S/Nmax), were determined for each subject as indicators of ADA magnitude.
For SB5-1003, AUCinf, AUClast, Cmax and partial AUC at elimination phase from 336 h to 1,344 h (14 to 56 days) (pAUC336−1344 h) were calculated as PK parameters for each subject using the observed adalimumab concentrations [11]. pAUC336−1344 h was not one of the primary endpoints of SB5-1003, but was additionally selected to see the relationship between AUC and the ADA values especially in elimination phase.
For SB5-4001, ADA values were determined in the same manner as SB5-1003. AUCtau was calculated for each subject as a PK parameter.
Statistical AnalysisStatistical analyses were performed using Minitab®21.
The paired data, comprising two different responses (i.e., screening S/N ratios and titer S/N ratios) derived from a single sample, were subjected to correlation analysis using Pearson’s correlation coefficient (r). In addition, orthogonal regression analysis, also known as Deming regression analysis, was performed considering that both responses were measured data containing measurement error. Data were visualized in the form of scatter plots and analyzed using log-transformed values.
In order to ascertain the correlation between S/N ratios and titers, data were presented in form of scatter plots while correlation analyses were conducted using log-transformed values. The correlation between S/N ratios and titers was expressed as Pearson’s correlation coefficient (r), which can range in value from − 1 to + 1. In addition to the correlation analyses, regression analyses were performed to obtain a phenomenological model relating S/N ratios to titers, also using log-transformed values. A coefficient of determination (R2) obtained from the regression analysis was considered as an indirect indicator of the correlation.
In order to assess the correlation between S/N ratios or titers and drug concentrations, the data were visualized in scatter plots and correlation analyses were performed using log-transformed values of S/N ratios or titers and non-transformed drug concentrations. The correlation was indicated as Pearson’s correlation coefficient (r).
In order to assess the correlation between ADA values, such as Titermax and S/Nmax, and PK parameters, such as AUC, Cmax, and etc., the data were visualized in scatter plots and correlation analyses were performed using log-transformed values. The correlation was indicated as Pearson’s correlation coefficient (r).
Analysis of Covariance (ANCOVA) was conducted to evaluate whether the sampling timepoint or the adalimumab level had any effect on the correlation between S/N ratios and titers using log-transformed values. A significance level of 0.05 was used to assess the statistical significance of terms related to the sampling timepoint. As a result of the ANCOVA, a linear regression model was obtained.
Comments (0)