Study design and setting
This is a monocentre study conducted at the two ED’s of the Amsterdam University Medical Centre, a tertiary care centre. A retrospective cohort study design was used. Data were extracted from a prior prospective study that included 800 adult ED patients who arrived by ambulance between March 2021 and October 2021 during the hours of 08:00 to 18:00 [10]. This prior study aimed to investigate if critical illness could be recognized by acute healthcare providers. Reporting adheres to the Transparent Reporting of a multivariable model for Individual Prognosis or Diagnosis (TRIPOD) guidelines for prognostic modeling studies [19]. No additional procedures were performed as part of this study. Ethical approval was received by the Medical Ethical Committee (Waiver: W-19_480 # 19.554).
Patient selection
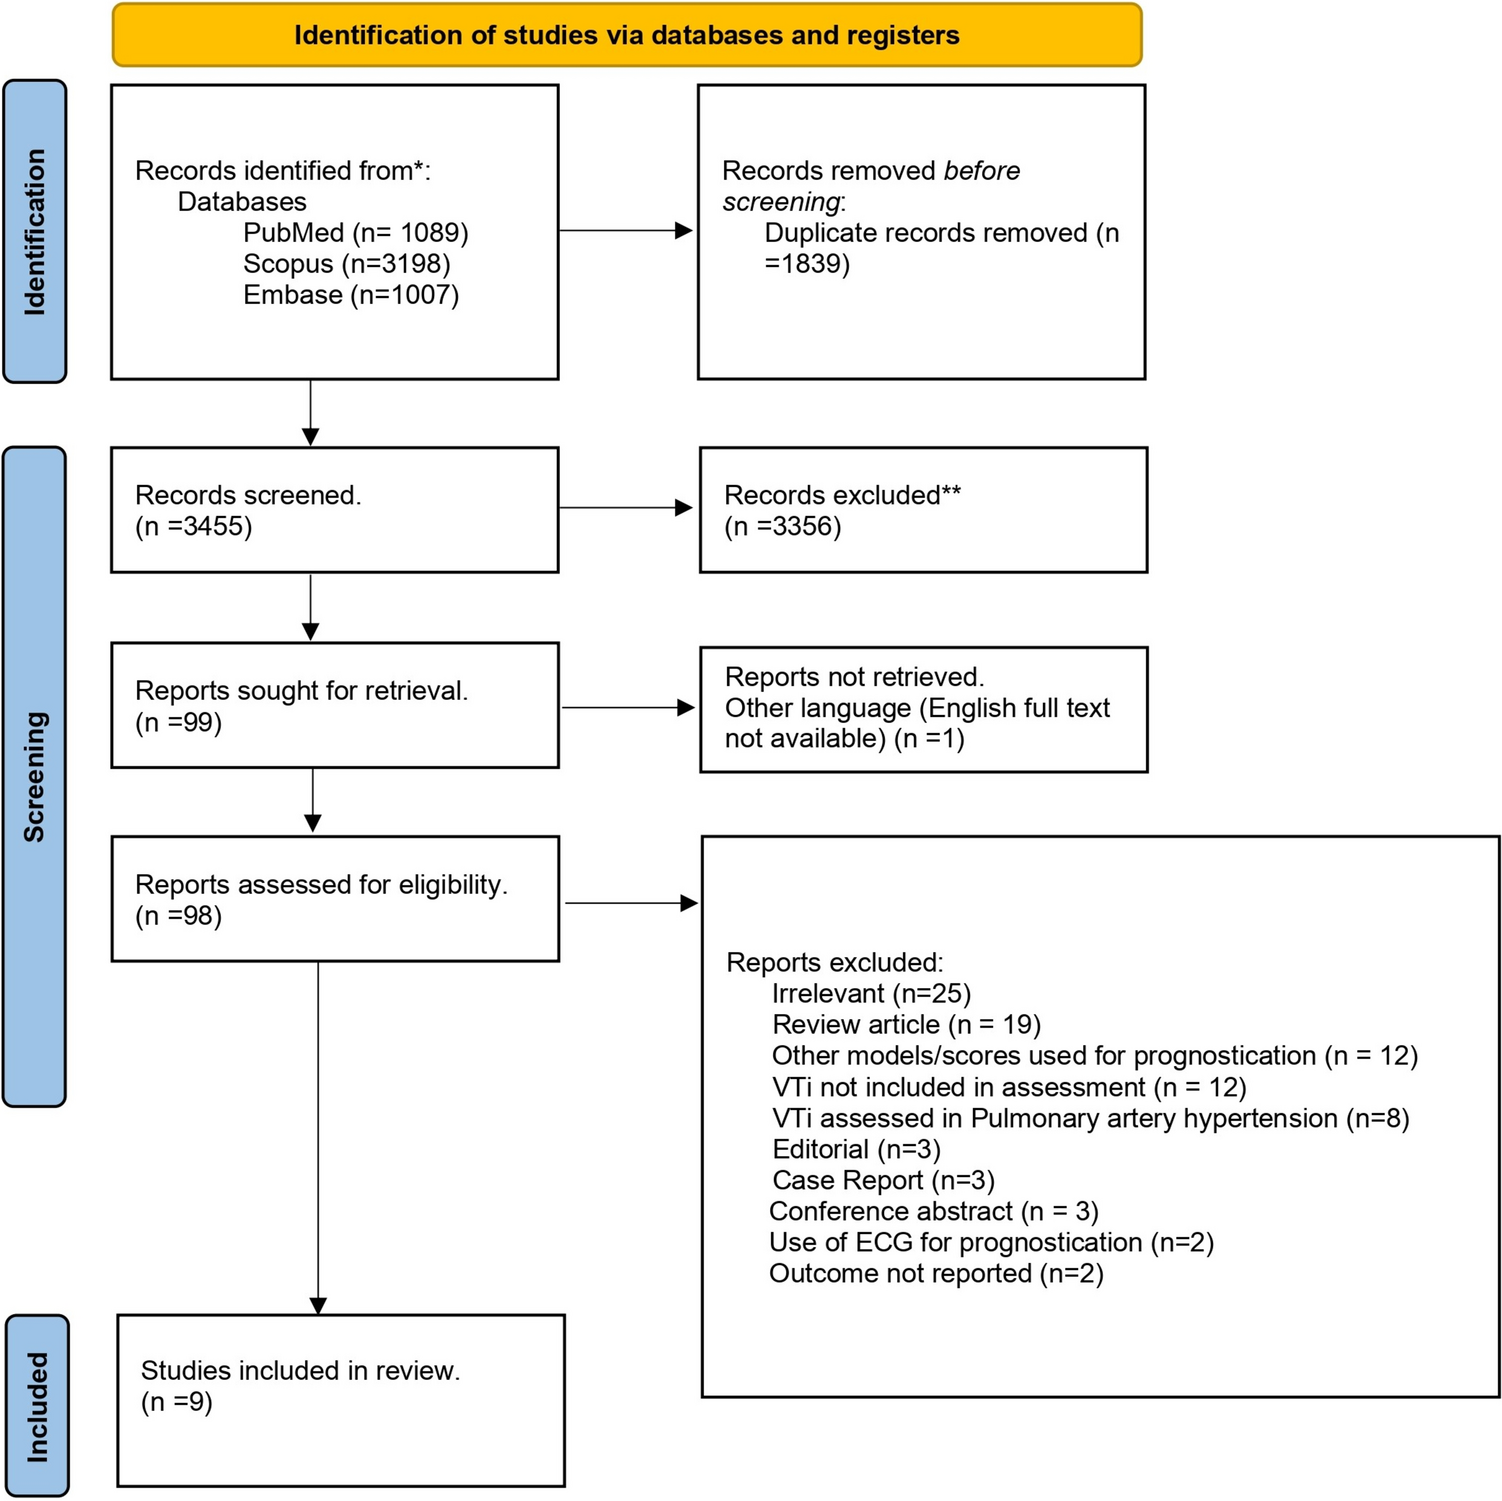
Participants were selected from the existing dataset based on predefined inclusion and exclusion criteria [10]. For these secondary analyses, patients were excluded if they were lost to follow-up (i.e., due to hospital transfers), were palliative care admissions, or if less than three vital signs were recorded by EMS or at arrival to the ED that were needed to calculate the IEWS as these variables were considered missing not at random and could therefore not be imputed. Patients were followed up for 28 days post-ED admission.
Data collection
Collected data included the vital signs which were needed to calculate the IEWS, measured prehospital and at ED presentation. Only one set of vital signs was recorded prehospital and at arrival to the ED. Mortality was recorded at day 28 after admission, or patients were called to confirm whether they were alive or deceased. Other variables obtained were disposition (e.g., admission, hospital transfers), serious adverse events (SAE) including ICU admission, sepsis, myocardial infarction, and frailty scores at arrival to the ED and at day 28. The IEWS aggregates seven vital signs: Respiratory Rate (RR) in breaths/min., Systolic Blood pressure (SBP) mmHg, Heart rate (HR) beats/min, peripheral oxygen saturation (SPO2) %, AVPU score, temperature 0C, supplemental oxygen (yes or no), and age and sex [20]. The IEWS was calculated for each patient with prehospital vital signs and with vital signs at arrival to the ED. Clinical gestalt for severity of illness, rated on a scale from 0 (not ill) to 3 (severely ill), was recorded from paramedics, nurses, and physicians after the handover from the paramedics to ED staff as described previously [10]. For all patients brought by EMS, a nurse was attending the handover. Physicians were only present at handover in case these patients were not send in by a general practitioner (i.e., prehospital emergency calls and major trauma patients). Several variables were collected for use as predictors in the multiple imputation procedure for missing values: Vital signs after 1 h in the ED, 3 h in the ED, at day 1 after admission, blood analyses performed in ED (Urea, lactate, leukocytes), type of ED bay (normal room, shock room, trauma room, acute brain care, acute cardiac care), and patients’ resuscitation policy.
Outcome
Primary outcome was the performance of IEWS, IEWS + frailty, ROX index, and clinical gestalt of healthcare providers in predicting the outcome measures three-day critical illness and 28-day mortality and expressed as calibration and discrimination (area under receiver operating characteristics, AUROC) and net benefit. Critical illness was defined as mortality, ICU admission (direct or indirect), sepsis, or myocardial infarction.
Sample size
The sample size adhered to the rule of thumb for validation of prediction models, requiring a minimum of 100 events and 100 non-events to ensure reliable performance estimates [21]. In the entire dataset, critical illness occurred in 113 patients within 3 days, and 58 patients died within 28 days, providing sufficient events for validating the IEWS.
Data analysis
Descriptive data were presented as mean (standard deviation (SD)) if normally distributed and median (interquartile range (IQR)) if skewed. Statistical outliners were treated as missing.
Prior to the main analyses, we assessed non-linearity of frailty in univariable logistic regression and explored non-linear terms (restricted cubic splines) for best fit. A missing data analysis was performed to evaluate the feasibility of multiple imputation. Missing data in the cohort were substituted by multiple imputation to reduce information bias [22]. Missing gestalt and vital sign data in the IEWS were imputed using the chained equations procedure, incorporating urea, leukocytes, lactate levels, resuscitation bay, resuscitation policy, outcomes, gestalt, and vital signs in-hospital as predictors. Outcomes were imputed if missing. Twenty imputations were performed, each with five iterations, to ensure convergence and collinearity were addressed.
For each imputation set, we calculated the IEWS and the ROX. For each imputed dataset, IEWS, ROX, and clinical gestalt (paramedics, nurses, physicians) were fitted using logistic regression. Because our outcomes (28-day mortality and critical illness) differ from those used in the original IEWS study (in-hospital mortality), and to allow fair comparison with other scores lacking published coefficients, we retained the original point structures but refitted a single overall coefficient for each model to account for case mix differences. We performed a sensitivity analysis using the original IEWS coefficient and intercept.
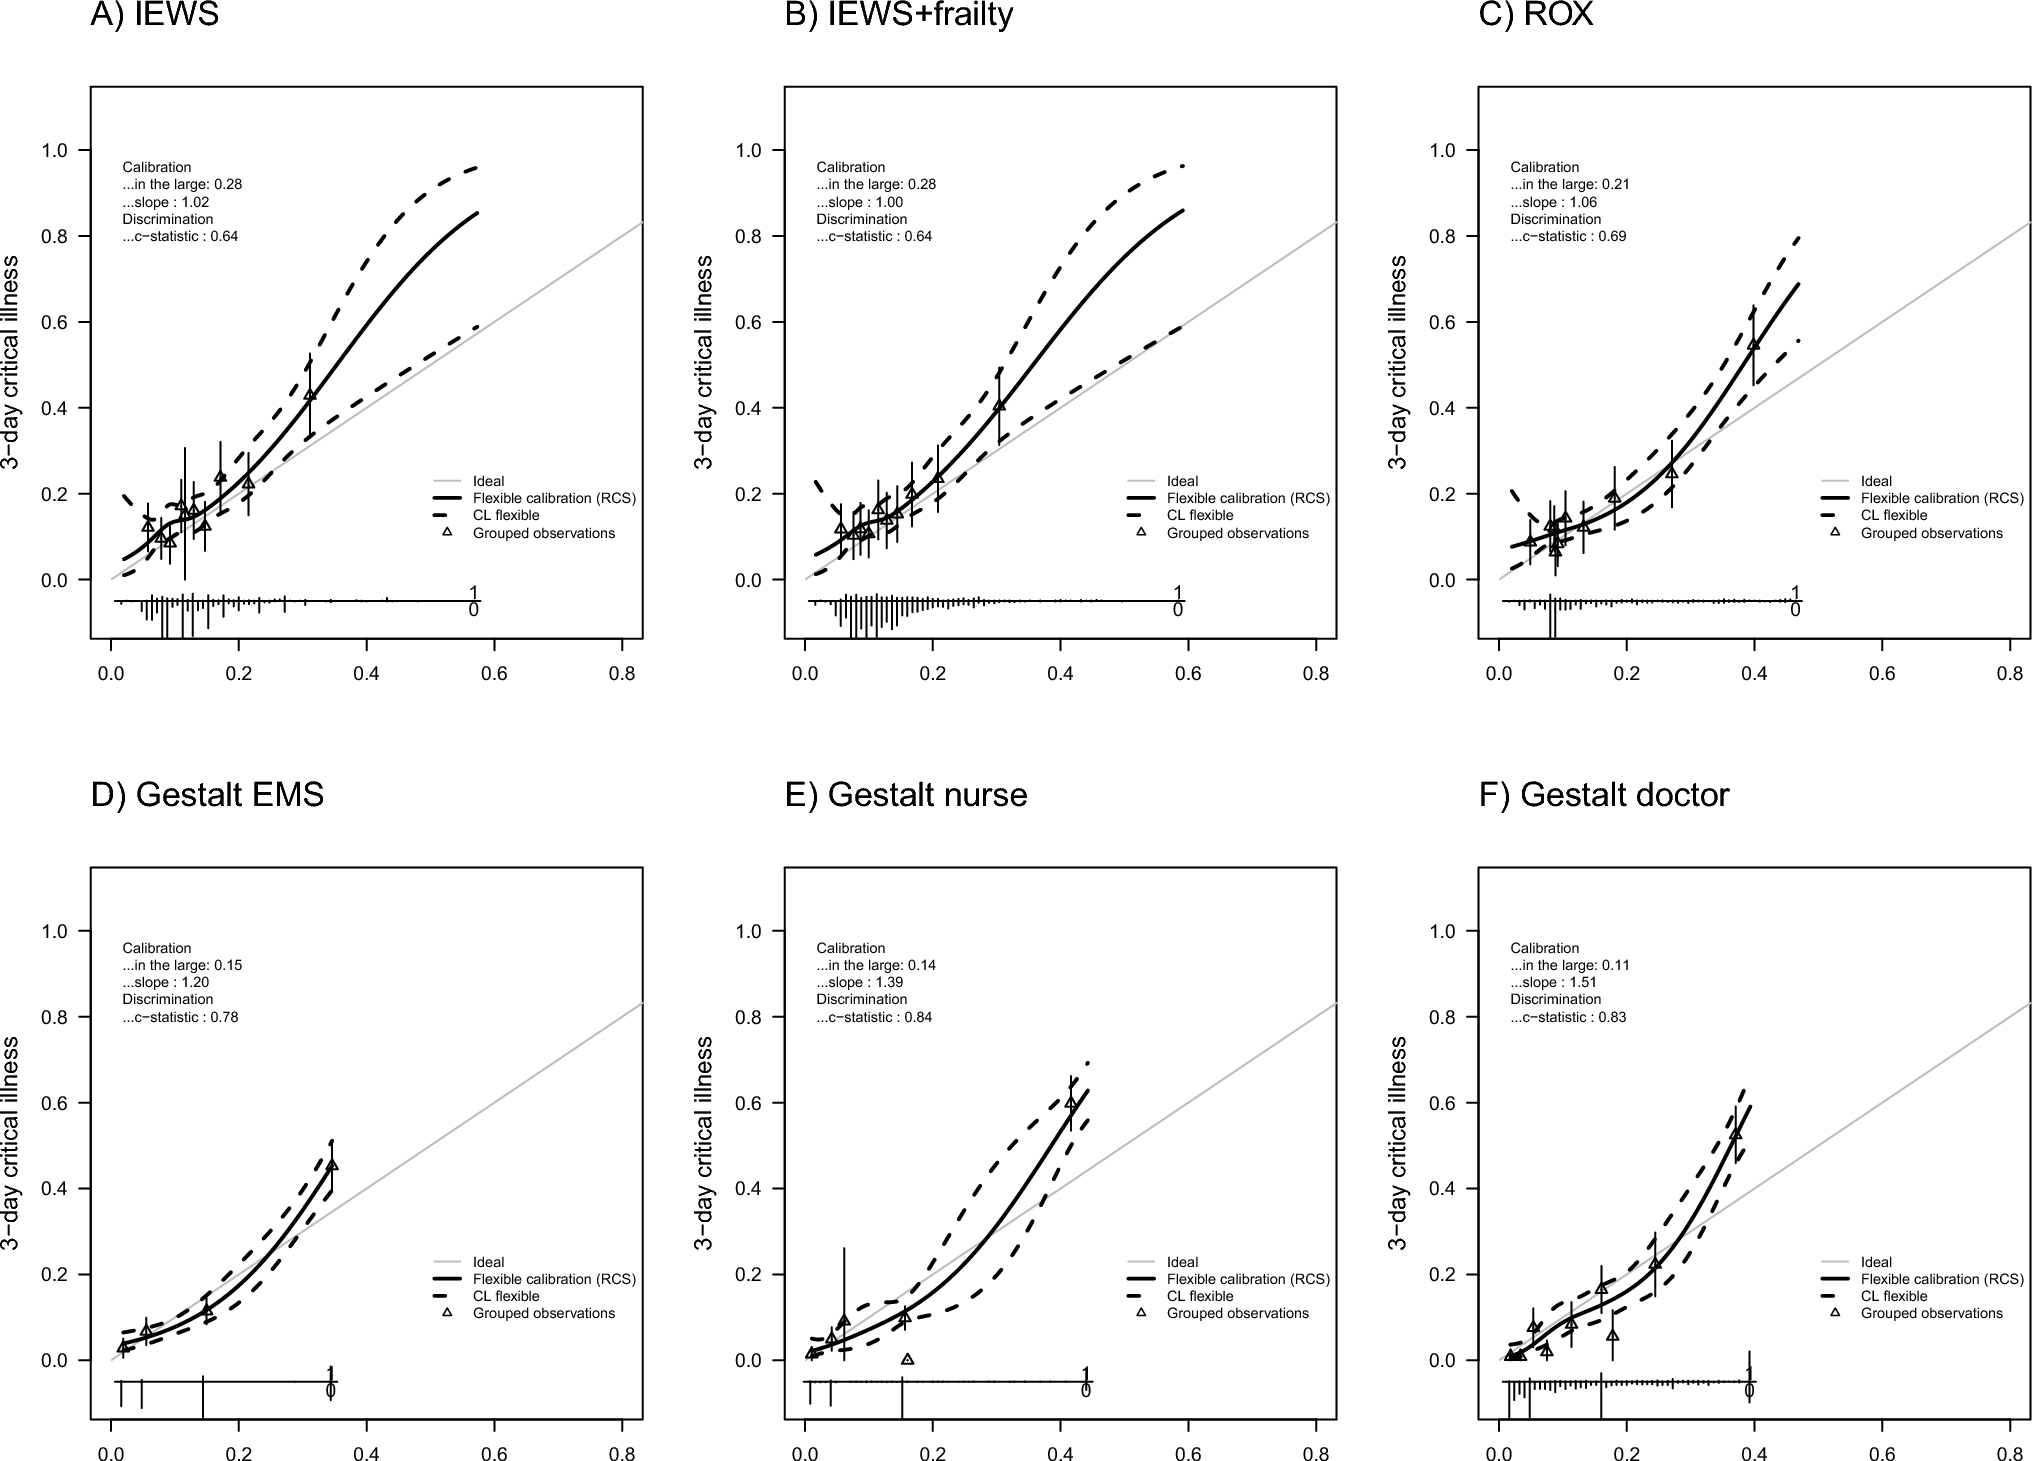
Predictive performance of IEWS, IEWS + frailty, ROX (with prehospital vital signs and vital signs at arrival), and clinical gestalt was evaluated using the area under the receiver operating characteristic curve (AUROC) with 95% confidence intervals. Calibration plots were generated, and regression coefficients and intercepts were averaged across imputations.
Decision curves assessed the net benefit of IEWS compared to NEWS and clinical gestalt across risk thresholds [23]. Models were evaluated and compared based on calibration, discrimination, and clinical utility.
All statistical analyses were conducted using R statistical software packages: dplyr (v1.0.7), rms (v6.2), and mice (v4.5). Statistical significance was set at p < 0.05.
Subgroup analysis
Since many patients were treated in a resuscitation bay or acute care bay, they were already receiving full attention from an experienced physician, making the use of risk stratification tools unlikely to provide additional clinical benefit. Therefore, a subgroup analysis was conducted for patients treated in lower-acuity bays, such as a standard ED room or a cardiac care room. The previously described analyses were repeated for this subgroup. Physician gestalt was not assessed in this analysis as physicians did not listen to the handover for these patients.


Comments (0)