
Remember me


A total of 222 subjects with hypertension were recruited, comprising 106 individuals (47.7%) with a clinical diagnosis of hypertension and 116 individuals (52.3%) diagnosed with hypertension in conjunction with CAD. The baseline characteristics of the study participants are shown in Table 1 (mean age: 65.5 years, males: 68.9%). Obviously, in comparison to the hypertensive group, patients with hypertension and CAD exhibited a significantly higher level of SIRT7 (P < 0.001). Individuals afflicted concurrently with hypertension and CAD were predominantly male, with a higher prevalence of smoking history, hyperlipidemia, and antiplatelet agent usage. In addition, participants with both hypertension and CAD had elevated heart rates along with a marked increase in blood biochemical markers including WBC, NE%, plasma concentrations of ALT, AST, CK, CK-MB, and hs-CRP, as well as decreased HDL-C concentration compared to those with hypertension alone.
Table 1 The clinical baseline characteristics and laboratory data between hypertensive patients with (HTN_CAD) or without CAD (HTN)Correlation between plasma SIRT7 and clinical indicatorsSubsequently, we investigated the relationship between SIRT7 and six conventional risk factors for CAD in hypertensive patients, which included lipid profile parameters (TC, TG, HDL-C and LDL-C) and cardiac enzymes (CK and CK-MB). Remarkably, as depicted in Figure S1, both CK (R = 0.36, P < 0.001, Figure S1A) and CK-MB (R = 0.5, P < 0.001, Figure S1B) revealed a positive correlation with SIRT7 plasma levels. In contrast, HDL-C (R = −0.23, P < 0.001, Figure S1F) demonstrated a negative correlation with plasma SIRT7 levels.
Plasma SIRT7 levels were qualified in distinguishing CAD among hypertensive patientsROC curve analysis indicated that the optimal cutoff threshold for plasma SIRT7 levels in identifying hypertensive patients with concomitant CAD was established at 2.14 ng/mL, achieving a high sensitivity of 94.0% and a specificity of 75.5%, underscoring its potential diagnostic utility. In addition, a comparative assessment of the diagnostic efficacies of SIRT7, CK, CK-MB, and HDL-C—the indicators that demonstrated a significant correlation with SIRT7 as shown in Figure S1—was carried out. As illustrated in Figure S2, SIRT7 exhibited superior diagnostic accuracy (AUC: 0.917, 95% CI 0.882–0.951) for distinguishing hypertension in conjunction with CAD compared to CK (AUC: 0.698, 95% CI 0.629–0.768 P < 0.001), CK-MB (AUC: 0.814, 95% CI 0.750–0.879 P < 0.001) and HDL-C (AUC: 0.674, 95% CI 0.604–0.745 P < 0.001).
SIRT7 is an independent risk factor of CAD among hypertensive patientsInitially, a univariate logistic regression analysis was performed to evaluate the individual effects of variables on CAD among hypertensive patients (Table S1). Univariate logistic regression analysis revealed that factors including male gender, history of smoking, comorbidity of hyperlipidemia, elevated heart rate, high levels of SIRT7, WBC, NE%, hemoglobin, ALT, AST, CK, CK-MB, TC, BUN, hs-CRP, as well as use of antiplatelet agents, were significantly associated with an increase in the risk of CAD among hypertensive patients. However, elevated levels of HDL-C were found to decrease the risk of CAD.
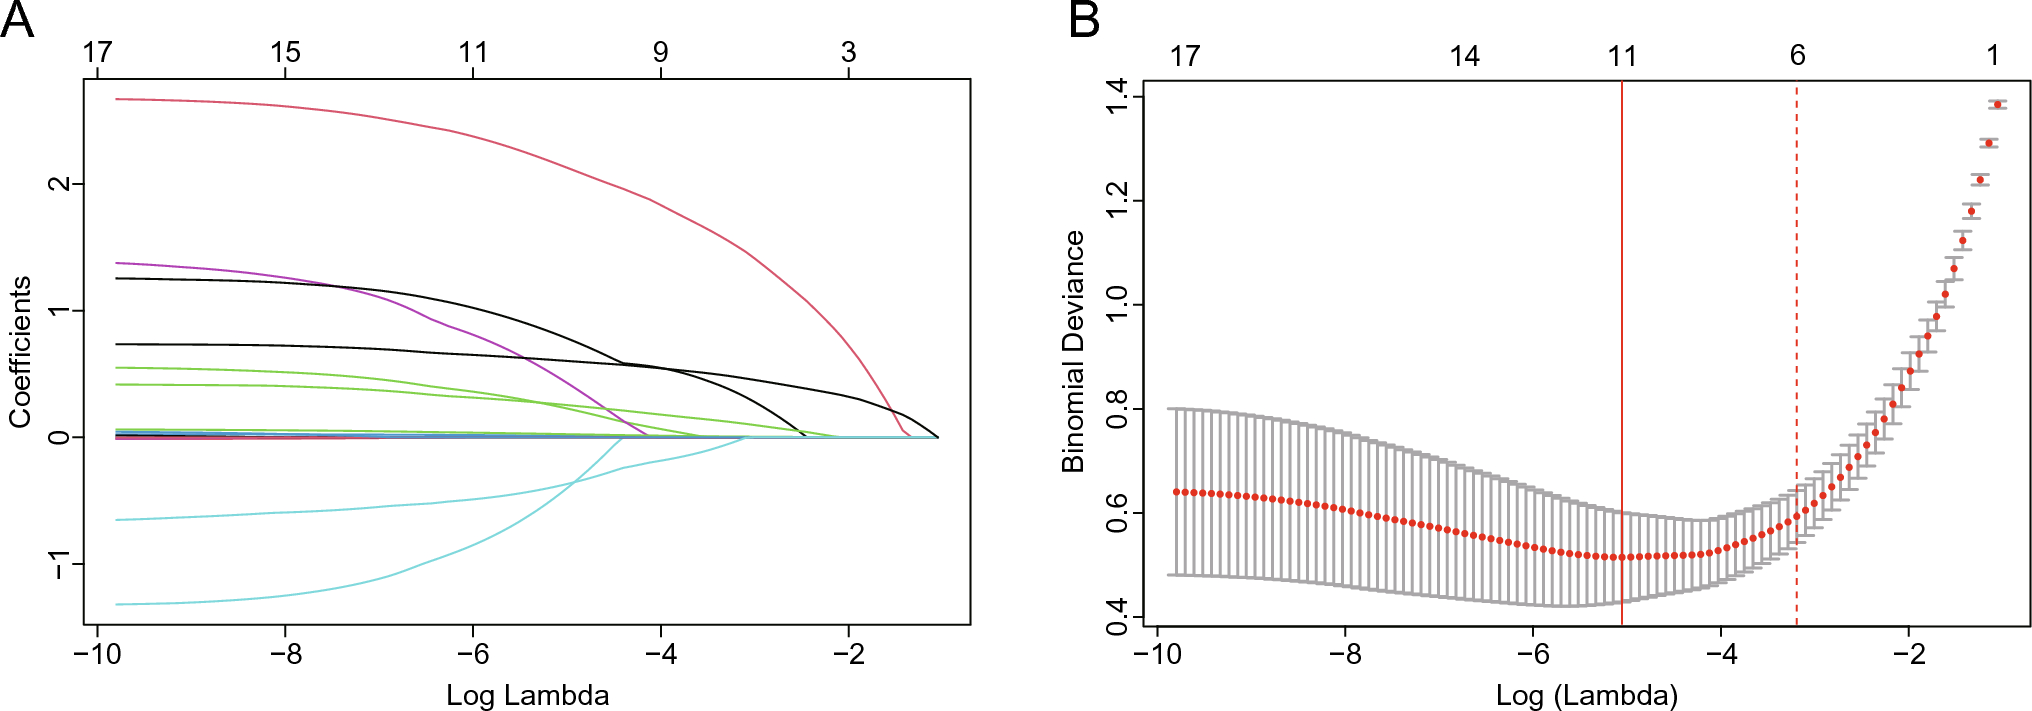
Additionally, we performed the LASSO regression model on all relevant characteristic variables that were identified as statistically significant features in the univariate analysis (Table S1). Among the 17 pertinent characteristic variables, 6 potential predictors were selected through the LASSO regression model (Fig. 1A, B). Finally, four independent predictors of CAD among hypertensive patients were identified by multivariate stepwise logistic regression analysis (Table 2). Notably, after adjustment for WBC, CK-MB levels, and antiplatelet therapy use, each unit increase in SIRT7 was associated with a 97% elevated risk of CAD (adjusted OR: 1.97; 95% CI 1.48–2.63; P < 0.001).
Fig. 1
Variable selection using LASSO regression analysis. A LASSO coefficient profiles of the 17 variables. A coefficient profile plot was produced against the log (lambda) sequence. B A tenfold cross-validation was used in the LASSO regression. Binomial deviance was plotted versus log (lambda). Dotted vertical lines were drawn at the optimal values by utilizing the minimum criteria (left full line) and the 1 standard error criterion (right dotted line)
Table 2 Predictors for the risk of CAD among hypertensive patients through multivariate stepwise logistic regression analysisAssociation of SIRT7 and rehospitalizationDuring the follow-up period, a total of 64 patients experienced rehospitalization. The results of the RCS analysis indicated a correlation between SIRT7 and rehospitalization (P for overall = 0.038), but not a non-linear relationship (P for non-linear = 0.164) (Fig. 2A). Through detailed analysis of the RCS plot, the optimal cutoff value for SIRT7 expression was determined to be 4.155. This threshold has been used to stratify patients into high (≥ 4.155) and low (< 4.155) SIRT7 expression groups for the Kaplan–Meier survival analysis. The Kaplan–Meier curve demonstrated a significant difference in survival probability between high SIRT7 and low SIRT7 groups (log-rank P = 0.007, Fig. 2B). As shown in Table 3, univariate Cox regression analysis revealed that higher SIRT7 levels (HR = 1.23, 95% CI 1.11–1.37, P < 0.001), along with conventional risk factors including type 2 diabetes mellitus (HR = 2.05, 95% CI 1.21–3.27, P = 0.008), AST (HR = 1.31, 95% CI 1.14–1.50, P < 0.001) and CK-MB (HR = 1.48, 95% CI 1.25–1.75, P < 0.001) were significantly associated with rehospitalization. In addition, even after accounting for established risk factors (univariate analysis P < 0.05), plasma SIRT7 retained a significant association with rehospitalization (HR = 1.15, 95% CI 1.02–1.29, P = 0.022), suggesting its potential as an independent predictor for rehospitalization. Strikingly, SIRT7 levels substantially improved rehospitalization prediction over the conventional risk factors, with robust evidence from both discrimination (IDI of 21.8%, P < 0.001) and reclassification (NRI of 51.0%, P < 0.001) metrics.
Fig. 2
Association between SIRT7 expression levels and rehospitalization during follow-up. A Dose–response relationship of SIRT7 with HR for rehospitalization, analyzed using restricted cubic splines. The adjusted HRs (red lines) and 95% confidence intervals (dashed lines). Overall P-value = 0.038, non-linear P-value = 0.164. Reference SIRT7 value = 4.155 ng/mL. B Kaplan–Meier survival curves comparing survival probability in patients grouped by Low- and High-SIRT7 expression. The log-rank test showed a significant survival difference (P = 0.007). Number at risk at each time point is shown in the table below the plot
Table 3 Univariate and multivariate Cox analysis for prediction of the all-cause hospital readmission
Comments (0)