
Remember me


We prospectively enrolled patients referred for clinically indicated isolated CABG at our hospital from August 2016 to July 2019. Patients were consecutively included regardless of the quality of their echocardiographic images. Exclusion criteria were as follows: any other concomitant surgery (such as repair or replacement of the heart valves or great vessels, congenital heart disease repair, pericardiectomy, and permanent pacemaker placement), premature ventricular contractions, and history of atrial fibrillation. In addition, we excluded non-co-operative patients and patients who refused to participate. In total, 190 patients (mean age: 61.7 ± 7.9 years; women: 29 patients) were enrolled in the study.
The authors are accountable for all aspects of the work in ensuring that questions related to the accuracy or integrity of any part of the work are appropriately investigated and resolved. The trial was conducted in accordance with the Declaration of Helsinki (as revised in 2013). The study was approved by the China Medical University Ethics Committee and informed consent was taken from all individual participants.
Clinical assessment and follow-up protocolClinical parameters such as sociodemographic variables (age, sex, and body mass index), medical history (smoking, hypertension, diabetes mellitus, hyperlipidemia, New York Heart Association [NYHA] functional class, and SYNTAX score), medication history, and laboratory values of all patients were comprehensively evaluated before CABG. The Society of Thoracic Surgeons (STS) score (https://riskcalc.sts.org/stswebriskcalc/calculate) and EuroSCORE II (http://www.euroscore.org/calc.html) were calculated using available online calculators based on the collected data.
All patients were followed up every 6 months by a review of electronic records and/or telephone interview. The primary outcome was the occurrence of long-term major adverse cardiovascular and cerebrovascular events (MACCEs) from the time of cardiac surgery to the end of follow-up. MACCE was defined as the composite of all-cause death, myocardial infarction, repeat revascularization, stroke, and readmission for heart failure. In the case of more than one event, the first event was analyzed. Myocardial infarction was diagnosed according to the fourth universal definition of myocardial infarction [8]. Stroke was defined based on the clinical documentation and imaging findings. Heart failure was diagnosed according to the Framingham criteria and only heart failure requiring readmission was considered an event [9]. Clinical events were ascertained by a blinded cardiologist.
EchocardiographyEchocardiographic examinationA standard comprehensive echocardiographic examination was performed by qualified sonographers 3 days before CABG using the EPIQ system (version 7 C, Philips Medical Systems, Andover, MA, USA) equipped with an X5-1 phased-array transducer. The frame rate of grayscale images was maintained at a level > 60 frames/sec. Echocardiographic measurements were performed according to the recommendations of the American Society of Echocardiography (ASE) by two experienced physicians with over ten years of working experience (Y.H.W. and C.T.Z.) [10,11,12]. The LV ejection fraction, global longitudinal strain (GLS), and wall motion score index were measured to assess LV global and regional systolic functions. Decreased LV GLS was defined as the absolute value of GLS being less than 20%. The LA volume index, early diastolic mitral flow velocity (E), late diastolic flow velocity (A), septal and lateral early diastolic annular velocity (e’), and tricuspid regurgitation velocity were measured; thereafter, mitral E/A and average E/e’ were calculated. LV diastolic function was assessed according to the algorithm recommended by ASE [13].
Meanwhile, the LA maximal volume (Volmax) was measured at the onset of mitral valve opening and minimal volume (Volmin) was measured at the onset of mitral valve closure. Thereafter, the LA emptying fraction (LAEF) was calculated as (Volmax − Volmin) / Volmax × 100. LA strain was measured from the same non-foreshortened LA focused apical four-chamber view using two different measurement methods: conventional manual analysis (Philips, QLAB 13.0, aCMQ) and novel semi-automated analysis (Philips, QLAB 13.0 integrated with TomTec, AutoStrain). In each case, LA strain was measured by an investigator who was blinded to the clinical data, outcomes, and other echocardiographic results.
LA strain measurement using manual methodLA strain was manually measured by conventional two-dimensional speckle-tracking echocardiography using the aCMQ package in QLAB 13.0 software system (Philips Medical Systems, Andover, Massachusetts). The measurement was performed by an experienced operator in accordance with the consensus document of the EACVI/ASE/Industry Task Force for the standardization of LA deformation imaging [14]. Briefly, the investigator manually traced the LA endocardial border; thereafter, the software automatically tracked the LA myocardial speckle throughout the cardiac cycle and generated the strain–time curve. LA strains during the reservoir, conduit, and contraction phases were defined as LASr, LAScd, and LASct. LASr was calculated as difference of LA strain between onset of filling and end-diastole; LAScd was calculated as difference of LA strain between onset of atrial contraction and onset of filling; and LASct was calculated as difference of LA strain between end-diastole and onset of atrial filling. LASr, LAScd, and LASct with end-diastole as the zero reference (edLASr, edLAScd, and edLASct) were obtained and recorded according to the consensus document.
The tracking quality was assessed by visually comparing the tracking border and the underlying atrial wall. If more than one-third of the atrial contour presented drop-outs in visual assessment, the tracking quality was considered poor; otherwise, the tracking quality was considered good [14].
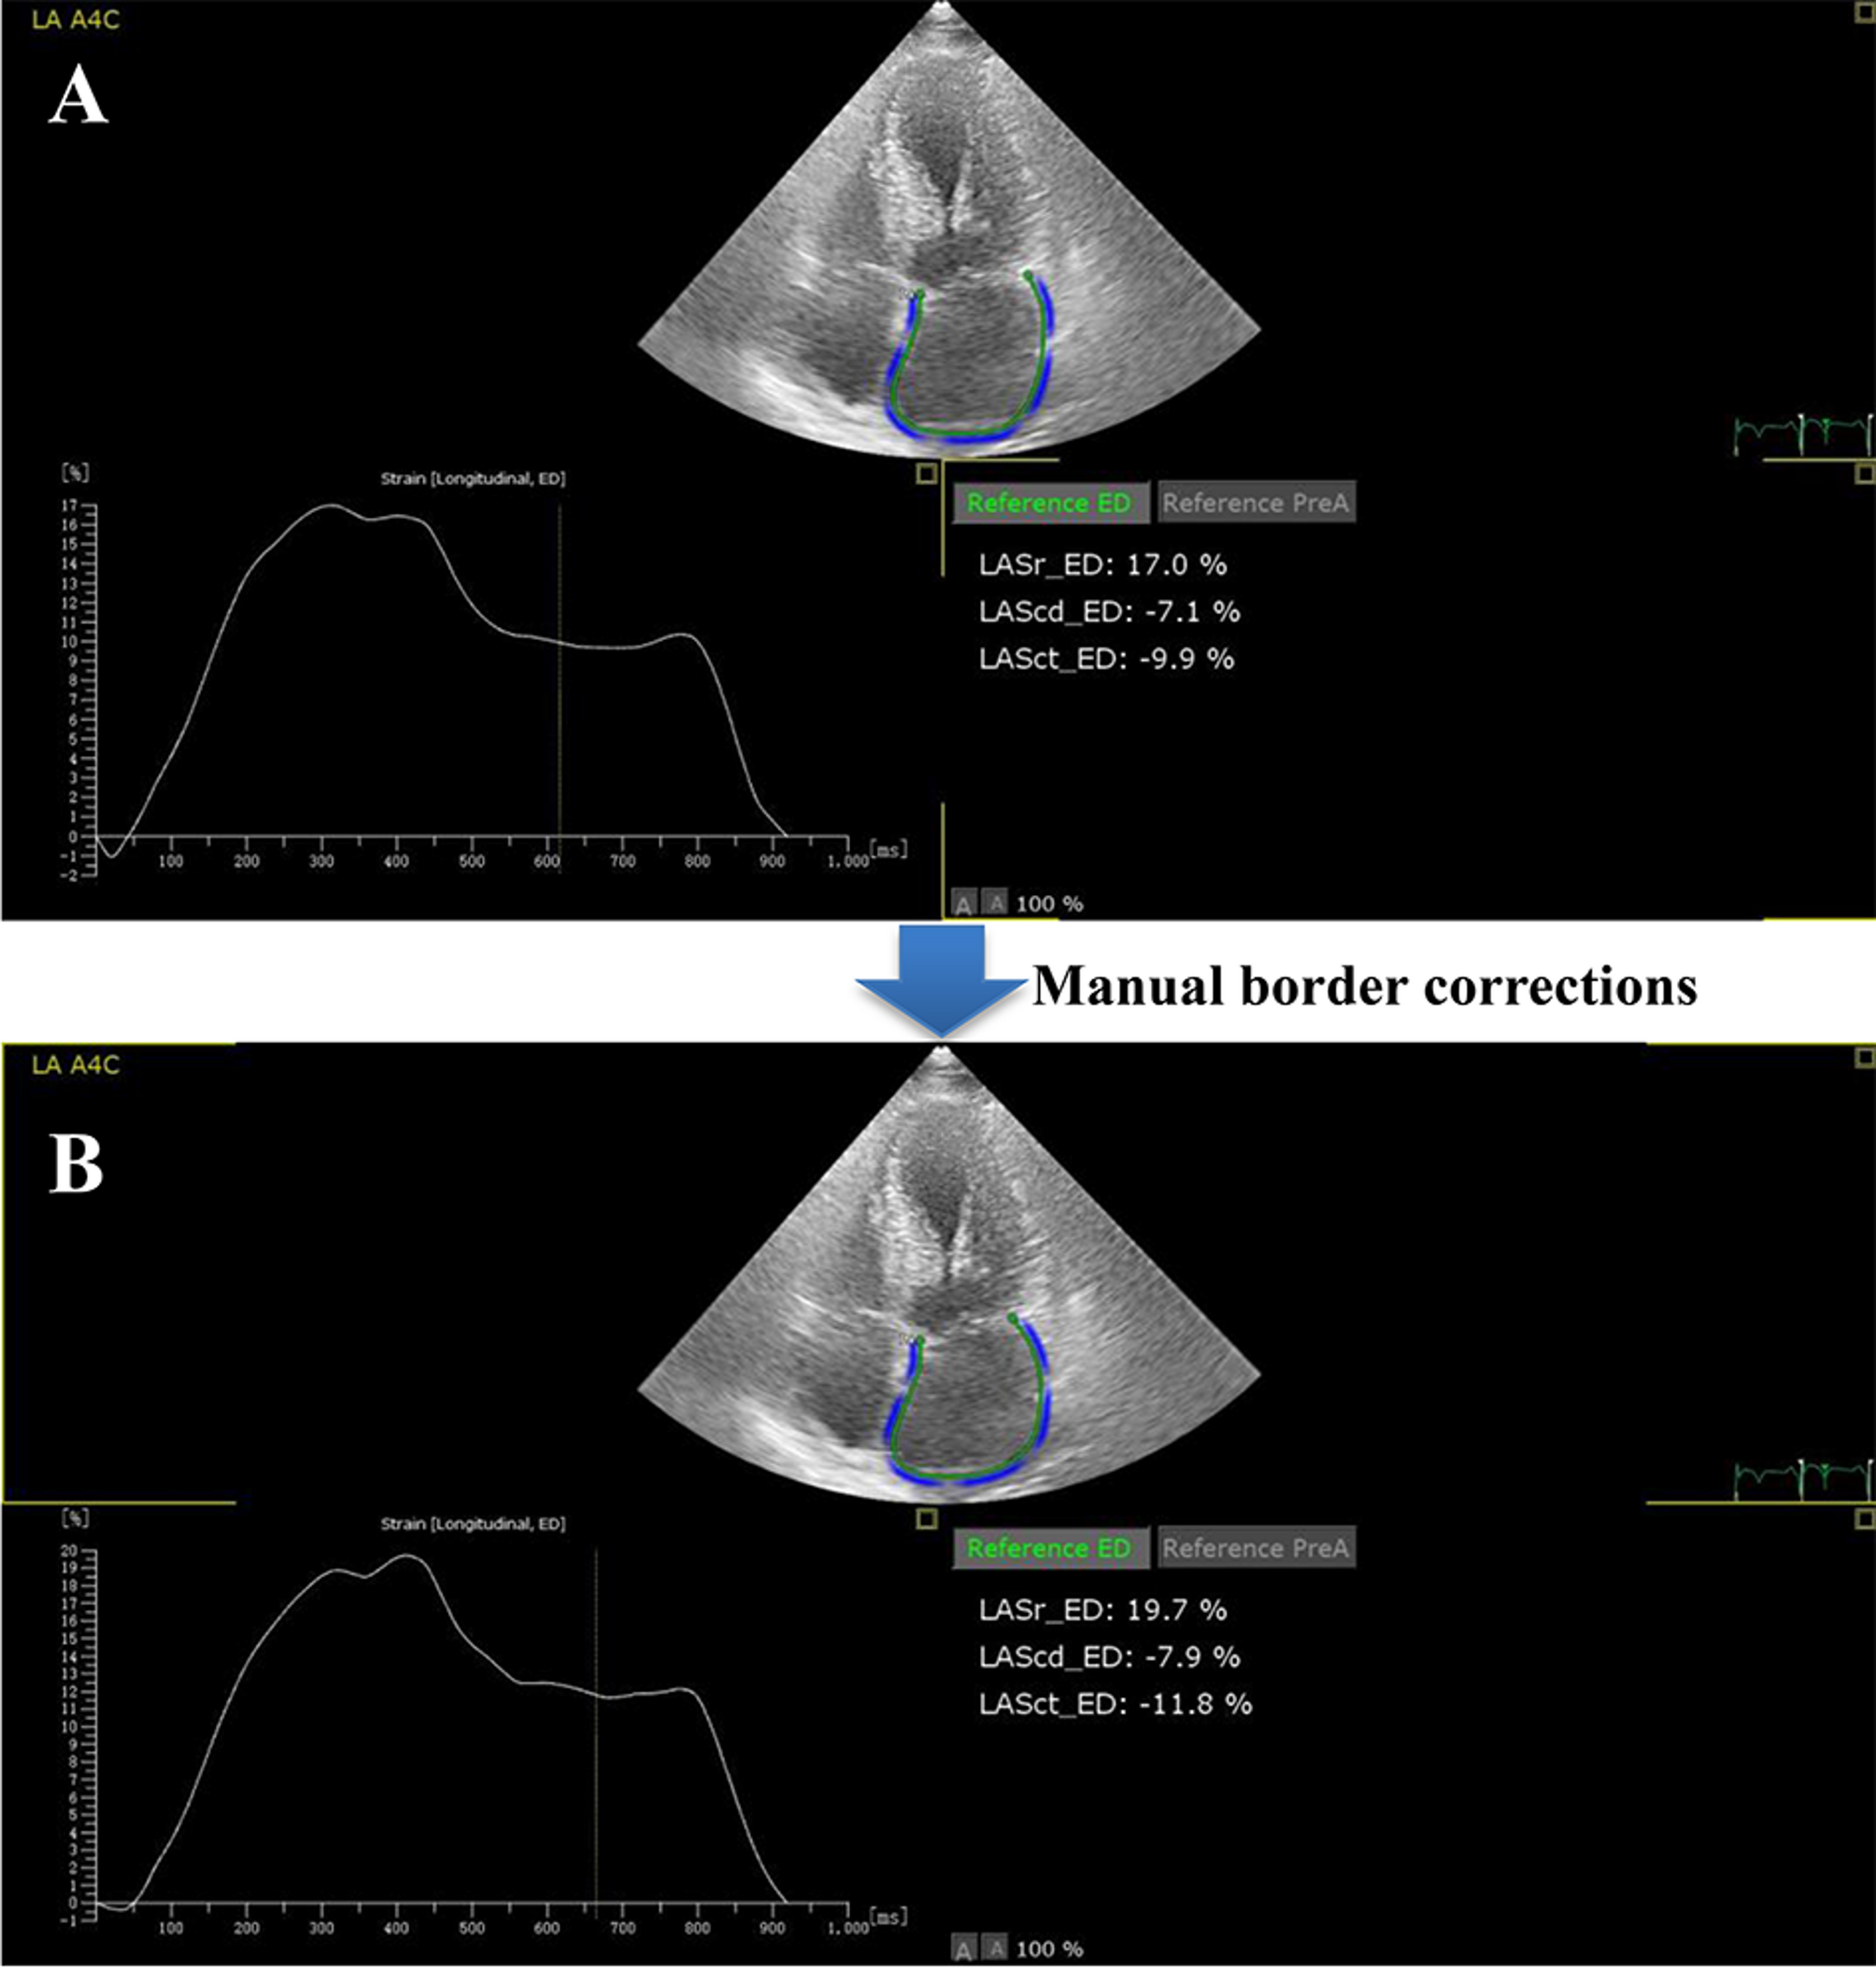
LA strain measurement using automated methodLA strain was measured by the automated method using the AutoStrain package in QLAB 13.0 software system integrated with TomTec Imaging Systems (Philips Medical Systems, Andover, Massachusetts) by an investigator who was blinded to the results of manual assessment. The investigator selected the same apical four-chamber view on the workspace and performed LA strain analysis. The software automatically detected and tracked the LA endocardial border and computed LA strain without investigator interference. After the automatic calculation of LA strain, manual correction of LA endocardial borders was performed if the automatic detection of border was found to be suboptimal (Fig. 1). In addition to edLASr, edLAScd, and edLASct, LASr, LAScd, and LASct with atrial contraction as a zero reference (acLASr, acLAScd, and acLASct) were automatically calculated.
Fig. 1
Representative case of automated assessment for LA strain. (A) In the top image, LA endocardial border was automatically detected and tracked. Simultaneous, LA strain–time curve was showed in the bottom left image, and LA strains during the reservoir, conduit, and contraction phases with end-diastole as the zero reference (LASr_ED, LAScd_ED, and LASct_ED) was displayed in the bottom right image. (B) With the manual correction of suboptimal LA endocardial borders of the lateral LA, LA strain values were recalculated and displayed
For simplicity, the absolute values of LA strain obtained using both manual and automated methods were used for data analysis, i.e., myocardial shortening was not expressed by negative signs of strain.
Measurement time of LA strainWe recorded the time required to measure LA strain for both the methods in a subset of 60 randomly selected individuals from the study population. The measurement time included the time required for view selection, strain computation, parameter recording, and the time of manual correction (if necessary).
Intra- and inter-observer measurement variabilityInter- and intra-observer variability in LA strain measurement was assessed using the data of the aforementioned subset of 60 patients. To assess intra-observer variability, the same investigator performed the same measurements using the same images at different time points with an interval of at least 4 weeks; moreover, the investigator was blinded to the first measurement. To assess inter-observer variability, two investigators independently performed the measurements twice; both investigators were blinded to each others’ findings.
Statistical analysisContinuous data are expressed as mean ± standard deviation or median (interquartile range), and categorical data are expressed as frequency (percentage). Normality plots were obtained using the Shapiro–Wilk test. The LA strain value and corresponding measurement time obtained using the manual and automated methods were compared using paired samples t-test or Wilcoxon test, as appropriate. Correlations were determined using least-squares linear regression analysis. Receiver operating characteristic analysis was performed to estimate the predictive value of LA strain for LV diastolic dysfunction. The predictive power of LA strain is expressed as the area under the curve (AUC). The intra- and inter-observer measurement variability were evaluated by calculating the bias and limits of agreement using the Bland–Altman analysis and by calculating the intra-class correlation coefficient (ICC) and 95% confidence interval (CI) using a two-way random-effects model. The Harrell concordance index (C-index) was used to quantify the predictive power of LA strain for long-term cardiac events and the optimal stratification threshold was evaluated using the X-tile software [15].
All statistical analyses were performed using the SPSS software (version 26.0; IBM Corp, Armonk, NY, USA) and R version 4.1.1 (R Foundation for Statistical Computing, Vienna, Austria; https://www.r-project.org). A P-value of < 0.05 was considered statistically significant.
Comments (0)