
Remember me

This study found a prevalence of EBM of 4.3% with a Z-score cutoff of ≥ 2.5 and 0.6% with a cutoff of Z ≥ 4.0. In comparison, two studies from France that used a Z-score cutoff of ≥ 4.0 reported EBM prevalence of 1.26% and 1.43% [4, 6]. A Canadian study defined EBM in women aged ≥ 50 years using T-score ≥ 2.5 or Z-score ≥ 2.0, but the criteria identified different populations, with hip Z-score ≥ 2.0 identifying 5.6% and hip T-score ≥ 2.5 only 0.3% [7]. The different prevalence of EBM with a Z-score ≥ 2.5 or Z-score ≥ 4.0 across clinical trials may be attributed to several factors, including variations in the gender and age composition of the participants, ethical differences, the use of multiple Z-scores instead of a single Z-score, or the application of different classification criteria.
Our study found that some participants who met the previous EBM criteria may also qualify for a diagnosis of osteoporosis or osteopenia. Previous studies established thresholds of T-scores or Z-scores ≥ + 4.0 or + 2.5 at the lumbar spine, neck, or hip to detect EBM [4, 6,7,8]. However, these criteria did not exclude individuals with T- or Z-scores below −1.0 at any site such as the lumbar spine, femoral neck, or total hip — individuals who could be diagnosed with osteopenia or osteoporosis according to current WHO standards [4, 6,7,8]. Our study found that individuals who fulfill the EBM criteria may also be diagnosed with osteoporosis or osteopenia according to the WHO criteria (Fig. 6). To counteract this, our EBM criteria explicitly exclude individuals with high Z-scores who have also been diagnosed with osteoporosis or osteopenia according to the WHO criteria. Most clinicians who read DEXA reports are doctors treating osteoporosis and primarily rely on T-scores, often overlooking high Z-scores, especially in men over 50 years old and women in menopause. Our modified EBM criteria will encourage clinicians to consider both T-scores and Z-scores on DEXA reports, thereby bridging the research areas of clinicians focused on either osteoporosis or EBM.
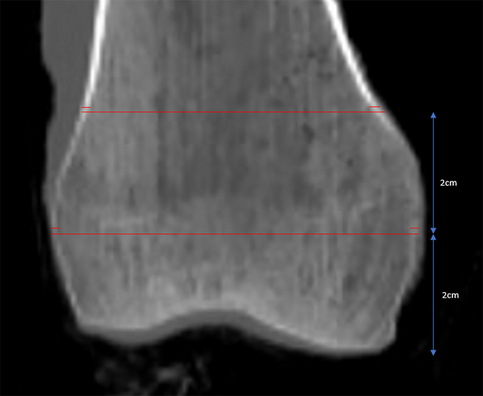
Fig. 6
Case Report: DEXA of an 82-year-old woman meeting both WHO T-score criteria for osteoporosis and EBM criteria based on Z-score
In our study, the average age of EBM subjects is 59.7 years and the age of SEBM is higher than that of MEBM. Contrary to the general assumption that EBM individuals are typically young, our data are consistent with previous studies showing that people with EBM are predominantly older rather than young adults. A study from France found that 55% of EBM individuals were aged 60 years or older [4]. A UK study also reported the average age of EBM to be 64.5 years [11]. For example, these causes account for the majority of EBM cases (80%), with LDD being the most common at 65% of older people [4]. Second, in agreement with previous studies [4, 6, 11], we used Z-scores to classify EBM. The Z-score compares a person's bone density with the expected average for their age, sex and height, while the T-score compares bone density with that of a young, healthy adult of the same sex. The aim was to find out why people with EBM have a higher bone mass than their peers. Ultimately, the majority of individuals who underwent DEXA measurements were generally older, and only a small proportion of younger individuals had DEXA measurements.
Our study showed that people in the SEBM group had a higher proportion of men and a higher BMI (with more people being overweight or obese) than those in the MEBM group. In contrast, studies from France showed that women predominated in the EBM population, at 64% or 56% depending on the study [4, 6]. A British study reported that 78.9% of people with EBM were women [11]. One possible explanation for this is that more women than men undergo DEXA screening for osteoporosis. Secondly, the selection criteria for EBM were different among studies. Thirdly, ethnic differences could also contribute, although no specific ethnic variations have been identified in previous studies [4, 7]. Finally, in our study, the percentage of obese individuals was low at 8.7%, whereas in the EBM population in France the obesity rate ranged from 41 to 44% [4, 6] and in the UK it was 31.0% [11].
The SEBM group showed abnormal patterns, as Z-scores showed a negative correlation with BMI and no correlation with age. In addition, the L1-4 T-score was negatively correlated with the neck T-score. Numerous clinical trials have demonstrated the association between bone loss and advancing age [21, 22]. A cross-sectional study using the NHANES concluded that BMD is positively correlated with BMI [23], which may be attributed to the greater mechanical stress of body weight influencing bone formation through biomechanical overload [24, 25]. The abnormal patterns observed in the SEBM group may be attributed to the increased proportion of DISH, which typically affects lumbar T or Z values. Previous studies have confirmed that factors such as DISH and LDD, which contribute to osteophytic hyperplasia, may lead to increased BMD [26,27,28]. In conclusion, the high prevalence of DISH in the SEBM group likely affected BMD measurements.
Our DTM model identified three factors that may lead to SEBM: DISH with severe LDD, non-DISH with a BMI ≥ 29.5, and diabetic non-DISH patients with a BMI between 24.4 and 29.5. Previous studies have suggested that obesity may act as a mediator and influence both diabetes and increased BMD [29]. DISH is typically associated with older age, male gender, obesity, hypertension, and diabetes mellitus [30]. Previous research has shown that obese people are more likely to develop DISH at a young age, before the age of 50 [31]. DISH primarily affects the lower thoracic spine, but can also extend to the lumbar spine and increase the risk of LDD [32]. Our findings highlight the complex interplay between metabolic disorders and skeletal health and suggest that identifying SEBM may improve our understanding of these risks and guide our interventions.
In our study, we use the term EBM to categorize the population with high Z-scores on DEXA reports. The term HBM is usually linked to genetic mutations, especially in genes like SOST, LRP5 or LRP6 [10, 33, 34]. Giammarco De Mattia's case report on LRP5 high bone mass highlights the distinction between HBM as a category of disorders and EBM as a phenomenon detected through imaging techniques like DEXA [35]. Additionally, two studies in France specifically identified individuals with EBM by DEXA and classified them as EBM [4, 6]. Consequently, while EBM is associated with increased BMD on DEXA, HBM specifically refers to conditions, such as those resulting from genetic mutations.
This study provides several clinical recommendations. First, we recommend that DEXA reports incorporate specific criteria for EBM, rather than simply labeling BMD as normal, to prevent important underlying conditions from being missed. Second, we support clinicians in reconsidering the WHO criteria for BMD ≥ −1.0 as normal in clinical practice, as a BMD T-score ≥ −1.0 is not necessarily normal. We suggest that individuals with a BMD T-score ≥ −1.0 and a Z-score < 2.5 should be classified as NBM, as this population does not fall under the categories of osteoporosis, osteopenia, or EBM. Third, EBM should serve as a red flag for clinicians, as it often indicates potential underlying conditions such as artefactual causes [36] (e.g., factors affecting DEXA measurements such as DISH, AS, or LDD), malignancy, genetic diseases, chronic kidney disease, and many other conditions. However, we believe that EBM presents a much more intriguing and counterintuitive research trend, especially in the context of osteoporosis or osteomalacia, as well as genetic osteomalacia. Additionally, the most frequent causes of EBM, such as DISH and LDD, varied across older, middle-aged, and younger groups in our study. This suggests that future EBM classification criteria should be more specific and adapted based on age. Finally, DEXA is not a perfect tool for diagnosing EBM, as artefactual causes may affect the true BMD. For example, our DTM model identified three factors that may contribute to SEBM: DISH with severe LDD, non-DISH with a BMI ≥ 29.5, and diabetic non-DISH patients with a BMI between 24.4 and 29.5.
Although DEXA-measured BMD is the gold standard for diagnosing osteoporosis or osteopenia [37], there are several limitations in using DEXA BMD alone for defining EBM. First, DEXA typically measures the lumbar spine and proximal femur, but marrow disorders, often hematologic in nature, can cause axial osteosclerosis [38]. These conditions may not be detected in the proximal femur, especially in adults with fat in the femoral marrow [39]. The symmetric skeletal dysplasias and dysostoses can lead to asymmetric BMD elevations on DEXA [40]. It is essential to recognize that DEXA measures aBMD, not volumetric BMD (vBMD), and that the results can be influenced by bone geometry [41]. Furthermore, DEXA results should always be interpreted in the context of the patient’s clinical characteristics and medical history. In healthy populations with EBM, individuals have been identified as carriers of certain genetic mutations, such as van Buchem disease, sclerosteosis, or mild mutations in LRP5 and LRP6 [13]. Future studies should adopt a dual-assessment approach that integrates various imaging modalities, as this could improve our understanding of BMD in EBM and help establish more standardized definitions of EBM across different imaging techniques.
Our research has several limitations. The DEXA data were collected in a single hospital, which limits generalizability. The EBM group was not compared with the NBM, osteopenia, and osteoporosis groups. In addition, the determination of the severity of DISH and LDD was subjective, potentially introducing bias. Additionally, our study lacked sufficient data on confounding factors about EBM causes, such as genetic diseases.
Comments (0)