
Remember me

From January 2012 to December 2023, a total of 117 patients with TIO were included in this study. The clinical characteristics of the patients are summarized in Table 1. 82.9% (n = 97) of the patients had a history of misdiagnosis prior to the initial diagnosis, most commonly severe osteoporosis, intervertebral disc herniation and spondyloarthropathy. Of these, 73.2% of the patients were not tested for serum P and 26.8% were undiagnosed. The departments that TIO patients tended to visit first were orthopedics (61.2%, 30/49), followed by rheumatology (22.4%, 11/49). Pseudofractures were observed in 16 patients (13.7%), with 13 cases (11.1%) localized to the inferior pubic ramus. The remaining involved the tibia, fibula, and femoral neck. Among the cohort, 87 patients (74.4%) experienced at least one pathological fracture. Femoral neck fractures were identified in 24 patients (20.5%) (5 patients had underwent joint replacement surgery), vertebral fractures in 65 patients (55.6%), rib fractures in 79 patients (67.5%), and fractures of proximal femoral shaft and inferior pubic ramus in 4 patients (3.4%) and 35 patients (30.0%), respectively.
Table 1 Clinical characteristics before operationThe preoperative laboratory results and corresponding normal ranges are summarized in Table 1. Overall, the mean levels of serum phosphorus (P) and tubular maximum reabsorption of phosphate/glomerular filtration rate (TmP/GFR) were lower than the normal ranges; the levels of serum intact FGF-23, alkaline phosphatase (ALP), parathyroid hormone (PTH), C-terminal cross-linked telopeptide of type I collagen (β-CTX) and osteocalcin (OC) were elevated in 93.6%, 93.2%, 53.8%, 48.7% and 35.0% of patients, respectively; and the mean levels of serum calcium (Ca) and serum 25-hydroxyvitamin D (25OHD) were comparable to the normal ranges. A total of 104 patients underwent BMD testing, and two of them were unable to measure hip BMD due to hip replacement or femoral neck fracture. The BMD value was converted to the Z-value [(measured BMD—BMD of the same race and sex peers)/SD of the BMD of the same race and sex peers]. A Z value ≤ −2.0 was judged as an outlier for analysis. Accordingly, more than half of the TIO patients had decreased BMD at initial diagnosis and the trend was more pronounced for the BMD of FN. More detailed data on all patients are presented in Supplemental Table S1.
When biomarkers were compared, higher serum FGF23 levels were significantly associated with lower levels of TmP/GFR (Spearman’s rank correlation coefficient = −0.38, p < 0.05) and decreased BMD was significantly associated with elevated bone formation markers such as ALP and OC (Spearman’s rank correlation coefficient < −0.2, p < 0.05). Additionally, male patients were associated with high bone turnover markers (Spearman’s rank correlation coefficient > 0.2, p < 0.05). The results of clinical indicator correlation analysis in TIO were demonstrated in the heatmap (Supplemental Figure S3).
Tumor localization and postoperative pathologyTIO-associated tumors were identified by the stepwise approach involving physical examination, functional imaging and anatomical imaging (Fig. 1). Seven tumors were first detected by physical examination, two tumors were detected by 18F-FDG PET/CT, 53 by 99 mTc-HYNIC-TOC SPECT and 55 by 68 Ga-DOTA-TATE PET/CT (including 10 tumors with negative 99 mTc-HYNIC-TOC SPECT results). The SUVmax of 55 culprit tumors was significantly higher on 68 Ga-DOTA-TATE PET/CT compared with that of other parts of the body [20.3 (10.3, 43.5), range, 4.5–69.1 vs. 4.6 (3.5, 5.4), range, 1.2–9.4, p < 0.05].
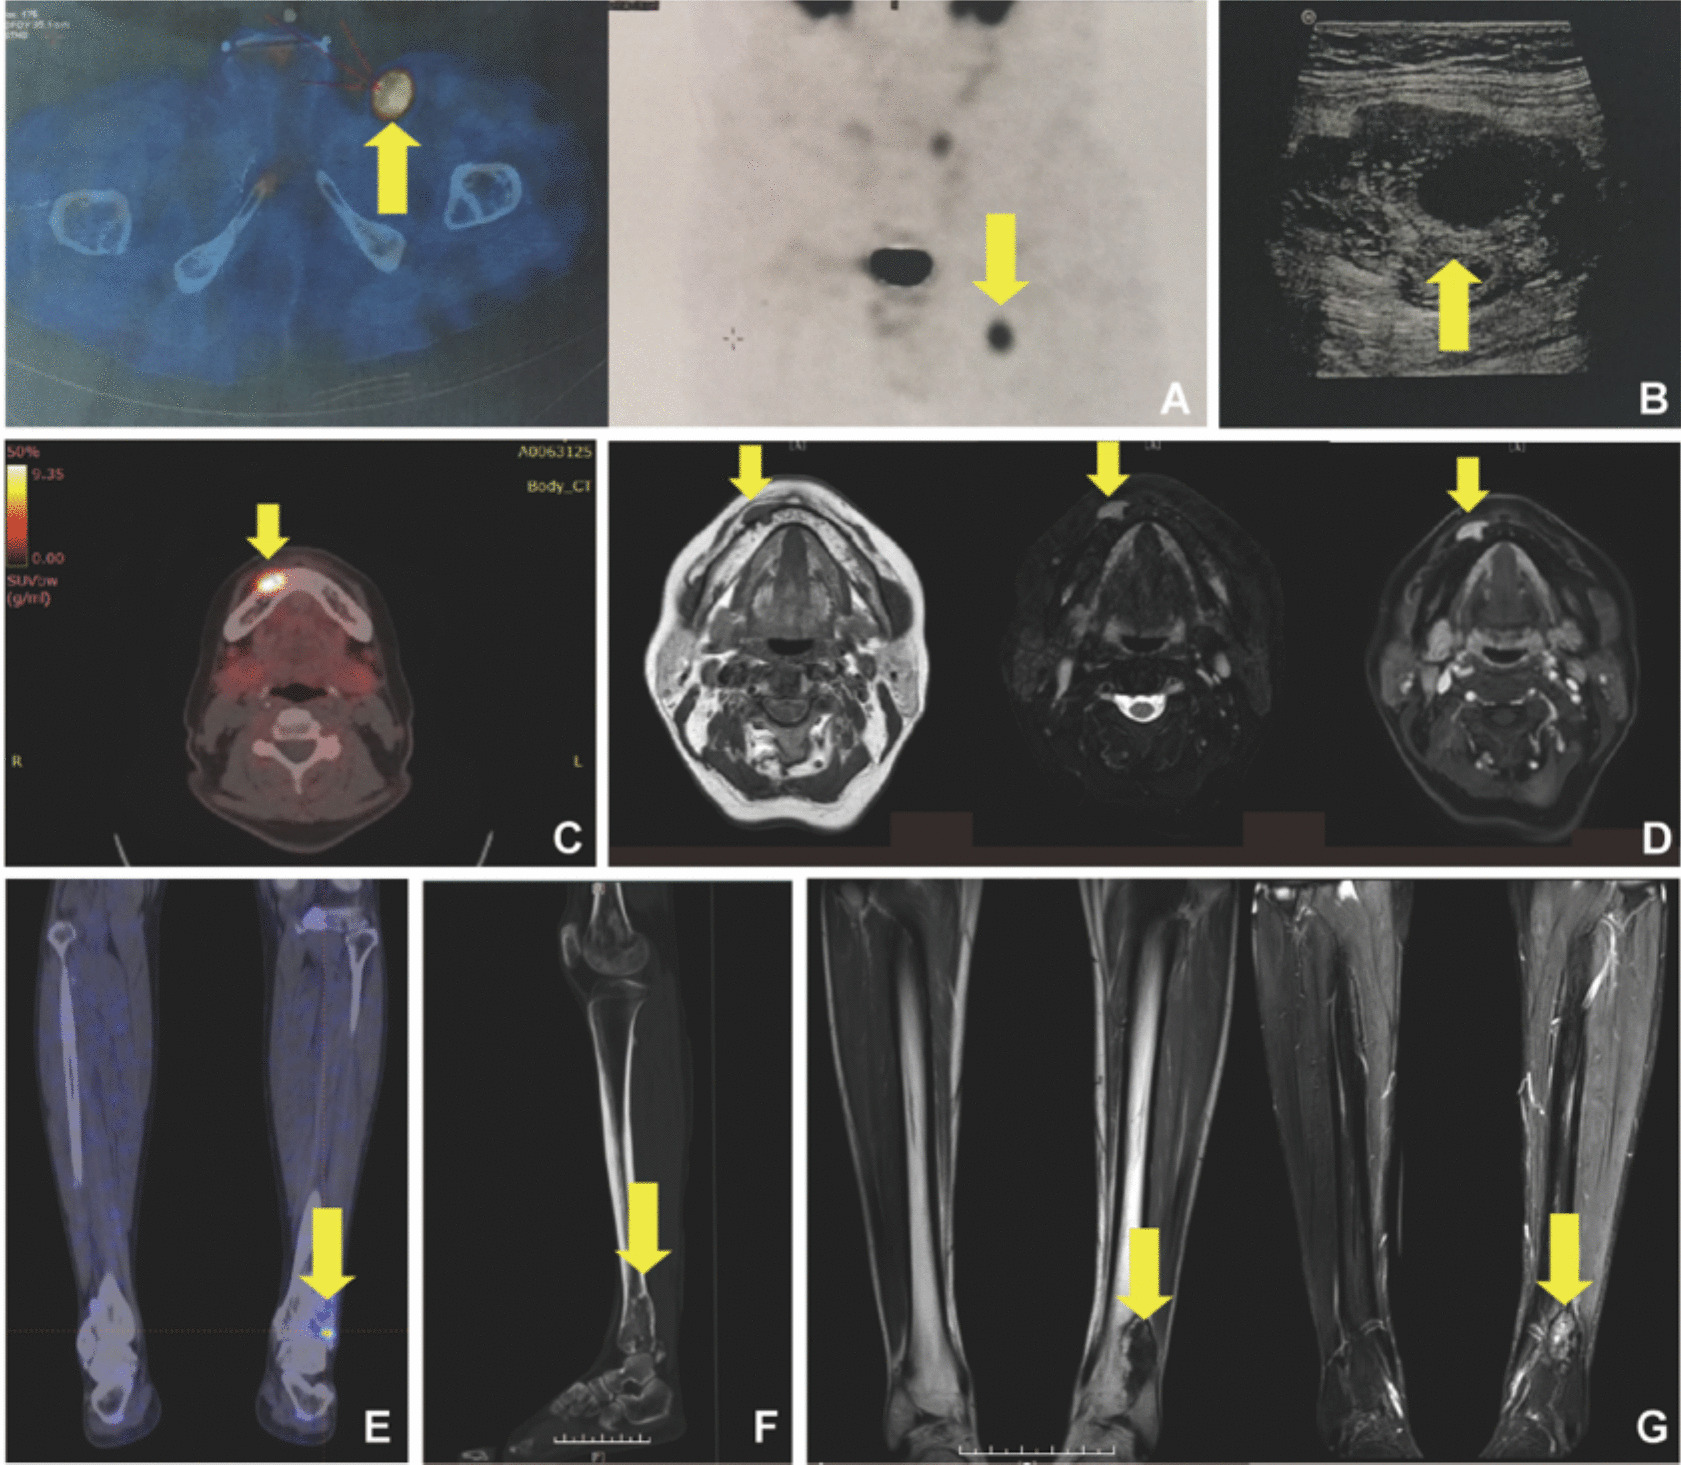
Fig. 1
Localization of tumor-induced osteomalacia tumors. 99 mTc-HYNIC-TOC SPECT (A) and ultrasonography (B) showed a lesion in the groin (yellow arrow). 68 Ga-DOTA-TATE PET/CT (C) and contrast enhanced MRI (D) of the head showed a mandibular lesion (yellow arrow). 68 Ga-DOTA-TATE PET/CT (E), CT (F) and MRI (G) of the fibula showed a solid lesion (yellow arrow) arising from the distal fibula. On MRI, TIO tumors presented with low signal intensity on T1 W sequencing, high signal intensity on T2 W sequencing, and distinct enhancement
All tumors were further confirmed by ultrasonography, CT and/or MRI. Of the 117 patients, 57 tumors (48.7%) were derived from bone (57.9% were located in the epiphysis) and 60 tumors (51.3%) were from soft tissue. 74 lesions (63.2%) were located in the lower extremities and pelvis (40.5% were located in the hip), 26 lesions (22.2%) were located in the head and neck (30.8% were located in the nasal cavity), 12 lesions (10.3%) in the thorax and abdomen and 5 lesions (4.3%) in the upper extremities. The details regarding the main sites of the tumors are summarized in Supplemental Table S1. As for the tumor derivation, the SUVmax of soft tissue tumors was higher than that of bone tumors [36.0(19.2, 52.5) vs. 14.2(9.9, 30.0), Mann–Whitney U test, p = 0.015]. There were no statistically significant differences among the tumors at different locations (p = 0.458).
Based on the diameters in all directions by pathology, the tumors were regarded as ellipsoids for volume size estimation. The median pathologic tumor volume was 1.45 cm3 (interquartile range, 0.70 to 4.17 cm3). The histopathology of the tumors from 117 patients showed a PMT, including two tumors and three intermediate tumors. The primary lesions of the malignant tumors in the two cases were lower-limb soft tissue tumors and the three intermediate tumors were all bone tumors. Immunohistochemical staining (Fig. 2) was positive for FGF23 and SATB2 in all cases. Ki67 labeling indices of tumor cells were greater than 30% in only two malignant tumors. No statistically significant correlations were observed between tumor size and characteristics such as gender, age, duration, tumor localization and blood P level, but the volume exhibited a weak correlation with serum iFGF23 level (Spearman's rank correlation coefficient = 0.289, p = 0.018).
Fig. 2
Tumor-induced osteomalacia tumor tissue (40×). Hematoxylin & eosin staining (A) and CD34 immunohistochemistry (C) slices demonstrated that blood vessels are admixed with small spindle-shaped tumor cells which often produce an abundant, ‘grungy’ chondroid extracellular matrix. Small spindle-shaped tumor cells showed strong immunohistochemical reaction with FGF23 (B) and SATB2 (D) antibodies. TIO tumors show low Ki67 labeling indices (E) and normal P53 expression patterns (F)
Follow-upAll patients with TIO underwent the surgical excision of tumors with 15 patients undergoing reoperations for incomplete resection or recurrence. The median postoperative follow-up period was 12 months (range, 1–144 months). Until the follow-up period to December 2023, a total of 98 patients with TIO were cured, but 19 patients remained uncured. The overall cure rate for the surgical treatment of TIO was 83.8% (98/117).
In cured patients, the clinical symptoms, such as bone pain and muscle weakness, gradually recovered several months after complete resection of the tumor. However, the skeletal deformities were irreversible. Dynamic changes in laboratory indicators and BMD are presented in Fig. 3. The median time for serum P level normalization was 7 days (range, 1 day to 10 months). Specifically, three patients (3.1%) had normal P levels 1 day after surgery, 28 patients (28.6%) at 1–3 days after surgery, 50 patients (51.0%) recovered 4–7 days after surgery, 15 patients (15.3%) had recovered by day 14 after surgery, and two patients (2.0%) had recovered more than 1 month after surgery. The line chart showed that the serum P level of TIO patients increased after surgery, peaked 1 month after surgery, and gradually decreased and maintained a normal level. Correlation analysis revealed no significant association between the duration of serum phosphate recovery and any baseline clinical parameters (p > 0.05). The TmP/GFR increased to normal within 7 days after surgery. The serum iFGF23 level in 57 cured patients decreased rapidly to 2.28 (range 0–29.48) pg/mL one day after surgery, and then gradually increased to the normal range. The serum ALP level in 76 TIO patients began to decrease after surgery and completely returned to normal levels approximately 18 months after surgery, while other bone turnover markers (BTMs), such as β-CTX and OC, gradually increased to a peak after surgery in TIO patients, and then decreased and stabilized. The serum PTH level fluctuated and returned to normal 18 months after surgery, and the 25OHD levels gradually increased. The BMD of the patients was retested 6 months, 12 months, 18 months and 24 months after surgery. Table 2 shows the rate of change between the baseline BMD value and that at each follow-up time point. At 6 months after surgery, the BMD of L1-4 was significantly higher than that of FN (p < 0.05), while there was no difference in BMD between the two observation parts at 12 months after operation. The rate of escalation in BMD slowed down at 18 months and 24 months after surgery. Changes in BMD lagged slightly behind changes in BTMs.
Fig. 3
Dynamic changes of laboratory indicators after surgery. The gray area indicates the normal reference range, and the data are represented as median and interquartile ranges. Pre-OP: preoperation; post-OP: postoperation
Table 2 Changes of BMD before and after tumor resectionPost-surgery complications can include hypocalcemia and a hungry bone-like syndrome. After complete tumor removal, serum Ca levels decreased and were often accompanied by prolonged and severe bone pain. In our cohort, the serum Ca levels gradually returned to normal after vitamin D and calcium supplementation at 7 days after surgery. Approximately one-third of TIO patients suffered from severe bone pain after surgery and reported a complete anodyne after a month.
Refractory subjectsPatients with refractory TIO consisted of those with non-remission or recurrent hypophosphatemia. After the primary operation, the incidence of non-remission and recurrent TIO was 17.9% (21/117) and 6.0% (7/117), respectively, with an overall refractory rate of 23.9% (28/117) (more detailed data on all refractory patients are presented in Supplemental Table S2). Two of the recurrent cases with malignant PMTs originated in the soft tissue of the feet, where one patient had succumbed to lung metastasis and the other had an amputation because of right lower extremity metastasis. The median time of recurrence was 33 months in the other five TIO patients. After reoperations, one patient recovered, two relapsed again and two showed persistent hypophosphatemia. The reason for the 11 non-remission cases was incomplete resection determined by imaging tests. Among them, eight received reoperation and recovered, and three patients opted for drug therapy. The median interval between treatments was 6 months, ranging from 2 to 39 months. At the time this manuscript was written, the recovery rate of multiple surgeries was 56.3% (9/16), which was lower than that of the primary surgery.
A comparison of the clinical characteristics between the refractory and recovery groups is presented in Table 3. Compared to the recovery group, the refractory group was younger (50.88 ± 12.88 vs. 43.79 ± 12.96, p = 0.013). The female/male ratio, duration, serum P levels, iFGF23 levels, ALP levels and β-CTX levels were similar between the two groups (p > 0.05). In terms of tumor localization, only the location of the primary tumor was calculated for tumors with metastases. Although the refractory group accounted for the largest proportion of lower extremities and pelvis, there was no significant difference. The proportions of thoracic, abdominal, upper limb, and head and neck tumors were also similar between the two groups. The postoperative outcomes of soft tissue tumors and bone tumors were significantly different: for soft tissue tumors, 85.0% (51/60) recovered, 5.0% (3/60) relapsed, and 10.0% (6/60) persisted; for bone tumors, 66.7% (38/57) recovered, 7.0% (4/57) relapsed, and 26.3% (15/57) persisted (p = 0.02). Based on postoperative tumor pathology, the tumor volume was estimated and the tumor was defined as benign and malignant (including malignant and intermediate). The tumor size in the refractory group was smaller than that in the recovery group (p = 0.001), whereas the prognosis of malignant tumors was worse than that of benign tumors (p = 0.011).
Table 3 Comparison of clinical characteristics between refractory and recovery CasesGiven the above results, we first performed univariate logistic analyses (Table 4). The outcomes were divided into recovery and refractoriness groups. Age, involved tissue, malignancy, and tumor volumes were analyzed. Older onset age and larger tumor size were identified as protective factors for recovery and bone tumors and malignant tumors showed a higher risk of refractoriness. Variables that were significantly associated with outcomes in the univariate analyses were included in the multivariate analyses using the likelihood ratio forward stepwise method. The results were the same. Tumor size was excluded from the equation due to missing values.
Table 4 Risk factors associated with refractory outcomesPostoperative outcomes of patients with bone-derived tumorsConsidering that the tumor location may be an important factor associated with outcomes, we screened the TIO cohort again and included only patients with bone tumors. 57 patients underwent 73 surgeries, with 67 curettages and six segmental resections. The overall cure rate for surgical treatment of TIO was 52.6% (30/57). The complete resection rate for curettage was similar to that for segmental resection (68.7%, 46/67 vs. 83.3%, 5/6, p = 0.661). However, the recurrence rate after curettage (17.4%, 8/46) was higher than after segmental resection (0%, 0/5).
In 57 patients, there were 12 lesions (21.1%) in the femoral head, 10 lesions (17.5%) in the greater femoral trochanter, two lesions (3.5%) in the femoral shaft, four lesions (7.0%) in the vertebrae, eight lesions (14.0%) in the skull, two lesions (3.5%) in the tibial shaft, two lesions (3.5%) in the medial tibial condyle, six lesions (10.5%) in the acetabulum, two lesions (3.5%) in the pubis, three lesions (5.3%) in the fibular head, two lesions (3.5%) in the caput humeri, two lesions (3.5%) in the shaft of ulna, one lesion (1.8%) in the scapula and one (1.8%) in the rib. PMTs seem to be commonly located in the long bones (64.9%, 37/57), and half of the tumors (50.9%, 29/57) were in the epiphysis. We also performed regression analyses of the bone-derived tumor location using the skull tumors as a reference, those in the femoral head, acetabulum, and spine showed a higher risk of refractoriness. Compared with upper limb tumors, the refractory risk was dramatically higher for tumors located in the acetabulum and spine (OR = 42.50 and 25.50, p = 0.005 and 0.019, respectively).
Comments (0)