Mice
Female BALB/c mice (6–8 weeks old) were obtained from the Chongqing Medical University Animal Laboratory and housed as previously described [6]. All animal experimental protocols received approval from the Ethics Committee at the Children’s Hospital of Chongqing Medical University(Approval number:20240412003), and the animal studies were conducted in compliance with the Chinese Council on Animal Care.
Cell Culture and Virus Infection
The A549 and 16HBE cell lines(ATCC,USA) were used for the RSV infection experiments. The cells were cultured in Dulbecco’s Modified Eagle Medium (DMEM) supplemented with 10% fetal bovine serum. For viral adsorption, A549 or 16HBE cells A549 or 16HBE cells were cultured overnight in 12- or 6-well plates and subsequently infected with RSV for two hours, using a multiplicity of infection (MOI) of 1. The medium was removed and replaced with fresh medium containing 10% serum. The infected cells was then cultrued for another 24 or 36 h at 37 °C.
Mouse RSV Infection
Mice were inoculated with RSV as described previously [6]. We utilized the A2 strain of human RSV (VR-1540, American Type Culture Collection, USA) without lipopolysaccharide (LPS), with intranasal inoculation with 1.5 × 10⁷ plaque forming units (PFU) of RSV in a 100-μL volume or sham infection with 100 μL of HEp-2 suspension without virus.
Bronchoalveolar Lavage Fluid (BALF) Inflamatory Cell Count
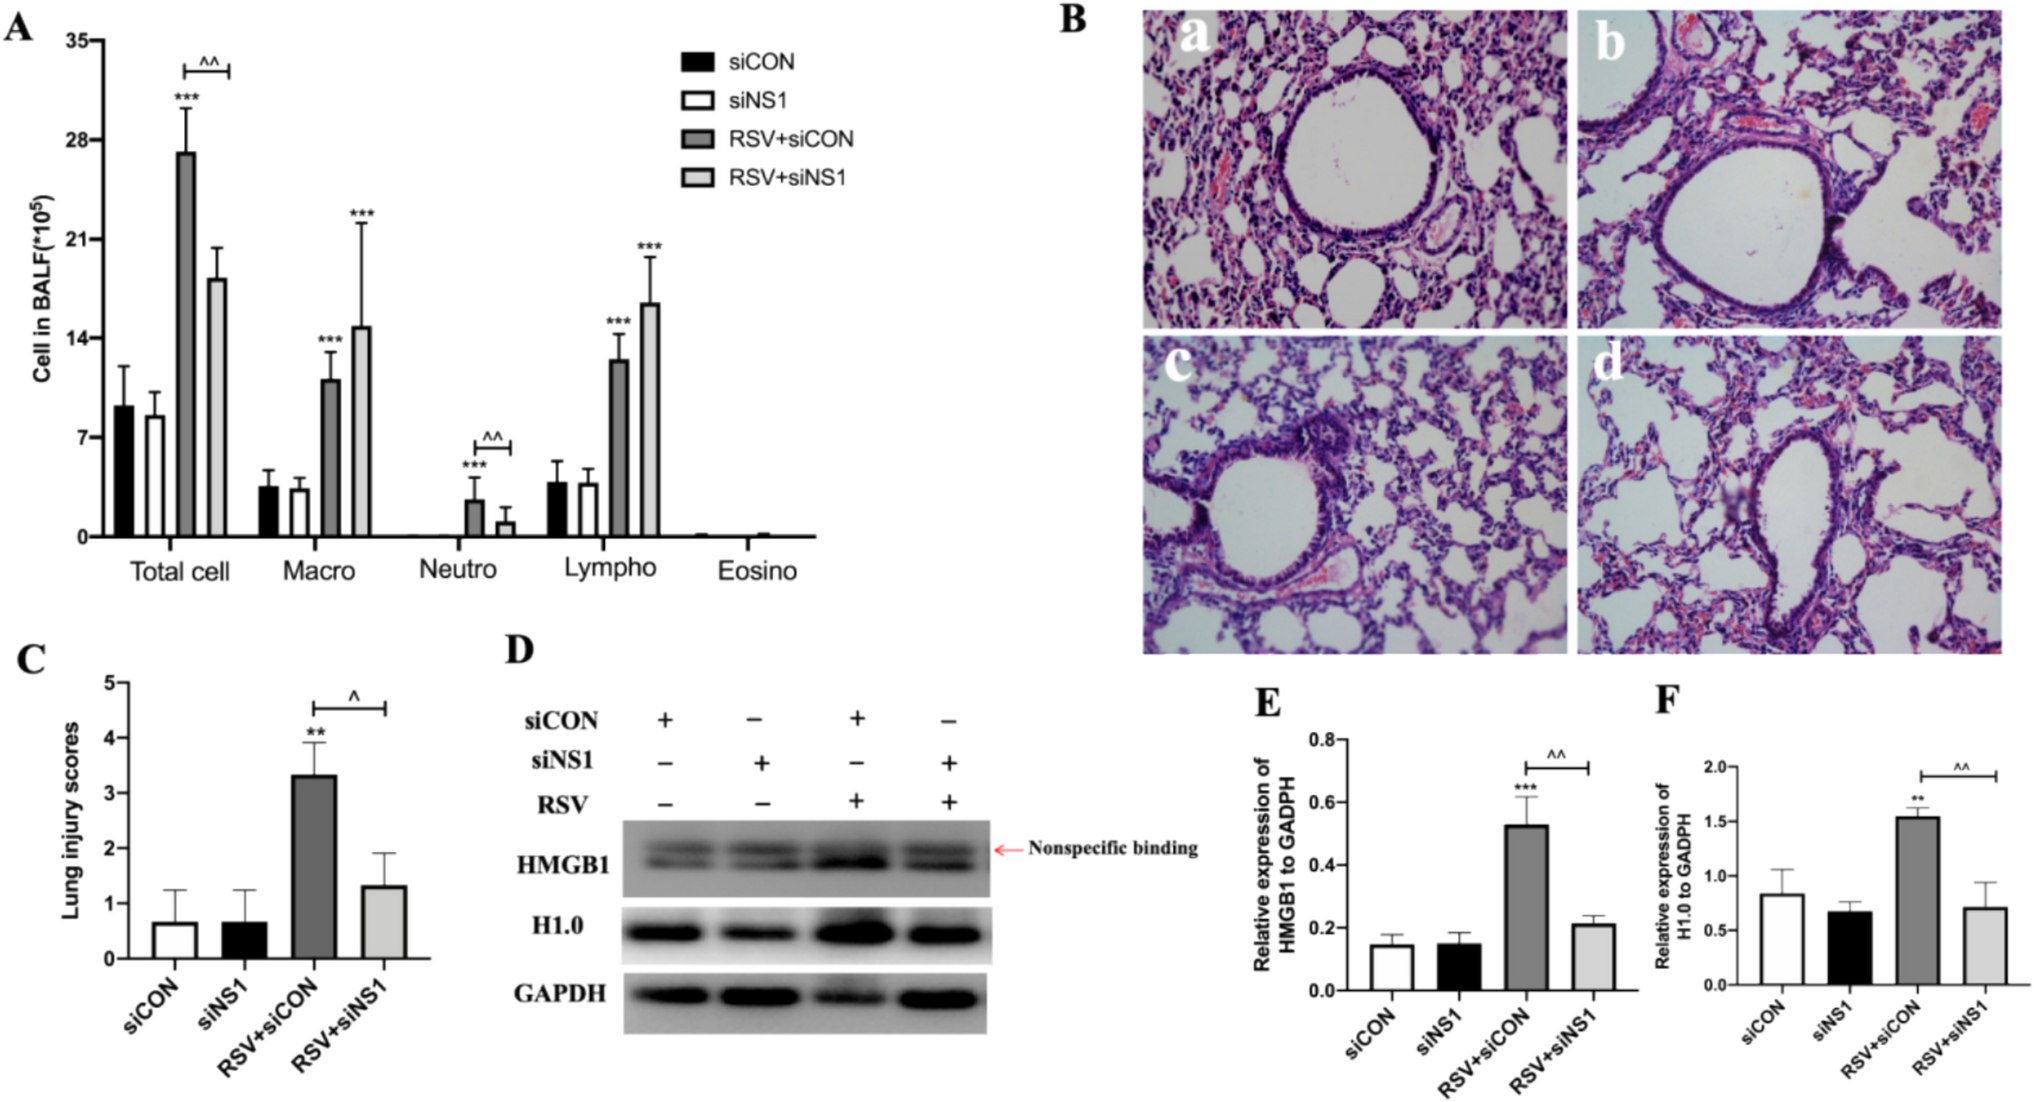
The BALF was collected to evaluate inflammatory cell as described in our previous works [6, 10]. Briefly, mice were anesthetized on day 21 after RSV infection, and the lungs were lavaged, in situ, six times with 0.5 ml of ice-cold PBS. The BAL fluid was centrifuged (2500 rpm, 5 min). The supernatants were stored at −80℃. The cellular pellets were resuspended in 1 ml of PBS, and the total cell number was counted. For differential cell counts, 250 μl of the resuspended cells was spun onto microscope slides, airdried, and stained. For each sample, 200 cells were counted for the number of macrophages, neutrophils, lymphocytes and eosinophils.
Cytokine Measurement
The concentration of HMGB1 in the cultured cell supernatants was determined by using the human HMGB1 Enzyme-Linked Immunosorbent Assay (ELISA) Kit (Shino-Test, Kanagawa, Japan) according to the ELISA kit instructions.
Lung Histopathology
Mice were euthanized by cervical dislocation. Their left lung tissue were fixed in 10% (vol/vol) neutral buffered formalin for 24 h and then embedded in paraffin, cut into 5-μm thickness, and stained with hematoxylin and eosin (H&E). The degree of lung tissue damage was evaluated by assigning a value of 0 for no inflammation, 1 for mild inflammation, 2 for moderate inflammation, and 3 for severe inflammation.
Knockdown Experiments
RSV NS1 small interfering RNA (siRNA) and negative control siRNA were purchased from GeneChem (Shanghai, China) as used previously [6]. The siRNA sequences were: siNS1: 5´-GGCAGCAATTCATTGAGTATG-3´; siCON (negative control): 5´-TTCTCCGAACGTGTCACGT-3´. siNS1 or siCON was transfected cells by using Lipofectamine 3000 Reagent (Invitrogen, USA). The cells were incubated with RSV for 6 h, after which the plasmid (siNS1 or siCON) was transfected for another 24 h. Mice were inoculated intranasally with the siNS1 or siCON plasmids using Entranster In Vivo Transfection Reagent (Engreen Biosystem, New Zealand) in accordance with the manufacturer’s recommendations one day before RSV infection and two days after RSV infection, respectively.
Lentiviral Construct Assay
The NS1 lentivirus (LV5-NS1-GFP) and negative control (LV5-CON-GFP) encoding enhanced green fluorescent protein were purchased from GenePharma (Shanghai, China). A549 cells were plated at a density of 1 × 10^5 cells/mL. After 12 h, the confluence of the cells reached approximately 40%. The cells were subsequently transduced with lentivirus (MOI = 10) and maintained in DMEM without fetal bovine serum for 8 to 12 h, after which the medium was replaced with complete culture medium. The cells were transduced with lentivirus for a total duration of 72 h.
Quantitative Real-Time Polymerase Chain Reaction (qRT-PCR)
Mouse lungs tissues was used to extract total RNA by using a high purity RNA extraction kit-RNAiso Plus reagent (TaKaRa, Japan). After quantification, RNA(2 µg) was used to generate first-strand cDNA and then the cDNA were used for qPCR as described previously [6]. The RSV NS1 gene was quantified using TaqMan RT-PCR, as described previously [14].
Western Blot Analysis
Mice lung homogenates, total cell proteins, cell nuclear and cytoplasmic proteins were extracted using the Nuclear Extraction Kit (Active Motif, USA). Brifly, wash the cells and add 3 mL of ice-cold PBS/Phosphatase inhibitors, collect the cells and transfer them to a pre-chilled 15 mL centrifuge tube. Centrifuge at 200 g for 5 min at 4℃, discard the supernatant, and retain the cell pellet. Add 500 μl of 1X Hypotonic Buffer to resuspend the cell pellet and transfer it to a pre-chilled EP tube, incubating on ice for 15 min to allow the cells to swell. Shake at the maximum speed for 10 s, then centrifuge at 14,000 g for 30 s at 4℃, collecting the supernatant as the cytoplasmic protein.Then Add 50 μl of Complete Lysis Buffer to the cell pellet, thoroughly mix by pipetting and place on ice. Incubate on a shaking platform at 150 rpm for 30 min, shake at maximum speed for 30 s, and centrifuge at 14,000 g for 10 min at 4℃, collecting the supernatant as the nuclear protein. Samples containing equal quantities of protein were separated using 8% or 10% SDS-PAGE and then transferred onto polyvinylidene difluoride (PVDF) membranes. The membranes were then probed with primary antibodies against HMGB1 (1:1 000; Proteintech Group, USA), H1.0(1:1 000; Proteintech Group, USA), NS1 (1:1 000, provide by our labratory), GFP (1:1 000; Proteintech Group, USA), and GAPDH (1:5 000; Proteintech Group, USA). Followed by appropriate alkaline phosphatase-conjugated goat anti-rabbit secondary antibody (1:10 000; Proteintech Group, USA), rabbit anti-goat antibody (1:10 000; Proteintech Group, USA), and goat anti-mouse antibody (1:10 000; Proteintech Group, USA). Signals were quantified using ImageJ 1.52a.
Immunofluorescence Analysis
The A549 cells were grown on round coverslips, fixed with 4% paraformaldehyde, and blocked using 5% bovine serum albumin as described in our previous work [6]. The coverslips were then incubated with anti-HMGB1 or anti-H1.0 antibodies (1:50; Proteintech Group, USA) overnight at 4 °C, followed by appropriate fluorescein isothiocyanate-conjugated secondary antibody (1:200; Beyotime, China) for 1 h at room temperature. Finally, the cells slips were photographed using a fluorescence microscope (Olympus, Japan) and analyzed with ImageJ 1.52a.
Immunoprecipitation
A549 cell lysates were used for immunoprecipitation as described in our previous work [5]. Briefly, 80 μL SureBeads Protein G (Bio-Rad, USA) was thoroughly resuspended in 1 ml PBS, then transferred to 1.5-mL tubes. The beads were magnetized and 4 μg of HMGB1, NS1 and H1.0 antibody was added to the beads, followed by rotation for one hour at room temperature. Then, cell lysate (400 μL) was added into the beads and rotated for 2 h at room temperature. Before the final magnetization, the resuspended beads were transferred to a new tube, after which 100 μL of 1 × Laemmli buffer was added and incubated for 10 min at 70 °C.
Glutathione S-transferase(GST) Pull-Down Assays
GST, GST-NS1, HA-HMGB1 and His-H1.0 fusion proteins were expressed in E. coli BL21 cells. Subsequently, GST-NS1 was purified by using Glutathione Sepharose (GE Healthcare Life Sciences) as described in our previous work [6]; The HA-HMGB1 and His-H1.0 were purified by using Ni–NTA Sepharose. 30 μg of appropriate GST or His fusion proteins coupled to GST or His tag purification resin was mixed at 4 °C for 2 h, then the target fusion protein was added and mixed overnight at 4 °C. The mixed proteins were washed with eluent and dectected by western blotting.
Surface Plasmon Resonance Analysis
Surface plasmon resonance (SPR)-based measurements were conducted using a BIAcore T200 system (Cytiva). His-NS1 and His-H1.0 fusion proteins were expressed in E. coli BL21 cells and purified. The NS1 protein was diluted to 20 μg/mL in 10 mM acetate buffer at pH 5.5, with a flow rate of 10 μL/min, and immobilized on the CM5 chip(Series Sensor Chip CM5, Cytiva) to a density of 600 RU in target density mode. Before this procedure, the sensor surface was activated by injecting a mixture of 50 mM N-Hydroxysuccinimide and 200 mM 1-Ethyl-3-(3-dimethylaminopropyl)carbodiimide for 7 min. Finally, the surface was blocked with 1 M ethanolamine at pH 8.5. For affinity analysis, the H1.0 protein was dissolved in PBS buffer at concentrations of 0, 15.625, 31.25, 62.5, 125, 250, and 500 nM, and then flowed across the chip. After binding to the surface, each sample was dissociated in PBS buffer for 360 s at a flow rate of 30 μL/min. The dissociation constant (KD) was determined and recorded using the BIAcore T200 system.
In Silico Study
The structures of Histone H1.0 and NS1 proteins were obtained from the PDB database (7COW and 5VJ2 respectily, which only the globular portion of H1.0 was utilized for docking). To process the protein structures for further analysis, the H + + 3 online server performed protonation processing under neutral conditions at a pH of 7. Subsequently, UCSF Chimera software was employed to eliminate impurities and water molecules from the crystal structure, leaving only the protein structure with allocation of Amber14SB charges. Protein docking was then performed using the professional tool HDOCK. Molecular docking and conformational scoring were performed using the empirical iterative scoring function ITScorePP, a negative score indicates molecular binding, and a larger absolute value signifies a stronger binding ability.The maximum number of output conformations for docking was set to 100, and the top 10 conformations were scored. A confidence score was employed for reliability analysis, where a score greater than 0.7 indicates that the docking score is reliable and that there is a high likelihood of molecular binding. The conformation with both the highest docking score and confidence score was selected for subsequent analysis.The 3D mapping analysis was conducted using PyMol v2.5.7, while the academic version of Maestro software was utilized for 2D interaction and statistical analysis of interaction characteristics, distances, and quantities. Following this, the protein complex resulting from the docking process underwent a 100 ns molecular dynamics simulation using the GROMACS software (version: 2020, Phad Calculation, Chengdu, China.), with the force field parameter set to AMBER99sb-ildn. Based on the outcomes of the molecular dynamics simulations, analyses were performed on the Root Mean Square Deviation (RMSD), Root Mean Square Fluctuation (RMSF), Radius of Gyration (Rg), Solvent Accessible Surface Area (SASA), and Hydrogen Bonds (H-bonds) of the complex, which were graphically presented using GraphPad Prism. The Gibbs free energy was computed utilizing the “g_sham” and “xpm2txt.py” scripts based on RMSD and Rg values.
Statistical Analysis
All statistical analyses were performed using Prism GraphPad Software 8.4.0(La Jolla, CA, USA), with results expressed as mean ± standard error of the mean (SEM). Analysis of variance (ANOVA) was used to determine differences between groups. Data lacking normal distribution were evaluated using the nonparametric Kruskal–Wallis test. Differences were considered significant at P < 0.05.


Comments (0)