
Remember me


Female and male BALB/c mice (6 weeks old) were purchased from the Sino-British Sippr/BK laboratory (Shanghai, China). Female mice were utilized to develop an asthma model, while male mice were employed for the in vitro isolation of bone marrow and subsequent culture of BMMC. All animal care and experimentation were conducted in accord with the Shanghai General Hospital animal care and use committee guidelines.
Preparation of BMMC-EVs-DfEBMMC-EVs and BMMC-EVs-DfE were prepared as previously reported [12]. BMMC-EVs were obtained from BMMCs cultured in isolation, while BMMC-EVs-DfE were derived from BMMCs co-cultured with DfE (Chongqing Manuik Technology Co. Ltd, Chongqing, China) at a concentration of 10 µg/mL for 48 h. Prior to use, DfE underwent centrifugation at 100,000 g for 2 h to remove EVs and microparticles. BMMCs were cultured at a density of 1 × 10⁶ cells/mL in a medium supplemented with SCF and IL- 3 (PeproTech, USA) and 10% FBS (Gibco, USA) depleted of bovine EVs for three days before EVs collection. Supernatants were then subjected to two successive centrifugations at 300 g for 5 min and 1,200 g for 20 min to eliminate cells and debris, culminating in a final centrifugation at 100,000 g for 2 h. EVs were then washed twice in a large volume of phosphate-buffered saline (PBS) and centrifuged at 100,000 g for 2 h. Then, isolation of EVs by OptiPrep TM density gradient were prepared as previously reported too [12]. The BMMC-EVs and BMMC-EVs-DfE were subsequently resuspended in PBS, and their protein concentrations were quantified utilizing a Protein Assay Kit (Beyotime Biotechnology, China). The prepared BMMC-EVs and BMMC-EVs-DfE samples were stored at − 80 ℃ until further used.
Transmission Electron Microscopy AssayThe morphology of extracellular vesicles (EVs) was characterized utilizing transmission electron microscopy (TEM, FEI Tecnai 12, Philips, Netherlands). Both the BMMC-EVs and BMMC-EVs-DfE samples were prepared as previously described, originating from an equivalent number of parental cells. The specific protocol involved the adsorption of 20 μL of freshly isolated BMMC-EVs and BMMC-EVs-DfE onto 200 mesh copper grids for 1 min, followed by staining with a 2% uranyl acetate solution for an additional minute. Subsequently, the samples were dried under a half-watt lamp. Imaging was conducted with a pixel size of 0.3 nm and a direct magnification of 67,000 ×, utilizing a Gatan CCD camera.
ZetaView Nanoparticle Tracking AnalysisNanoparticle tracking analysis (NTA) was conducted utilizing the ZetaView PMX 110 instrument (Particle Metrix, Meerbusch, Germany) in conjunction with its associated software (ZetaView 8.03.04.01). The BMMC-EVs and BMMC-EVs-DfE samples, originating from an equivalent number of parental cells, were prepared according to the previously described protocol. Each sample was diluted in 1 × PBS to a volume of 2 mL and subsequently introduced into the analysis chamber. The NTA instrument assessed each sample at 11 distinct positions within the chamber, executing a single cycle of readings per position. The pre-acquisition parameters for the instrument were configured to a temperature of 23 °C, a sensitivity setting of 85, a shutter speed of 100, an exposure time of 2 s per position, and a frame rate of 30 frames per second (fps). Post-acquisition, the analysis parameters were adjusted to a minimum brightness threshold of 25, a maximum particle size of 200 pixels, and a minimum particle size of 5 pixels. Following the automated analysis of all 11 positions and the exclusion of any outlier data points, the software calculated the mean, median, and mode particle sizes (expressed as diameters) as well as the sample concentrations.
Western BlottingWestern blot analysis was conducted as described in previous studies. Proteins were separated using SDS-PAGE and subsequently transferred onto a nitrocellulose membrane. A range of antibodies was employed to detect standard markers of extracellular vesicles, including FcεRI (Abcam, ab166812), tumor susceptibility gene 101 (TSG101, Abcam, ab125011), CD81 (Abcam, ab109201), CD63 (Abcam, ab217345), and cytochrome C (Abcam, ab13575), and GAPDH (Abcam, ab9485). Primary antibodies were diluted in accordance with the manufacturer's protocol and incubated overnight at 4 °C. Following incubation, the membranes were washed and then incubated with HRP-conjugated secondary antibodies, which were diluted in TBST, at 37 °C for 1 h. Immunoreactive bands were detected using an ECL Kit (Millipore, USA) and visualized with a ChemiDoc MP imager (Bio-Rad) following the manufacturer's instructions.
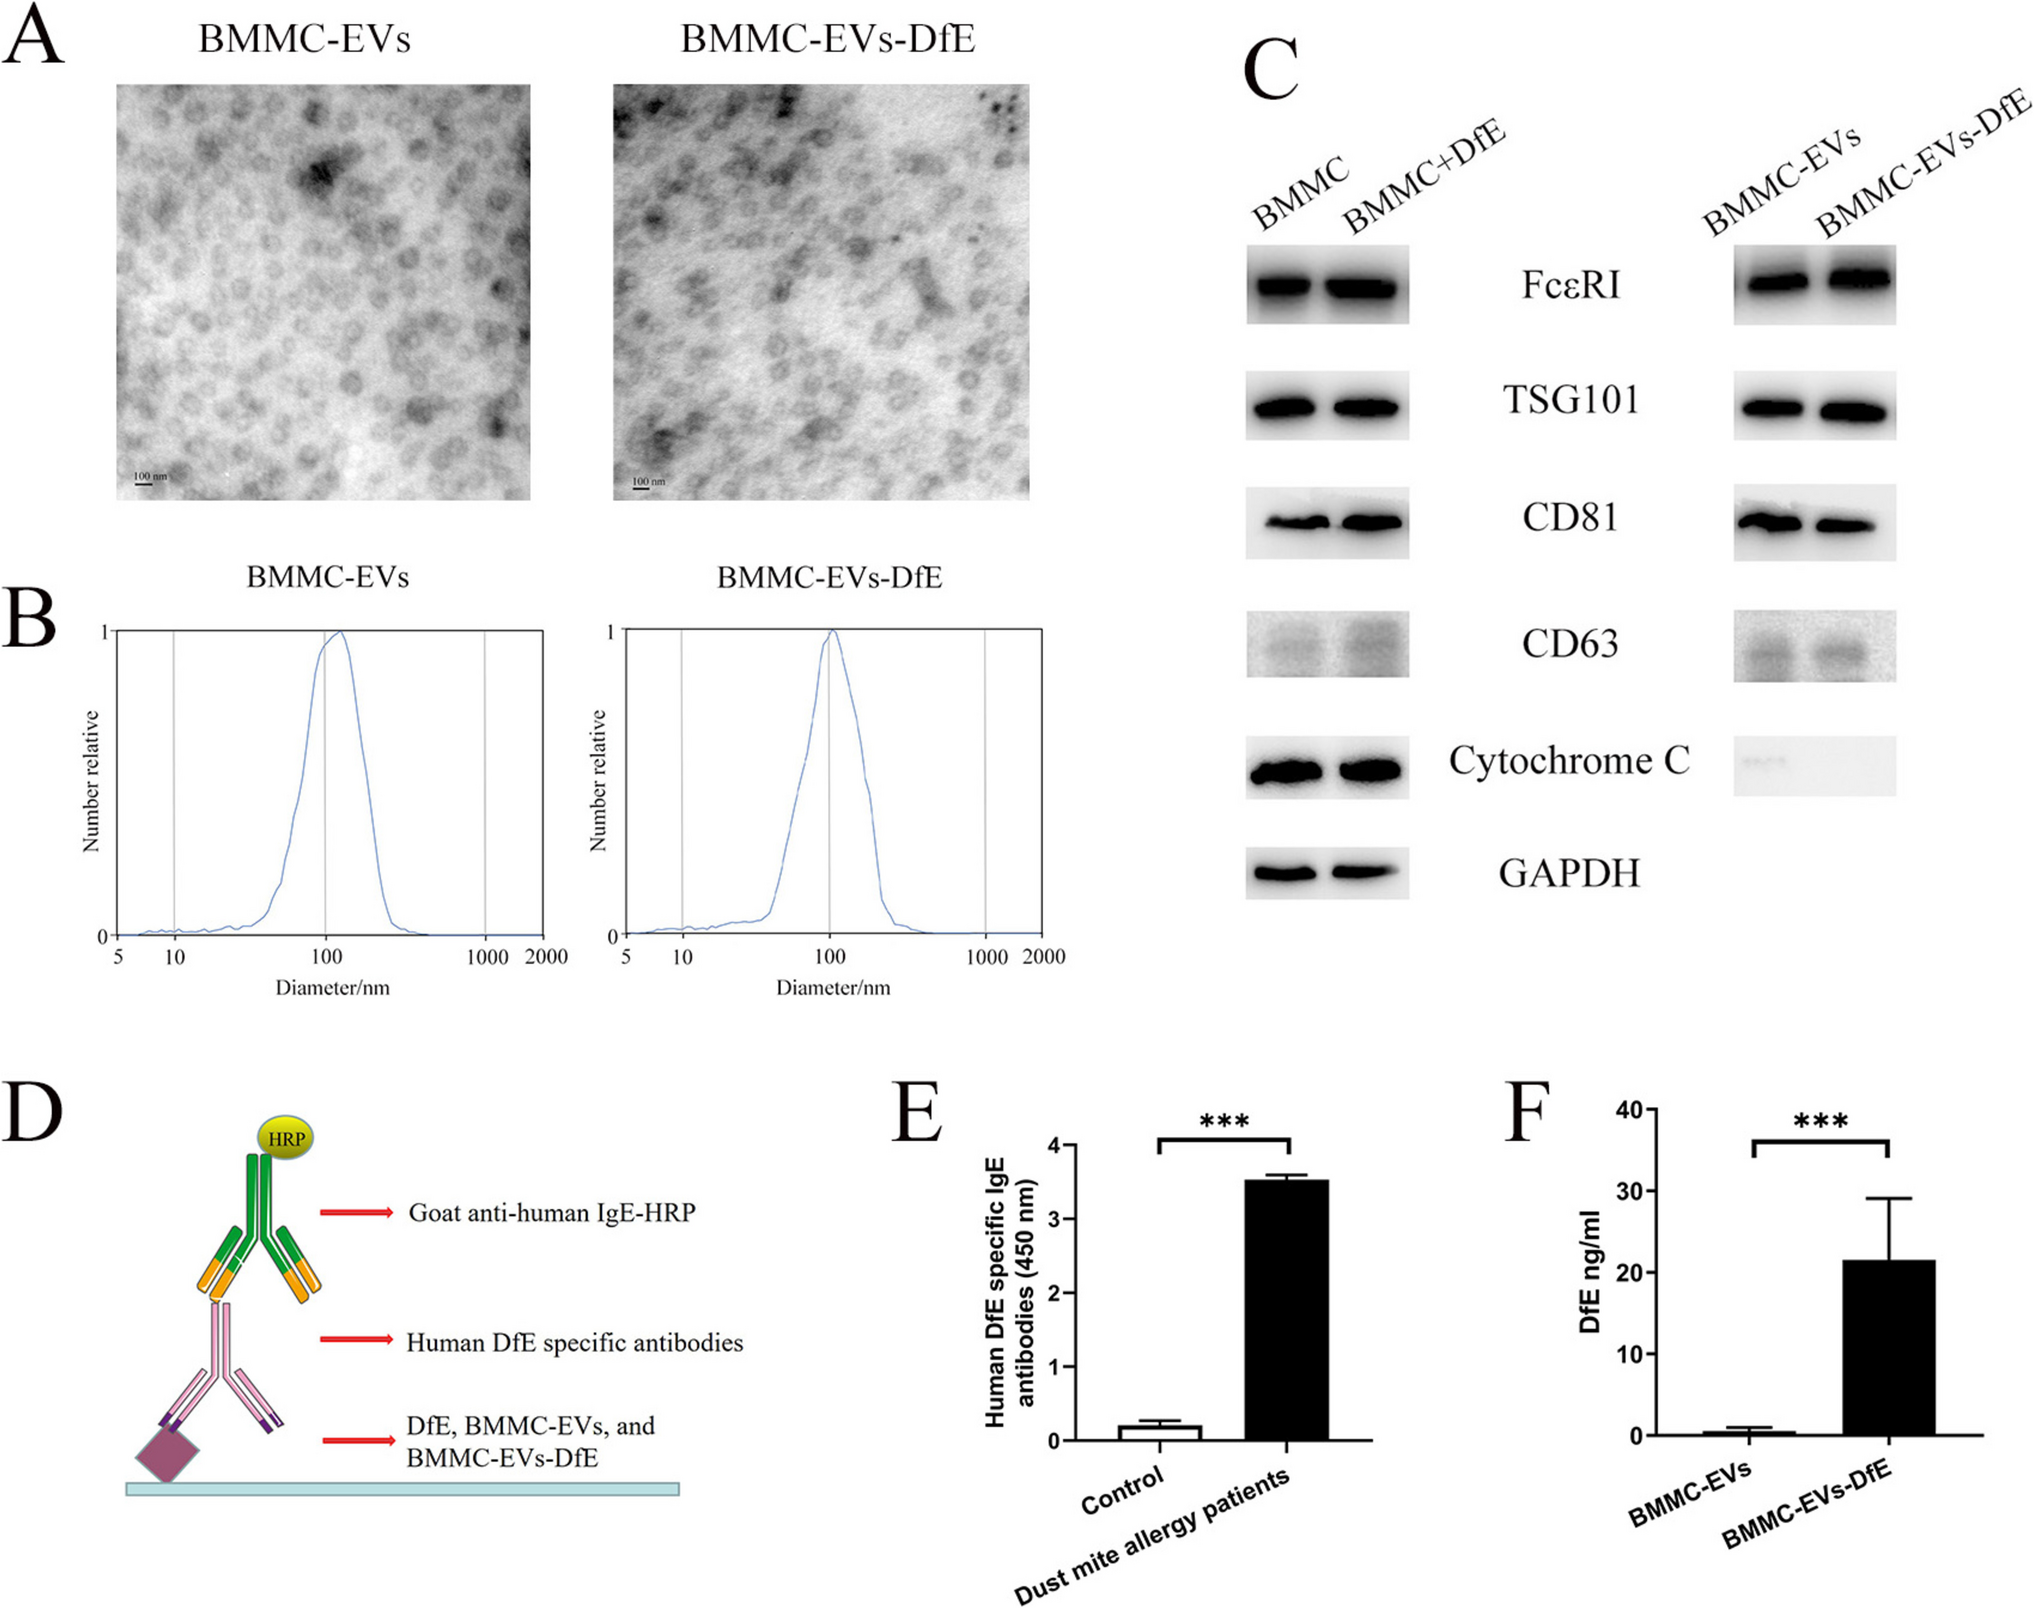
Determination of DfE in the BMMC-EVs-DfEThe mixed serum obtained from three patients with dust mite allergies, as outlined in Table 1, was analyzed for human dermatophagoides farina specific IgE antibodies using the ImmunoCAP Phadia250 assay (Thermo Fisher Scientific, Uppsala, Sweden). A positive result was defined as ≥ 0.35 kUA/L. Confirmation of the presence of human dermatophagoides farina specific IgE antibodies in the mixed serum was further conducted using ELISA, following the methods depicted in Fig. 1D. The control group consisting of mixed serum from three healthy individuals, as indicated in Table 1, was also included in the study.
Table 1 Subject characteristicsFig. 1
Identification and characterization of BMMC-EVs and BMMC-EVs-DfE. (A) Transmission electron micrographs of the EVs structures with a diameter of approximately 30–150 nm. The scale bar indicates 100 nm. (B) The average size and quantity of EVs were measured by Nanoparticle Tracking Analysis (NTA). (C) Western blotting analysis of the EVs show that BMMC-EVs and BMMC-EVs-DfE expressed the MCs specific receptor FcεRI, and traditional EVs markers TSG101, CD81, and CD63. However, cytochrome C was highly enriched in the parental cells compared with corresponding EVs. (D) BMMC-EVs-DfE were found to contain DfE, as indicated by the ELISA detection pattern. (E) The mixed plasma samples from patients with dust mite allergies were collected and analyzed for the presence of human DfE-specific antibodies using ELISA. The mix plasma of three healthy individuals was collected as controls. (F) The presence of DfE on BMMC-EVs-DfE was assessed using ELISA with mix plasma. BMMC-EVs were used as controls. A fitting curve was constructed to determine the concentration of DfE in BMMC-EVs-DfE
BMMC-EVs and BMMC-EVs-DfE were subjected to ELISA analysis in triplicate to determine the presence and concentration of DfE, as described in a previous publication [13]. Microtiter plates (96 wells; Nunc, Roskilde, Denmark) were utilized for coating with BMMC-EVs and BMMC-EVs-DfE preparations at a concentration of 100 μg/mL, as well as with DfE alone at varying concentrations (2000 ng/mL, 500 ng/mL, 125 ng/mL, 31.25 ng/mL, and 0 ng/mL) in 0.1 M carbonate buffer at pH 9.6. Following overnight incubation at 4 ℃, the plates were washed and blocked with 200 μL of PBS containing 3% bovine serum albumin for 2 h at room temperature to prevent non-specific binding.
The mixed serum from patients with dust mite allergies, which contained human anti-DfE antibody, was diluted at a ratio of 1:10 in PBS with 0.05% Tween 20 and added to each well. After a 2-h incubation period, 100 μL of goat anti-human IgE horseradish peroxidase (HRP; Abcam, USA, diluted at a ratio of 1:2000) was added and incubated for an additional 2 h. Tetramethylbenzidine high sensitivity substrate solution (Biolegend, USA, Cat No.:421501) was utilized, and the absorbance was measured at 450 nm using a microplate reader from Molecular Devices Corp. (Menlo Park, CA, USA).
Immunization of MiceFemale mice were sensitized through intraperitoneal injection with a 200 μL mixture containing 50 μg DfE and 2 mg Al(OH)3 on days 0, 7, and 14. Following a two-week interval after the final sensitization, the mice were intranasally immunized with 5 μg BMMC-EVs, 5 μg BMMC-EVs-DfE, and 1 ng DfE (as outlined in Table 2) on days 28, 31, 34, 37, 40, 43, and 46 respectively in 200 μL PBS. Subsequently, at day 53 to day 59, the mice were exposed to 250 μg/mL DfE for 30 min daily over a period of seven consecutive days using an ultrasonic nebulizer (Yuyue Medical Equipment & Supply Co., Ltere, Jiangsu, China). The control group mice underwent sensitization, immunization, and challenge with PBS. Mice were euthanized via cervical dislocation at day 60. The experimental design for immunization is depicted in Fig. 2A, with group descriptions and immunization dosages for mice detailed in Table 2.
Table 2 Group description and immunization in mice studyFig. 2
(A) Experimental design for BMMC-EVs-DfE immunization. Mice were administered intraperitoneal injections of DfE combined with Al(OH)3 on days 0, 7, and 14, followed by intranasal treatments with PBS, DfE, BMMC-EVs, and BMMC-EVs-DfE on days 28, 31, 34, 37, 40, 43, and 46, respectively. Subsequently, one week later, the mice were exposed to DfE challenge starting from day 53 to day 59. On days 60, the mice were euthanized for sampling and assess the impact of BMMC-EVs-DfE on DfE-induced airway hyperresponsiveness. (B) BMMC-EVs-DfE induced changes in mice AHR. Results are reported as mean ± SD. Statistical significance was determined by two-way ANOVA, adjusted with the Bonferroni test for multiple comparisons. #: compare with control, φ: compare with asthma, P < 0.05. (C) Inflammatory cell infiltration in BALF were stained with Liu’ staining and counted differently. (D) The plasma levels of histamine were assessed using ELISA. Levels of IL- 1β (E), and IL- 6 (F) in the BALF were quantitated by murine Luminex multiplex assay. (G) Pathological examinations of mouse lung tissues by H&E staining. Representative images for stained tissue sections are shown. All sections were observed by light microscopy at 400 × Magnification. The scale bar indicates 20 μm. Results are reported as mean ± SD (n = 6 per group)
Lung Function and Bronchoalveolar Lavage FluidMice were anesthetized, tracheostomized, and placed in a body plethysmograph (eSpira™ Forced Manoeuvers System, EMMS, Hants, UK) following the final DfE inhalation. Lung resistance (resistance Index, Rl) was measured in response to increasing concentrations of nebulized acetylcholine (ACh) at concentrations of 4, 8, 16, 32, and 64 mg/mL in PBS. The Rl data were continuously recorded using pressure and flow measurements and expressed as cmH2O/mL/s. Following the same anesthesia and tracheostomy procedures, BALF was obtained by lavaging the lung with 0.3 mL of sterile PBS three times through the trachea at day 60. The total number of cells in a 50 µL aliquot of BALF was quantified, followed by centrifugation of the remaining fluid at 500 g for 10 min at 4 °C. Subsequently, the cells were washed, resuspended in 100 μL of PBS, and total cell counts were determined using a hemocytometer. Cytocentrifuged preparations were stained with Liu's stain (Baso, China) for differential cell counts, with a minimum of 200 cells being classified as macrophages, lymphocytes, neutrophils, and eosinophils based on morphological characteristics.
Flow CytometryRed blood cells from BALF were lysed using an ammonium chloride lysis buffer. BALF cells were subsequently incubated with CD16/32 (Multisciences, China) to prevent nonspecific binding to Fc receptors and then stained with monoclonal antibodies (mAb) targeting murine CD45 (clone: QA17 A26), CD3 (clone: 17 A2), and CD19 (clone: 6D5), sourced from BD BioLegend. Flow Jo software version 9 (Ashland, OR) was utilized for data analysis, with populations gated based on forward- and side-scatter properties indicative of lymphocytes (SSC-FSC+) and granulocytes (SSC+FSClo), as well as antibody-specific staining fluorescence intensity. Following the removal of debris and doublets, as well as the selection of CD45+ cells, the gating strategy identified CD45+CD3+ T cells and CD45+CD19+ B cells. The percentage of each cell population was calculated based on CD45+ leukocytes.
Measurement of Cytokine Levels and HistamineCytokine levels in the BALF, specifically IFN-γ, IL- 1β, IL- 4, and IL- 6, were measured using the murine Luminex Multiplex Bead Assay from R&D Systems in accordance with the manufacturer's guidelines. Histamine and MUC5 AC levels were assessed using histamine ELISA (Biovision, San Francisco, USA) and MUC5 AC ELISA kits (XLPCC, Shanghai, China), following the respective manufacturer's instructions.
Measurement of DfE Specific AntibodiesBlood samples were collected on days 0, days 28, days 53, and days 60 by retro-orbital bleeding, allowed to clot at room temperature, and then centrifuged at 3000 rpm for 10 min. Plasma was collected and stored at − 80 °C until analyzed for DfE specific antibodies. The levels of DfE specific IgE (Cat:1110–05), IgG1 (Cat:1070–05), IgG2a (Cat:1080–05), IgG2b (Cat:1091–05), and IgG3 (Cat:1101–05) antibodies (all purchase from Southern Biotech, USA) were determined using ELISA. Briefly, 100 μL DfE solution (10 μg/mL) was added to plates (Costar, Corning Inc., NY, USA) overnight at 4℃. Plates were washed five times with PBS with tween 20 (PBST) and then blocked with 3% bovine serum albumin (BSA, Bio Froxx, China) at 37 ℃ for 2 h. Diluted plasma samples (1: 5 for IgE, 1: 100,000 for IgG, 1: 10,000 for IgG1, and 1: 100 for IgG2a, IgG2b, and IgG3 detection) were added to the plate wells and incubated for 1.5 h at 37 ℃. The plate was washed five times and then incubated with HRP conjugated goat anti-mouse IgE, IgG, IgG1, IgG2a, IgG2b, and IgG3 antibody (1: 5,000 for each antibody). After incubation for 1 h at 37 ℃, the plate was washed five times, and tetramethylbenzidine high sensitivity substrate solution (Biolegend, USA, Cat:421,501) was added, and reactions were allowed to develop at room temperature for 15 min. The absorbance was measured at 450 nm by a microplate reader (Molecular Devices Corp., Menlo Park, CA, USA).
HistopathologyThe histopathological analysis involved fixing non-washed lungs in 10% neutral-buffered formalin and embedding them in paraffin. Tissue sections measuring 5 μm were then prepared and stained with hematoxylin and eosin (H&E), as well as alcian blue and periodic acid-schiff (AB-PAS). Inflammatory cell infiltration was observed using a light microscope (DM6000B, Leica, Wetzlar, Germany) at 400 × magnification. AB-PAS staining was utilized to examine the distribution of goblet cells, while immunohistochemistry (IHC) with MUC5 AC (Abcam, ab3649, USA) was employed to assess intracellular levels of mucus in airway epithelial cells. Briefly, paraffin-embedded lung tissue sections underwent deparaffinization and treatment with 1% hydrogen peroxide to eliminate endogenous peroxidase activity. Antigen retrieval was achieved by heating the sections at 96 ℃ in 0.01 mol/L citrate buffer (pH 6.0) for 15 min. Subsequently, the sections were blocked with 10% goat serum (Hongquan BIO, China) and incubated with an anti-MUC5 AC antibody (1:100) overnight at 4 ℃. Immunodetection was carried out using the Dako Real™ EnVision™ system, Peroxidase/DAB+, Rabbit/Mouse (Code: K5007, Dako, Glostrup, Denmark). DAB was applied to the tissue sections for 5 min, followed by counterstaining with hematoxylin. Image analysis was conducted using an Aperio Imagescope (Leica Biosystems Inc, Wetzlar, Germany).
Statistical AnalysisStatistical analysis was conducted utilizing Prism software (GraphPad Software, Inc, La Jolla, CA). The bars in the figures denote the mean ± standard deviation (SD). The non-paired, non-parametric Mann–Whitney test or Kruskal–Wallis test, adjusted with the Bonferroni test for multiple comparisons, were employed to assess differences between experimental groups. Statistical significance was denoted as follows: *, #, and φ for P < 0.05; ** for P < 0.01; *** for P < 0.001.
Comments (0)