Experimental Animals
Three-week-old and eight-week-old C57BL/6 J wild-type (WT) mice, along with AR−/− mice, were obtained from Jiangsu Jicui Biotechnology Co., Ltd (Suzhou, China). The AR−/− genotyping primers: forward (5′-TAATACAAAAGAACAGTGAAAGCTG-3′) and reverse (5′-CTGCCTTGGAGTCCTTATTGC-3′). Sepsis model was established using the previous cecal ligation and puncture (CLP) method [17]. The AR antagonist enzalutamide (25 mg/kg) (MDV3100, Selleck, USA) was administered via intraperitoneal injection 30 min after CLP surgery or sham operation. Equal volumes of normal saline (NS) served as the control. Futhermore, three-week-old male C57BL/6 mice underwent bilateral orchiectomy as previously described [18]. Another group of three-week-old male C57BL/6 mice received the same surgical procedure but without testicular torsion or orchiectomy. Five weeks after recovery, all mice underwent cecal ligation and puncture surgery and were then divided into two groups: the CLP group and the CLP-orchiectomy group. All animal procedures were approved by the Ethics Committee of the Fourth Affiliated Hospital of Soochow University (Ethics No. 241008) and conducted in accordance with National Institutes of Health (NIH) guidelines.
Lung Vascular Leak Assessment and Wet to Dry Ratio
Evans blue dye was used as a marker to assess lung vascular permeability according to established protocols [19]. The amount of Evans blue extravasation was quantified and normalized to lung weight. In addition, lung tissue samples were collected and promptly weighed to measure the wet weight for evaluating the wet to dry ratio. The samples were then placed in an oven at 65 °C to remove moisture. After drying, the samples were reweighed to detect the dry weight.
Enzyme-Linked Immunosorbent Assay (ELISA)
Serum and bronchoalveolar lavage fluid (BALF) inflammatory cytokine levels, including IL-6, TNF-α, IL-1β and iNOS, were evaluated using ELISA kits. In summary, capture antibodies were applied to 96-well plates and incubated overnight at 4 °C. Following washing and blocking, the wells received both samples and standards. After further washes, detection antibodies were incubated for one hour. The reaction was stopped and absorbance was measured using a microplate reader. Cytokine concentrations were determined using standard curves derived from known recombinant cytokine concentrations.
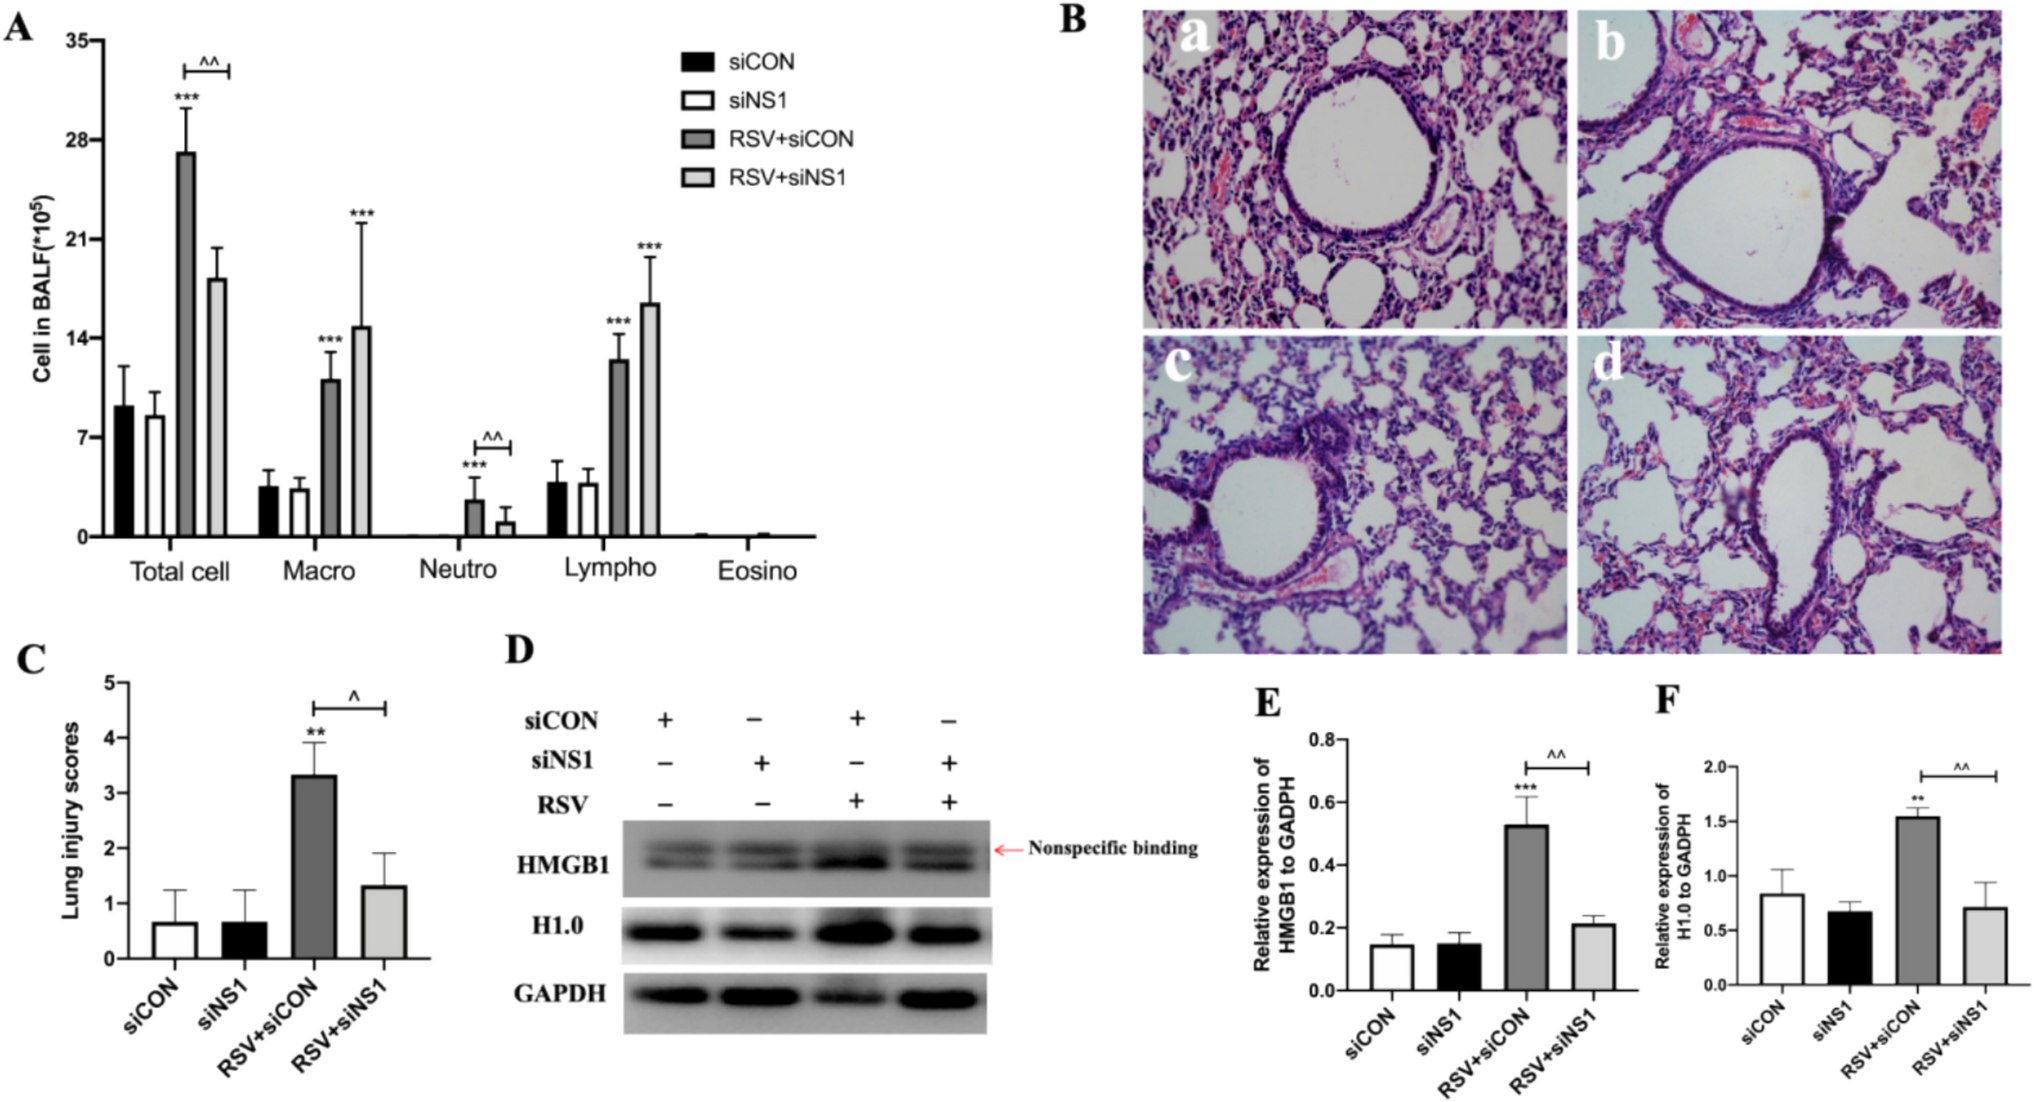
Lung Injury Score
Lung tissues were fixed in paraformaldehyde, embedded in paraffin wax, and then sectioned. These sections underwent dehydration through a series of graded ethanol solutions, were cleared with xylene, and stained with hematoxylin and eosin. Lung injury was assessed based on criteria including alveolar congestion, hemorrhage, neutrophil infiltration or aggregation within the airspaces or vessel walls, and the thickness of the alveolar wall or the presence of hyaline membranes. Each criterion was scored on a scale from 0 to 4, where 0 signifies no injury, 1 denotes mild injury, 2 represents moderate injury, 3 indicates severe injury, and 4 corresponds to very severe injury. Finally, the overall lung injury score was calculated by summing the individual scores for all criteria, providing a comprehensive assessment of lung damage.
BALF Total Protein Assay
Retain the supernatant of the BALF and detect total protein concentration with the BCA assay (P0010, Beyotime, China). Calculate the concentration based on the standard curve.
RNA Sequencing (RNA-seq)
Total RNA of lung tissues from WT and AR−/− septic mice was extracted. RNA quality and quantity were assessed. RNA sequencing was performed by NOVOGENE (Beijing, China) on the Illumina NovaSeq platform, generating 150 bp paired-end reads. mRNA was isolated, fragmented, and synthesized into cDNA, which was end-repaired, A-tailed, and ligated with sequencing adapters. The final cDNA library was amplified by PCR and quality-checked.
Weighted Gene Co-expression Network Analysis (WGCNA)
The WGCNA package was employed to analyze the gene matrix. Gene-to-gene correlations were assessed based on adjacency relationships and Pearson correlation matrices. The optimal soft-threshold power was determined by analyzing the network topology, ensuring approximate scale-free topology. Using the identified soft threshold, a network was constructed, and hierarchical clustering of genes in the network was performed based on dissimilarity measures. A hierarchical clustering tree was generated and segmented into distinct modules using the dynamic tree-cut method. Next, the adjacency matrix was transformed into a topological overlap matrix (TOM), which quantifies the network connectivity of each gene. Genes with similar expression profiles were grouped into modules through average linkage hierarchical clustering based on TOM dissimilarity. After module identification, t-tests were conducted to calculate the p-values for gene expression differences between groups. Significant modules were considered potentially associated with specific diseases. Gene ontology biological process (GO BP) and KEGG pathway enrichment analyses of the genes in key modules were performed using the DAVID database. Key genes within critical modules were visualized as a network using Cytoscape (version 3.10.2). The CytoHubba plugin was employed to calculate node weights via the EPC algorithm, identifying hub genes within these modules.
Flow Cytometry Analysis
Alveolar macrophages were isolated from BALF obtained from mice, following established protocols [20]. To minimize non-specific binding, the single-cell suspension was incubated with Fc receptor blocking solution (1 μg/test, 156603, BioLegend) for 5 min. Cells were then stained in the dark with LIVE/DEAD dye (1 μg/test, 423101, BioLegend), APC/Fire 750 anti-mouse CD11c antibody (1:100,117351, BioLegend), and KIRAVIA Blue 520 anti-mouse F4/80 antibody (1:100, 123121, BioLegend). For intracellular AR detection (1:400, 5153, CST), cells were subsequently stained with secondary PE-anti-rabbit antibody (1:500, 406420, BioLegend). Finally, cells were resuspended in PBS with 1% Fetal Bovine Serum for flow cytometry, using a BD FACSCanto II for data acquisition and FlowJo software (vesion 10.8.1) for analysis.
Cell Cultivation and Treatment
Alveolar macrophages were resuspended in RPMI 1640 (glutamine-free) containing 10% Fetal Bovine Serum, 100 U/mL penicillin–streptomycin, 2 ng/mL GM-CSF, 1 mM sodium pyruvate and 2 mM GlutaMAX. Cells were seeded in 6-well plates at 3–4 × 10⁵ cells/well in 3 mL of pre-warmed medium, with 50 μg/mL gentamicin added on the first day. The plates were incubated at 37 °C with 5% CO2. After 18 h, the medium was refreshed to remove gentamicin and incubated for an additional 2 days, refreshing the medium bi-daily until cells reached 70–80% confluence.The cells were treated with LPS (10 ng/mL, L2880, Sigma-Aldrich) for 8 h. Following the treatment, the cells were lysed for mRNA and protein analysis. For HIF1α intervention, cells were stimulated with CoCl2 (25, 50, 100 µM) or PX-478 (20 µM) for 24 h. For viral transduction, cells at 80% confluence were refreshed with medium containing LV3 (H1/GFP&Puro)-ShAR, LV3 (H1/GFP&Puro)-ShFKBP5, or LV3-NC, with 5 µg/mL polybrene, and incubated for 24 h. The medium was then replaced, and cells were cultured for another 48 h. Infection efficiency was evaluated by GFP expression using a fluorescence microscope. Sequences for Lv-ShAR: forward 5′-GGAGGTTACGCCAAAGGATTG-3′; Lv-ShFKBP5 #1: forward 5′-GCGTTATCCGTAGAATCAAAC-3′; Lv-ShFKBP5 #2: forward 5′-GCCAAGGCCAGGTTATCAAAG-3′; Lv-NC: forward 5′-TTCTCCGAACGTGTCACGT-3′.
Reverse Transcription Quantitative Polymerase Chain Reaction
Total RNA was extracted and cDNA was synthesized using the cDNA Synthesis Kit (E047, Novoprotein). The PCR protocol included an initial denaturation at 95 °C for 1 min, followed by 37 cycles of denaturation at 95 °C for 20 s, annealing at 60 °C for 20 s, and extension at 72 °C for 30 s. mRNA expression levels were quantified using the 2 − ΔΔCt method, with β-actin as the reference gene. The primer sequences for HIF1α were as follows: AR-F: TAGCAGGGCAGATCCTGTCT, AR-R: GTAGACCCTTCCCAGCCCTA; HIF1α-F: CTTGACAAGCTAGCCGGAGG, HIF1α-R: AATATGGCCCGTGCAGTGAA; FKBP5-F: TATGCTTATGGCTCGGCTGG, FKBP5-R: GAGTATCCCTCGCCTTTCCG; β-actin-F: GCAGGAGTACGATGAGTCCG, β-actin-R: ACGCAGCTCAGTAACAGTCC.
Immunofluorescence Staining
Lung tissue sections were baked and dewaxed to hydrate, followed by a 1-h incubation with immunostaining blocking buffer (P0260, Beyotime, China). The sections were treated with primary antibodies targeting anti-AR (1:200, ab133273, Abcam), anti-MPO (1:200, ab208670, Abcam), anti-CD45 (1:200, 14–0452, Invitrogen), or anti-F4/80 (1:200, ab6640, Abcam). After PBS washes to eliminate unbound primary antibodies, the sections were incubated for 1 h at room temperature with secondary antibodies conjugated to fluorescein isothiocyanate (1:1000, P0186, Beyotime, China) and cyanine 3 (1:1000, P0193, Beyotime, China). The sections underwent counterstaining with DAPI (P0131, Beyotime, China) to visualize nuclei. Fluorescent images were obtained using a Leica fluorescence microscope.
Western Blot
Protein samples were subjected to 10% SDS-PAGE and transferred onto PVDF membrane (IPVH00010, Millipore, USA). Then the membranes were incubated with primary antibodies targeting anti-AR (1:1000, Abcam, ab133273), anti-β-Actin (1:1000, CST, 4967), anti-phospho-NF-κB p65 (1:1000, CST, 3033), anti-NF-κB p65 (1:1000, CST, 8242), anti-HIF1α (1:1000, Proteintech, 20960–1-AP), anti-iNOS (1:1000, Proteintech, 18985–1-AP), anti-IL-6 (1:1000, Proteintech, 21865–1-AP), anti-FKBP5 (1:1000, Proteintech, 14155–1-AP), anti-phospho-iκKα (1:1000, CST, 2697), and anti-iκKα (1:1000, CST, 2682). After washing, the membrane was incubated with enzyme-linked secondary antibodies, and the signal was detected using a chemiluminescence imaging system. β-actin served as the internal control.
Co-immunoprecipitation (co-IP)
After removing the culture medium, cells were washed with ice-cold PBS and treated with lysis buffer. The lysates were incubated on ice for 5 min and centrifuged at 13000 g for 10 min at 4 °C. The supernatant was divided: one fraction was stored at −80 °C as the input sample, and the other was incubated with protein A/G agarose beads pre-treated with the primary antibody. The next day, the supernatant was discarded using a magnetic rack, and the immune complexes were washed five times with ice-cold lysis buffer. Both immunoprecipitated and input samples were treated with protein loading buffer and heated at 95 °C for 10 min before analysis by Western blot.
Chromatin Immunoprecipitation (ChIP)
Cells were cultured to 80% confluence, fixed with 1% formaldehyde for 10 min at 37 °C, and the reaction stopped with 125 mM glycine for 5 min. Cell pellets were resuspended in lysis buffer, sonicated to fragment DNA (200–1000 bp), and centrifuged. The supernatant was diluted and pre-cleared with protein A/G agarose beads, then incubated overnight with AR antibody (1:50, sc-7305, Santa Cruz) at 4 °C. Mouse IgG (1:500, 61656S, CST) served as a negative control. The next day, the antibody-chromatin complexes were washed and eluted with 1% SDS and 0.1 M NaHCO3. DNA was purified and analyzed by qPCR, with FKBP5 primer sequences provided as followed: forward 5′-ACCCCCATTTTAATCGGAGAAC-3′ and reverse 5′-TTTTGAAGAGCACAGAACACCCT-3′.
Testosterone Level Detection by ELISA
Serum testosterone levels were measured using a commercially available ELISA kit (EELR009, Thermo Fisher Scientific USA) according to manufacturers instructions.
Statistical Analysis
The experimental data were analyzed using GrapPad Prism version 9.0.1 (Boston, MA, USA). Measurement data are presented as mean ± standard deviation. Comparisons between two groups were conducted using unpaired t-tests, whereas one-way ANOVA was utilized for analyzing multiple groups. Pearson correlation coefficient was used to assess the relationship between variables with statistical significance defined as p < 0.05.


Comments (0)