Study population
The National Center for Health Statistics (NCHS) assesses the health of the noninstitutionalized U.S. population through NHANES interviews, physical examinations, and laboratory tests. In this study, we examined the relationships of self-rated health, healthcare access, and healthcare utilization with epigenetic age using publicly available data from the 1999–2000 and 2001–2002 NHANES cycles. Our sample included 2,532 adults aged 50 years and older. To protect participant privacy, NHANES top-coded the ages of individuals 85 years and older as 85 years (n = 130), making their exact chronological ages unknown. We excluded these participants to prevent misclassification errors in epigenetic age measures. We also removed individuals whose DNAm-predicted sex did not match their self-reported sex (n = 56), resulting in a final sample of 2,346 participants. Of these, 2,343 had data on self-rated health status (n = 3 missing). All participants provided written informed consent, and the NCHS Research Ethics Review Board approved the study protocols (protocol #98–12).
Self-rated health
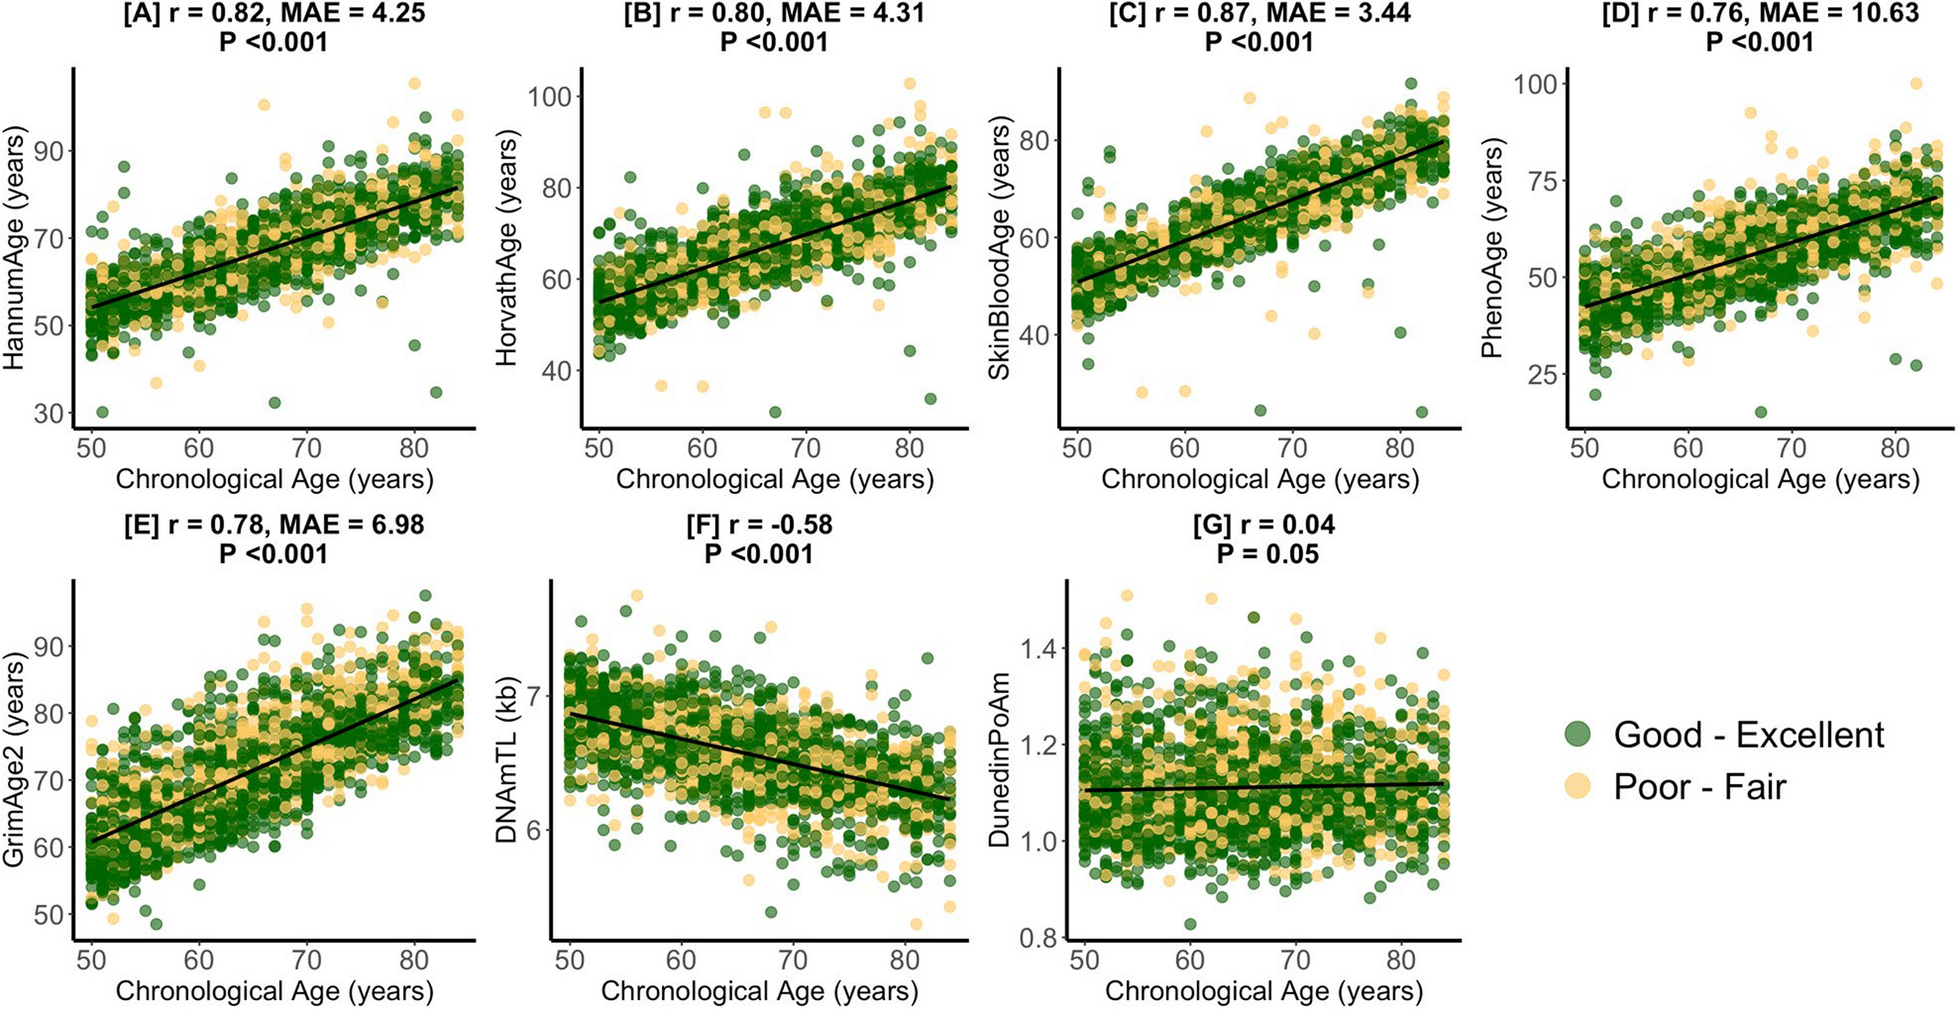
As part of the “Hospital Utilization & Access to Care” questionnaire [20, 21], participants provided information on self-rated health by answering the question, “Would you say your health in general is …” with possible responses of “Excellent”, “Very good”, “Good”, “Fair” or “Poor.” Participants who declined to respond, were unsure of their health status, or had missing data were excluded from the analyses. To increase statistical power for comparisons across groups, we dichotomized self-rated health into two categories: “Good–Excellent” health and “Poor-Fair” health.
Although our analysis is based on cross-sectional data, we considered changes in health status over time by including a measure of self-reported health compared to the previous year. Participants were asked, “Compared with 12 months ago, would you say your health is now…” with response options: “Better”, “Worse”, or “About the same.” Those who declined to respond, were unsure of their health status, or had missing data were excluded from the analyses.
Healthcare access
Our analysis included two measures of healthcare access available in both 1999–2000 and 2001–2002 NHANES cycles. First, participants were asked, “Is there a place that you usually go when you are sick or need advice about your health?” Responses were coded as “Yes” if participants responded “Yes” or “There is more than one place.” Responses were coded as “No” if they responded, “There is no place.” Subsequently, participants were asked, “What kind of place do you go to most often: is it a clinic, doctor’s office, emergency room, or some other place?” Responses were, “Clinic or health center,” “Doctor’s office or HMO,” “Hospital emergency room,” “Hospital outpatient department,” or “Some other place.” For this variable, “hospital emergency room” was set as the reference group because emergency departments are never closed and cannot deny treatment based on a patient’s ability to pay [22]. For both healthcare access measures, participants who declined to respond, were unsure of their response, or had missing data were excluded from the analyses.
Healthcare utilization
We included two measures of healthcare utilization available in both 1999–2000 and 2001–2002 NHANES cycles. First, participants were asked, “During the past 12 months, how many times have you seen a doctor or other health professional about your health at a doctor’s office, a clinic, hospital emergency room, at home or some other place? Do not include times you were hospitalized overnight.” Responses included “None”, “1,” “2 to 3,” “4 to 9,” “10 to 12,” “13 or more.” After analyzing all participant answers, “4 to 9” was the median, so we dichotomized the variable as “ < 10” and “ ≥ 10 visits” as a way of designating high visit utilizers. Second, participants were asked, “During the past 12 months, were you a patient in a hospital overnight? Do not include an overnight stay in the emergency room.” Responses were coded as “Yes” or “No.” For all healthcare utilization measures, participants with missing data, uncertain responses, or who declined to answer were excluded from the analyses.
DNA methylation and epigenetic age
We obtained epigenetic age measures and DNA methylation-based leukocyte proportion estimates from the NHANES website (https://wwwn.cdc.gov/nchs/nhanes/dnam/), which also provides detailed information on DNA methylation analysis and processing. Briefly, DNA was extracted from whole blood samples collected from NHANES participants aged 50 years and older during the 1999–2000 and 2001–2002 cycles. Genome-wide DNA methylation was then assessed using the Illumina EPIC BeadChip array.
Our study included seven epigenetic age measures: HannumAge, HorvathAge, SkinBloodAge, PhenoAge, GrimAge2, DunedinPoAm, and DNA methylation-based Telomere Length (DNAmTL). These measures were selected a priori based on their well-established associations with health outcomes [1,2,3,4,5,6, 23, 24]. The HannumAge, HorvathAge, and SkinBloodAge measures primarily predict chronological age based on DNA methylation patterns, although research has linked them to broader health indicators [1, 2, 24, 25]. PhenoAge, a leading biomarker of healthspan, was developed using a composite measure of nine clinical variables: albumin, creatinine, glucose, C-reactive protein, lymphocyte percentage, mean cell volume, red cell distribution width, alkaline phosphatase, and white blood cell count [6]. GrimAge2, a lifespan biomarker, integrates chronological age, gender, and ten DNA methylation surrogates for cigarette pack-years and plasma protein markers, including adrenomedullin (ADM), beta-2-microglobulin (B2M), C-reactive protein (CRP), cystatin C, growth differentiation factor-15 (GDF-15), hemoglobin A1c (A1c), leptin, plasminogen activator inhibitor-1 (PAI1), and tissue inhibitor metalloproteinase-1 (TIMP1) [4]. DNAmTL estimates telomere length based on DNA methylation patterns [5]. DunedinPoAm measures the pace of biological aging by assessing morbidity-related biomarkers. This metric was developed by analyzing longitudinal changes in 18 organ function biomarkers among individuals of the same chronological age, offering a robust indicator of aging pace [3]. As our analysis utilized epigenetic aging measures publicly available in NHANES, we could not include more recent clocks like DunedinPACE, which were not available at the time of this study.
Statistical analysis
We used the R ‘Survey’ package to perform generalized linear regression models, incorporating NHANES-provided participant sample weights designed for the epigenetic clock subsample [26]. To examine the associations between self-rated health, healthcare access, and healthcare utilization with each epigenetic age measure, we applied the svyglm function in R, which accounts for the survey’s complex design. Our main model covariates were determined a priori and included chronological age (continuous, in years) and its quadratic term, sex (female vs. male), and self-identified ethnicity/race (Non-Hispanic White, Mexican American, Other Hispanic, Non-Hispanic Black, Other Race). We also adjusted for health insurance (yes vs. no), education level (less than high school, high school diploma/GED, more than high school), occupation (white-collar/professional, white-collar/semi-routine, blue-collar/high-skill, blue-collar/semi-routine, or no work), and poverty-to-income ratio (continuous), alcohol intake (abstainer, moderate drinker, heavy drinker), body mass index (BMI [kg/m2]; continuous), smoking status (never, former, current), and physical activity (moderate/vigorous activity in the last 30 days: yes vs. no). Health access and utilization models also included self-rated health status as a covariate. When self-rated health, healthcare access, and healthcare utilization were associated with GrimAge2, we used the same covariate adjustments in models examining associations with DNAm-predicted blood biomarker components of GrimAge2 to test drivers of associations. To address missing covariate data, we used multiple imputation via the MICE function in R, generating 10 imputed datasets. The estimates from these datasets were then pooled using the pool function in R [27]. Because healthcare utilization is strongly correlated with chronological aging, we conducted a secondary analysis where we employed the same modeling framework—omitting adjustments for chronological age—to compare associations of self-rated health, healthcare access, and healthcare utilization with chronological age versus those observed with epigenetic age biomarkers.
We performed five sensitivity analyses. To assess the impact of leukocyte proportions on our results, the first sensitivity analysis involved models that included additional adjustments for estimated leukocyte proportions (B cells, CD4 cells, CD8 cells, NK cells, monocytes, and neutrophils). To evaluate the impact of health insurance on our results, the second sensitivity analysis involved models that did not include health insurance as a covariate. Given that health status has strong relationships with healthcare access and utilization, the third sensitivity analysis involved healthcare access and utilization models that did not include self-rated health status as a covariate. To assess the impact of dichotomization of self-rated health status on our analysis, we conducted a fourth sensitivity analysis exploring associations of self-rated health status in its discrete categories with epigenetic aging. Finally, given previously reported differences in directly measured telomere length versus DNAmTL [28], for measures associated with DNAmTL, we applied the same covariate framework to examine their relationships with directly measured leukocyte telomere length available in NHANES. Directly measured telomere length was quantified from whole blood DNA using quantitative PCR, which determines the relative telomere repeat copy number to single-copy gene copy number (T/S ratio) [29]. The T/S ratio was then converted to kilobase (kb) pairs using the formula: 3,274 + 2,413 × (T/S)/1,000 [30]. These methods have been previously described [31]. All statistical analyses were conducted using R Version 4.4.1 (R Core Team, Vienna, Austria). To account for multiple comparisons across seven independent epigenetic clocks, statistical significance was set at a Bonferroni-adjusted p-value of < 0.007 (0.05/7). P-values < 0.05 were considered marginal.


Comments (0)