Diabetic mice
C57BL/6 mice (8 weeks, male) were divided into two groups: control (NC) and DR. To induce the DR model, mice received intraperitoneal injections of streptozotocin (STZ, #S0130, Sigma-Aldrich, USA) in 10 mmol/L citrate buffer or vehicle (citrate buffer control) for 5 consecutive days. Mice with blood glucose levels above 13.9 mmol/L one week post-injection were considered diabetic mice [19]. Three months after the induction of diabetes, retinal vascular leakage was detected to determine whether there were DR-related changes, including Evans blue (EB) dye leakage and fundus fluorescein angiography.
EB dye leakage
Diabetic and age-matched non-diabetic control mice were injected with 5% EB (100 mg/mL, #E2129, Sigma-Aldrich, USA) via the angular vein. After ensuring systemic circulation of EB by placing the mice on a warm pad at 37 °C for 2 h, eyeballs were collected and fixed in 4% paraformaldehyde for 30 min. Retinas were carefully removed and EB leakage in retinal vessels was observed using confocal microscopy.
Fluorescein fundus angiography (FFA)
Mice were anesthetized via intraperitoneal injection of 1.25% avertin (20 μl/g). Prior to imaging, pupil dilation was achieved using topical application of a 0.5% tropicamide/0.5% phenylephrine mixture. Fluorescein sodium (Alcon Laboratories, USA) was administered intraperitoneally at 5 μl/g body weight [20]. Using a Micron IV Retinal Imaging Microscope (Phoenix Research Labs, USA), imaging begins at 3 min post-injection with brightfield alignment, followed by fluorescence capture at 5, 10, 15, and 20 min (488 nm excitation/520 nm emission).
Reduced representation bisulfite sequencing (RRBS), transcriptome sequencing and single-cell sequencing
Retinal DNA was extracted, qualified, and subjected to bisulfite treatment using the EZ DNA Methylationgold™ Kit (#D5006, Zymo Research, USA), followed by PCR amplification to obtain the final DNA library. Sequencing results were reverse-complemented and aligned with the reference genome. Differentially methylated genes (DMGs) were identified through statistical analysis. Concurrently, transcriptome analyses quantified gene expression, identifying differentially expressed genes (DEGs). Intersection of DMG and DEG datasets revealed aberrantly methylated genes in DR, including hypermethylated down-regulated and hypomethylated up-regulated genes. Details of single-cell sequencing are provided in our previous studies [21]. Raw single-cell data generated by Illumina platforms were preprocessed using Cell Ranger to obtain gene expression matrices. These matrices were imported into Seurat for analysis, with batch effect correction performed via Harmony. Elbow Plot identified 30 principal components as optimal, followed by dimensionality reduction visualization using RunTSNE and RunUMAP. Cells were clustered via Find Neighbors and classified into homogeneous groups with Find Cluster, yielding final clustering results. Marker genes for distinct subpopulations were identified using Find All Markers, enabling cell type annotation based on marker gene signatures.
Cell culture, transfection and inhibitor treatments
Consistent with single-cell RNA sequencing and immunofluorescence staining results, human retinal microvascular endothelial cells (HRMECs) were selected as the cell model. HRMECs were obtained from Applied Cell Biology Research Institute (#ACBRI 181; Kirkland, USA) and cultured as described in the supplementary document [22]. Cells were treated with different concentrations (5 μM, 10 μM, 20 μM) of GSK3β inhibitor (#BRD3731, MedChemExpress, USA) for 48 h.
The PLTP expression plasmid (OE-PLTP, pcDNA3.1-PLTP) was purchased from Hanbio (Shanghai, China) and transfected using Lipofectamine™ 3000 (#L3000008, Thermo Fisher Scientific, USA). Small interfering RNAs targeting PLTP (siPLTP), DNMT1 (siDNMT1), DNMT3B (siDNMT3B) and negative control (siNC) were purchased from RiboBio (Guangzhou, China), and transfected using Lipofectamine® RNAiMAX transfection reagent (#13,778,075, Thermo Fisher Scientific, USA).
DNA extraction, bisulfite conversion, and methylation-specific PCR (MS-PCR)
Procedures and reagents were as described in the supplementary document. The intensity of methylated to unmethylated bands (M/U) was analyzed and quantified. Primers were obtained from Sangon Biotech (Shanghai, China) and are listed in Table 1.
Table 1 Methylation specific PCR primersRNA extraction and real-time PCR
Procedures and reagents were as described in the supplementary document. Specific primers were obtained from Sangon Biotech (Shanghai, China) and are listed in Table 2. β-Actin served as the housekeeping gene.
Table 2 Real-time PCR primersProtein extraction and western blotting (WB)
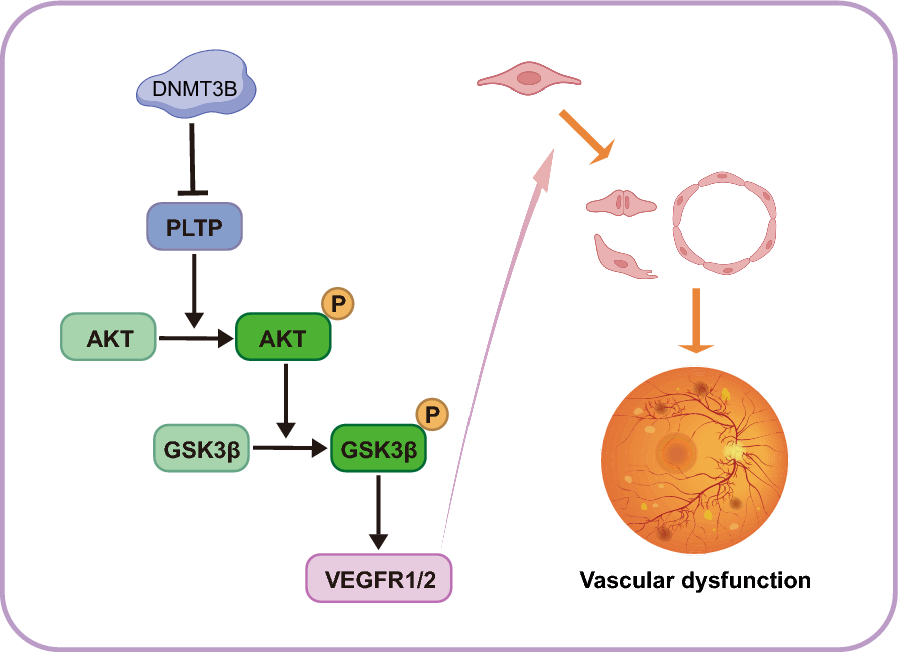
Proteins extracted from HRMECs were separated by 4–20% SDS-PAGE (#M00930, GenScript, USA) and transferred onto polyvinylidene fluoride membranes (#IPVH00010, Millipore, Ireland). After blocking with 5% nonfat milk or bovine serum albumin (BSA, #4240, BioFroxx, Germany) for 2 h, membranes were incubated with primary antibodies against PLTP (1:1500, #PA5-102,820, Thermo Fisher Scientific, USA), DNMT1 (1:1000, #ab188453, Abcam, UK), DNMT3A (1:1000, #ab307503, Abcam, UK), DNMT3B (1:1000, #PA5-91,864, Thermo Fisher Scientific, USA), PI3K (1:1000, #4249 T, Cell Signaling Technology, USA), AKT (1:1000, #4685S, Cell Signaling Technology, USA), phosphorylated AKT (p-AKT, 1:1000, #4060 T, Cell Signaling Technology, USA), GSK3β (1:4000, #22,104–1-AP, Proteintech, China), phosphorylated GSK3β (p-GSK3β, 1:1000, #29,125–1-AP, Proteintech, China), VEGFR1 (1:3000, #ab32152, Abcam, UK) or VEGFR2 (1:1000, #ab39638, Abcam, UK). Secondary antibodies (1:50,000, #98,261 and #97,910, Jackson ImmunoResearch, USA) were used. β-ACTIN (1:30,000, #66,009–1-Ig, Proteintech, China) served as standard controls. ImageJ software was employed to analyze the ratio of phosphorylated AKT to AKT (p-AKT/AKT) or phosphorylated GSK3β to GSK3β (p-GSK3β/ GSK3β).
Cell migration and tube formation assays
Cell Migration: A total of 5 × 10⁴ cells from each group were seeded in 200 μl serum-free medium and observed after 16–18 h of migration. Tube Formation: HRMECs were seeded at 8000 cells per well in 50 μl of complete medium and at 37 °C for 3–4 h. Specific procedures and reagents were as described in the supplementary document. Migrating cells and tubular networks were imaged and quantified by ImageJ software.
Enzyme-linked immunosorbent assay (ELISA)
The level of IL-1β (ab214025, Abcam, UK) and IL-18 (ab215539, Abcam, UK) protein was determined using a colorimetric ELISA kit according to the manufacturer’s instructions.
Luciferase reporter assay
The PLTP promoter was constructed upstream of the firefly luciferase (FLuc) in the pGL3-basic vector, and DNMT3B was constructed into the pcDNA3.1 vector with renilla luciferase (Rluc). Co-transfection into cells was followed by luciferase activity measurement to analyze FLuc/Rluc activity in response to PLTP promoter activity.
RNA extraction, library construction, illumina sequencing (RNA-Seq), and data analysis
Total RNA was extracted from HRMECs using TRIzol reagent (#15596018CN, Invitrogen, USA). Differential expression analysis of the two groups was performed using the DESeq2 R package. Transcripts with a fold change > 2 or < -2 and a adjusted p value < 0.05 were considered differentially expressed genes. Gene Ontology (GO) and Kyoto Encyclopedia of Genes and Genomes (KEGG) pathway enrichment analyses were conducted by the clusterProfiler R package. GO terms and KEGG pathways with p < 0.05 were considered significantly enriched.
Coimmunoprecipitation (co-IP)
Co-IP assays were performed to investigate interactions between PLTP and AKT or GSK3β. Co-IP was conducted using the Pierce CO-IP Kit (#26,149, Thermo Fisher Scientific, USA). Cells were lysed in IP lysis buffer containing a protease/phosphatase inhibitor cocktail. The anti-PLTP antibody was immobilized with AminoLink Plus coupling resin or control resin at room temperature for two hours. The cell lysates were incubated overnight at 4 °C, with agarose resin conjugated to the anti-PLTP antibody and with control agarose resin not bound to PLTP. Western blotting was used to analyze the eluted immunoprecipitated samples after washing.
Immunofluorescence staining
Retinas from DR mice and non-diabetic controls were fixed for 10 min at -20 °C and incubated with antibodies against von Willebrand factor (vWF; endothelial cell marker) and PLTP, followed by secondary antibodies conjugated with Alexa Fluor 488 (#ab150117, Abcam, UK) and Alexa Fluor 647 (#ab150075, Abcam, UK) respectively. Arrowheads show areas that co-express vWF and PLTP which surround retinal endothelial cells. Nuclei were stained with 4′,6-diamidino-2-phenylindole (DAPI).
Statistical analysis
Data are presented as means ± standard deviations. Differences between groups were analyzed using 2-tailed Student’s t-test by GraphPad Prism (ver. 8.0; San Diego, USA) and SPSS (ver. 26.0; Chicago, USA). Notably, p < 0.05 was considered statistically significant.


Comments (0)