
Remember me
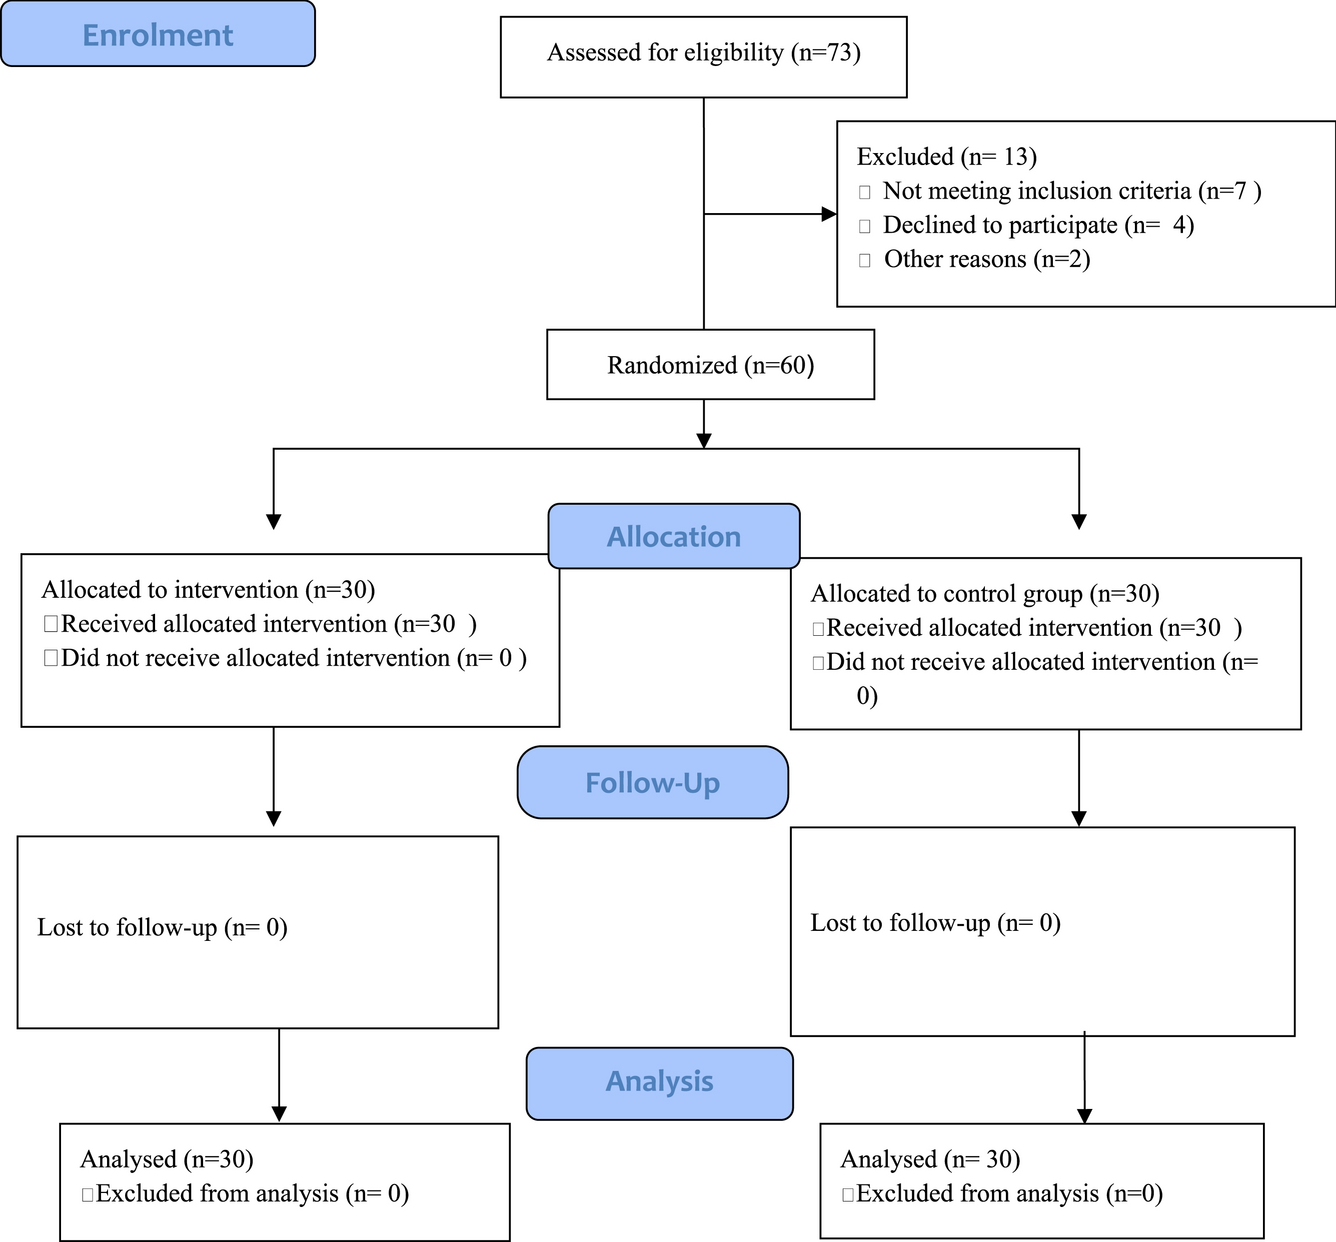
One hundred thirty-five patients were identified on initial screening. After excluding patients without confirmed trauma (n = 6) or radiographically confirmed thrombus (n = 17), we entered 112 patients into our final analysis. Over the 9-year inclusion period, roughly 10,000 patients (~ 1,100 per year) were admitted to our trauma center with a diagnosis of TBI, leading to an estimated tVST diagnosis rate of 1.12%.
Demographic and Injury CharacteristicsDemographic and injury information is shown in Table 1. Patients were predominantly male (76.8%) and had a mean age of 44 years (min–max: 14–93). Mild (GCS scores 13–15), moderate (GCS scores 9–12), and severe TBI (GCS scores 3–8) was found in 60.7%, 12.5%, and 26.8% of our cohort, respectively. The median admission GCS score was 14 (IQR 8–15).
Table 1 Patient characteristics and injury profileThe most frequent mechanisms of injury were ground-level fall (25.9%, n = 29), assault (23.2%, n = 26), fall from height (18.8%, n = 21), pedestrian vs. automobile (15.2%, n = 17), bicycle/scooter/skateboard vs. automobile (8.9%, n = 10), and motor vehicle collision (0.9%, n = 1). Eight patients (7.1%) were found unresponsive with unknown mechanisms of injury.
Traumatic venous sinus thrombosis was diagnosed on vascular imaging within 24 h of hospital arrival in 100 patients (89.3%). Fifty-nine patients (52.7%) underwent CTV, and 48 patients (42.9%) underwent CTA with delayed venous-phase timed contrast. Five patients (4.5%) underwent CT scanning but had incomplete data regarding intravenous contrast timing.
One hundred nine patients (97.3%) had skull fractures on initial imaging. Traumatic venous sinus thrombosis was predominantly located near a skull fracture (Fig. 1). Fractures were observed most frequently in the parietal bone (55.4%), occipital bone (53.6%), temporal bone (47.3%), and skull base (33%). Fractures were seen least commonly in the frontal (17.0%) and orbital bones (15.2%). Intracranial hemorrhage was identified in 110 (98.2%) patients. Ninety-four patients (83.9%) had subdural hemorrhage, 89 patients (79.5%) had subarachnoid hemorrhage, and 72 patients (64.3%) had epidural hemorrhage. Cerebral contusion was noted in 80 patients (71.4%).
Fig. 1
Representative skull fractures. Representative skull fractures from blunt and penetrating head trauma are shown, each fracture associated with venous sinus thrombosis. a, A 76-year-old female victim in pedestrian vs. automobile accident with fractures of the left occipital bone and skull base was found to have thrombus in the left transverse sinus. b, A 40-year-old man who sustained a gunshot wound to the head suffered skull fractures of the right parietal, occipital, and temporal bones, as well as thrombosis of the right transverse venous sinus. c, A 30-year-old man, also a victim of a gunshot wound to the head, was found to have skull fractures of the left and right parietal bones across the vertex, as well as superior sagittal venous sinus thrombosis. d, A 23-year-old woman who fell down the stairs and sustained a skull base fracture was found to have thrombus at the confluence of the sinuses (torcula)
The overall distribution of tVST is shown in Fig. 2. Traumatic venous sinus thrombosis was found most frequently in the transverse (58.9%) and sigmoid sinuses (41.1%), with similar frequency between right and left sides. Thirty-six patients (32.1%) developed tVST in the superior sagittal sinus, and six patients developed thrombus in the torcula (5.4%). Four patients with torcula involvement presented with GCS scores ≤ 8. We found no cases of internal cerebral vein thrombosis. Thrombus extended into the internal jugular vein in 27 patients (24.1%). Fifty patients (44.6%) developed tVST in two or more venous sinuses. Twelve patients (10.7%) were found to have thrombus in both superior (superior sagittal sinus) and lateral (transverse or sigmoid) sinuses. These patients presented with a lower median GCS score than the overall cohort (7 vs. 14, IQR 3–8 vs. 8–15).
Fig. 2
Traumatic venous sinus thrombosis heat maps. Sagittal volume-rendered CT venography projection of heat map based on tVST location frequency. CT computed tomography, tVST traumatic venous sinus thrombosis
Clinical Characteristics and Treatment DifferencesLeukocytosis was present on admission in 47 patients (42%). Dehydration was documented in only nine patients (8%). Treatments for VST, ICP elevation, and seizures are shown in Table 2. Nineteen patients experienced seizures, 52.6% of which had focal semiology. Ninety-eight patients (87.5%) received 7 days of seizure prophylaxis per our TBI protocol, and 19 patients (17%) continued anticonvulsant therapy beyond the prophylaxis period for active seizure management. Intracranial pressure monitoring was performed in 58 patients (51.8%) with either an EVD catheter, parenchymal ICP sensor, or both. Seventeen patients required interventions for refractory ICP elevations, of whom 94.1% had multiple tVST. Hyperosmolar therapy was administered to 25.0% of patients. Thirty patients (26.8%) underwent cerebrospinal fluid diversion via EVD, and ten patients (8.9%) required decompressive surgery.
Table 2 Interventions and treatmentsFourteen patients were prescribed antithrombotic therapy (AT) prior to admission (12 on aspirin, 1 on rivaroxaban, and 1 on apixaban). Fifty-four patients (48.2%) were initiated on AT during their hospital admissions. Fifteen patients (13.4%) received therapeutic systemic AC, and 39 patients (34.8%) received AP medications. The other 58 patients (51.8%) were managed conservatively with hydration and symptom management. Most of the AP group was prescribed daily low-dose aspirin (81 mg), except for one patient who was prescribed full-dose aspirin (325 mg) for unclear reasons and two patients who were prescribed clopidogrel because of an aspirin allergy. The timing of AT initiation was decided by the neurosurgery attending physician and ranged anywhere from 2 to 14 days post injury. At least four patients were instructed to start taking aspirin 7 days post injury after hospital discharge. Eight patients were prescribed AP as a bridge to AC, and two were switched from AP to AC after tVST propagation was discovered on repeat imaging. Three patients were initiated on AC for reasons other than tVST (two for DVTs, one for pulmonary embolism). The median GCS scores were 10 (IQR 7–14) in the AC group, 14 (10.5–15) in the AP group, and 14 (7.2–14) in the conservative management group. Supportive therapy with intravenous fluid was documented in only 32 patients (28.6%), but this may be an underestimate given the higher number of patients in the conservative management group.
Clinical and Radiographic OutcomesMortality occurred in 23 patients (20.7%), 16 of whom (69.6%) arrived with GCS scores ≤ 8. Withdrawal of life-sustaining therapies was noted for 16 (69.6%) deceased patients. Cause of death was missing for three patients. Patients who survived to hospital discharge were younger, more often male, and had a higher GCS score on arrival. In a Cox proportional hazards model, AT treatment was associated with a higher chance of survival to hospital discharge (hazard ratio [HR] 0.29, 95% confidence interval [CI] 0.12–0.73). Anticoagulant treatment yielded the strongest, though not statistically significant, association with survival to hospital discharge (hazard ratio [HR] 0.18, 95% confidence interval [CI] 0.02–1.32). Antiplatelet treatment was also associated with a higher likelihood of survival to hospital discharge (hazard ratio [HR] 0.337, 95% confidence interval [CI] 0.13–0.90). Hazard ratios for additional covariates were as follows: age, hazard ratio (HR) 1.04 (95% confidence interval [CI] 1.02–1.06); female sex, hazard ratio (HR) 1.12 (95% confidence interval [CI] 0.45–2.80); and emergency department (ED) GCS, hazard ratio (HR) 0.78 (95% confidence interval [CI] 0.71–0.85). Because of the small number of events spread across three treatment groups, we did not examine multivariable models. A comparison of outcomes by treatment group is shown in Table 3.
Table 3 Patient characteristics and outcomes by treatment strategyHospital LOS ranged from 0 to 174 days, with a median of 6 days (IQR 3–14). We did not observe any association between LOS and survival to hospital discharge (HR 0.98, 95% CI 0.95–1.01). The median LOS was 24 days (IQR 3–43) for AC-treated patients, 10 days (IQR 3–16) for AP-treated patients, and 4 days (IQR 2–9) for conservatively managed patients. Forty-nine patients (43.8%) were discharged home, and 20 patients (17.9%) were discharged to a rehabilitation facility. Seventeen patients (15.2%) were transferred to their in-network health care institutions because of repatriation agreements. Privately insured patients did not return to our system for outpatient care, resulting in very limited follow-up data.
Our study was not powered to determine the statistical significance of bleeding complication rates between tVST management strategies, and a likelihood ratio test of time to bleeding complication across the three treatments was not significant (p = 0.18). We observed more bleeding complications in AT-treated patients (HR 3.53, 95% CI 0.75–16.66). However, intrinsic differences between treatment groups made this observation difficult to interpret. Patients who were too severely injured to initiate AT because of ongoing intracranial or systemic bleeding and patients whose families opted for WOLST were more likely to receive conservative management. Bleeding occurred in three patients on AC (21.4%; HR 4.70, 95% CI 0.78–28.16), five patients on AP (12.8%; HR 3.08, 95% CI 0.60–15.87), and two patients (3.4%) receiving conservative management. Female sex was associated with a higher bleeding risk (HR 3.57, 95% CI 1.03–12.39). The most frequent bleeding complication was gastrointestinal bleeding (n = 6), followed by new/worsened intracranial hemorrhage (n = 3; including one patient who required a decompressive hemicraniectomy as a result). The remaining bleeding events were attributed to other trauma-related injuries.
Follow-up imaging was available at varying time intervals for 52 patients. Imaging was available at 30 days post injury for only 23 patients (AC, 5 patients; AP, 12 patients; no AC/AP, 6 patients). Follow-up imaging consisted of CT or MR imaging with venous-phase timed contrast. Twenty-nine patients (25.9%) underwent CTV, 8 patients (7.1%) underwent CTA with delayed venous-phase contrast, and 15 patients (13.4%) underwent MR venography. Traumatic venous sinus thrombosis recanalization was noted in 15 patients (28.9%) by 30 days post injury and in 26 patients (50%) by 6 months post injury. Among the 15 patients with tVST recanalization by 30 days post injury, 3 were treated with AC, 9 were treated with AP, and 3 were treated with conservative management.
Within the AC group, 14 patients (93.3%) survived to hospital discharge, and 3 patients (20%) had thrombus recanalization at 6 months. Within the AP group, 36 patients (92.3%) survived to hospital discharge, and 14 patients (35.9%) had thrombus recanalization at 6 months. Within the conservative management group, 39 patients (67.2%) survived to hospital discharge, and 9 patients (15.5%) had recanalization by 6 months. After excluding patients who did not survive, we noted recanalization by 6 months in 21.4% of AC-treated patients, 38.9% of AP-treated patients, and 23.1% of conservatively managed patients.
Comments (0)