
Remember me
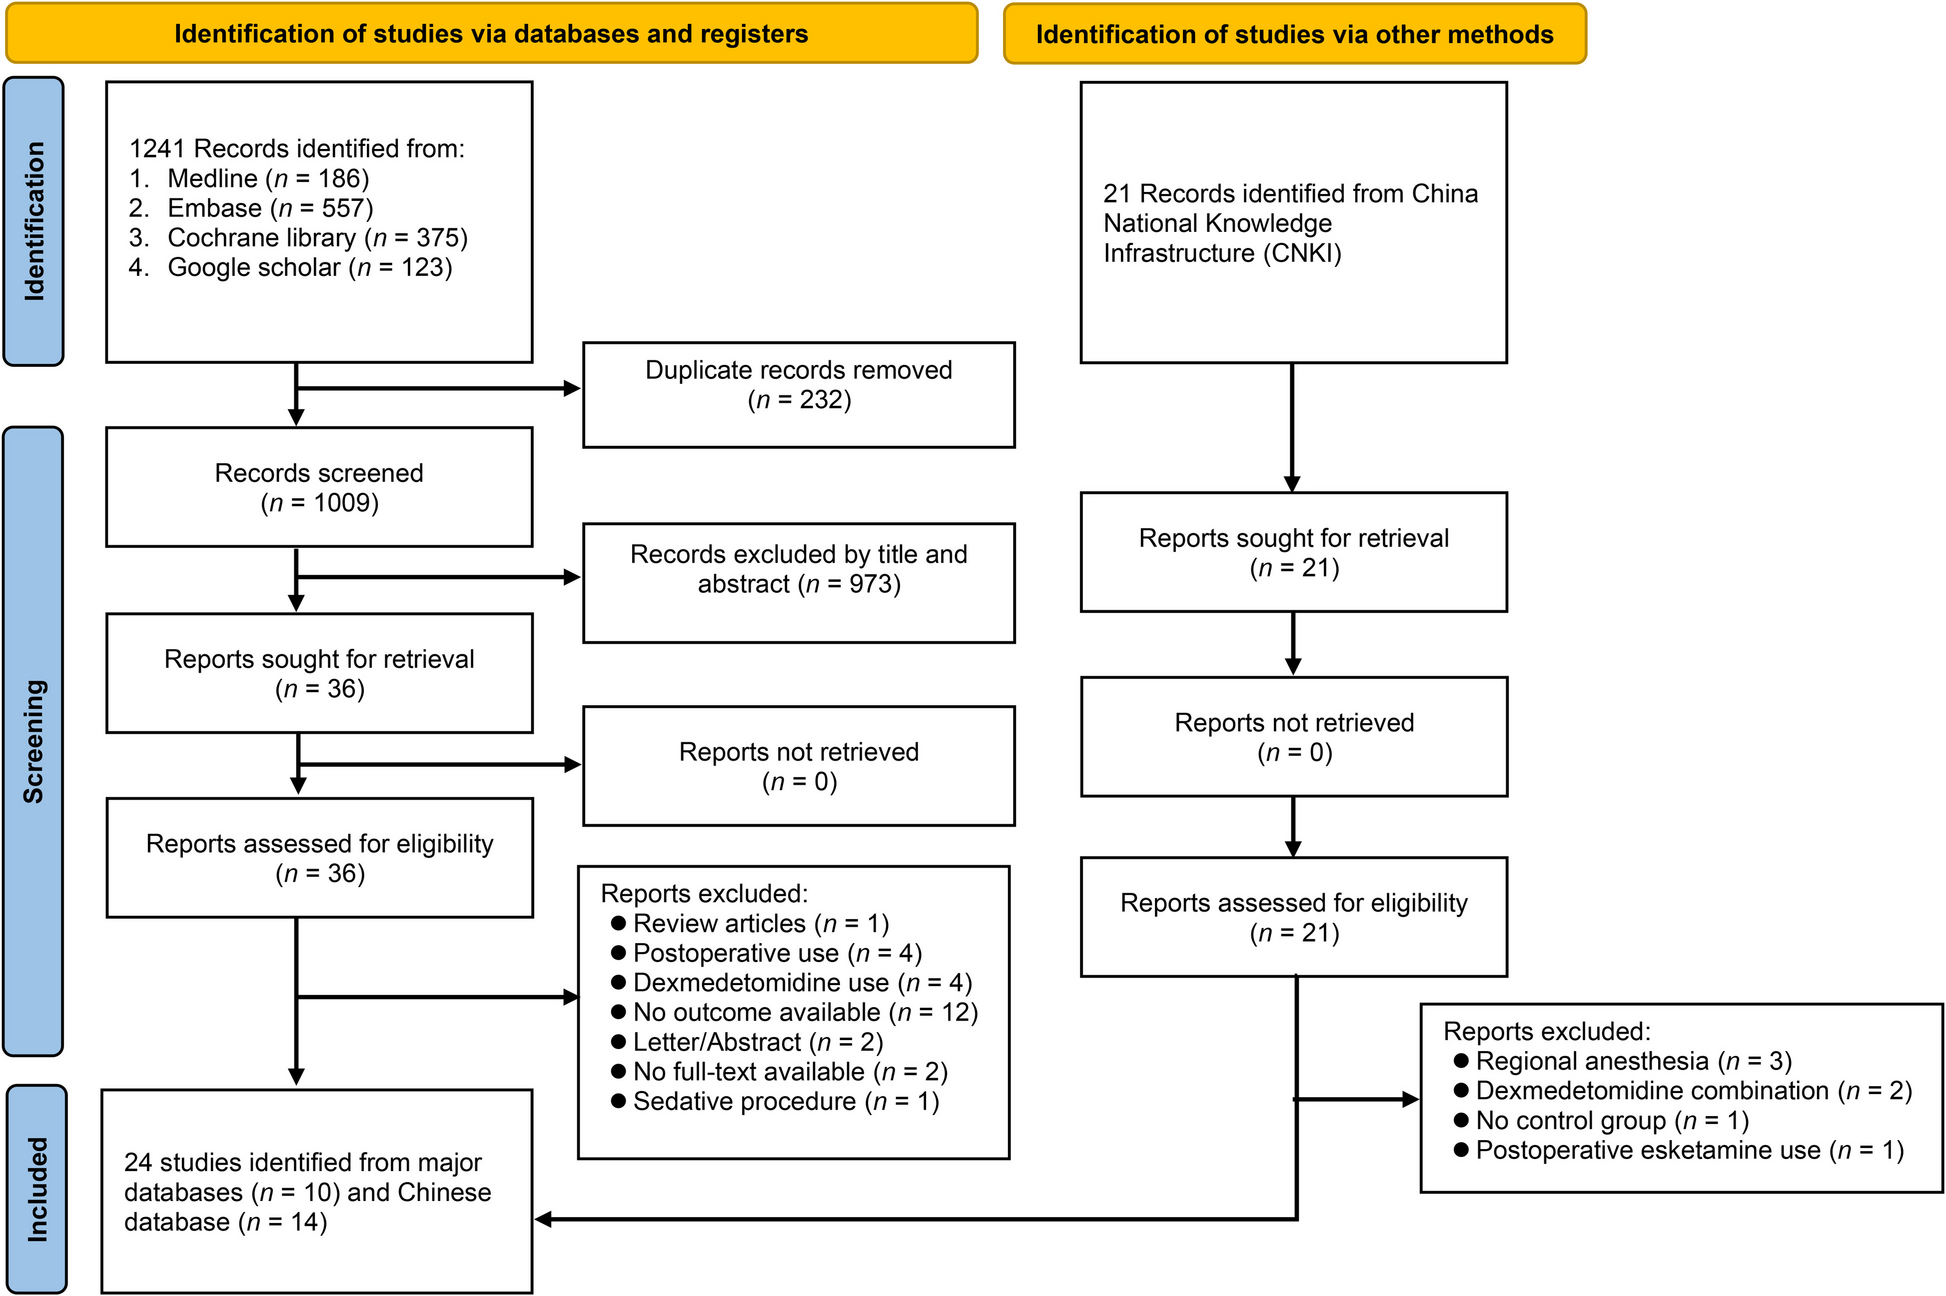
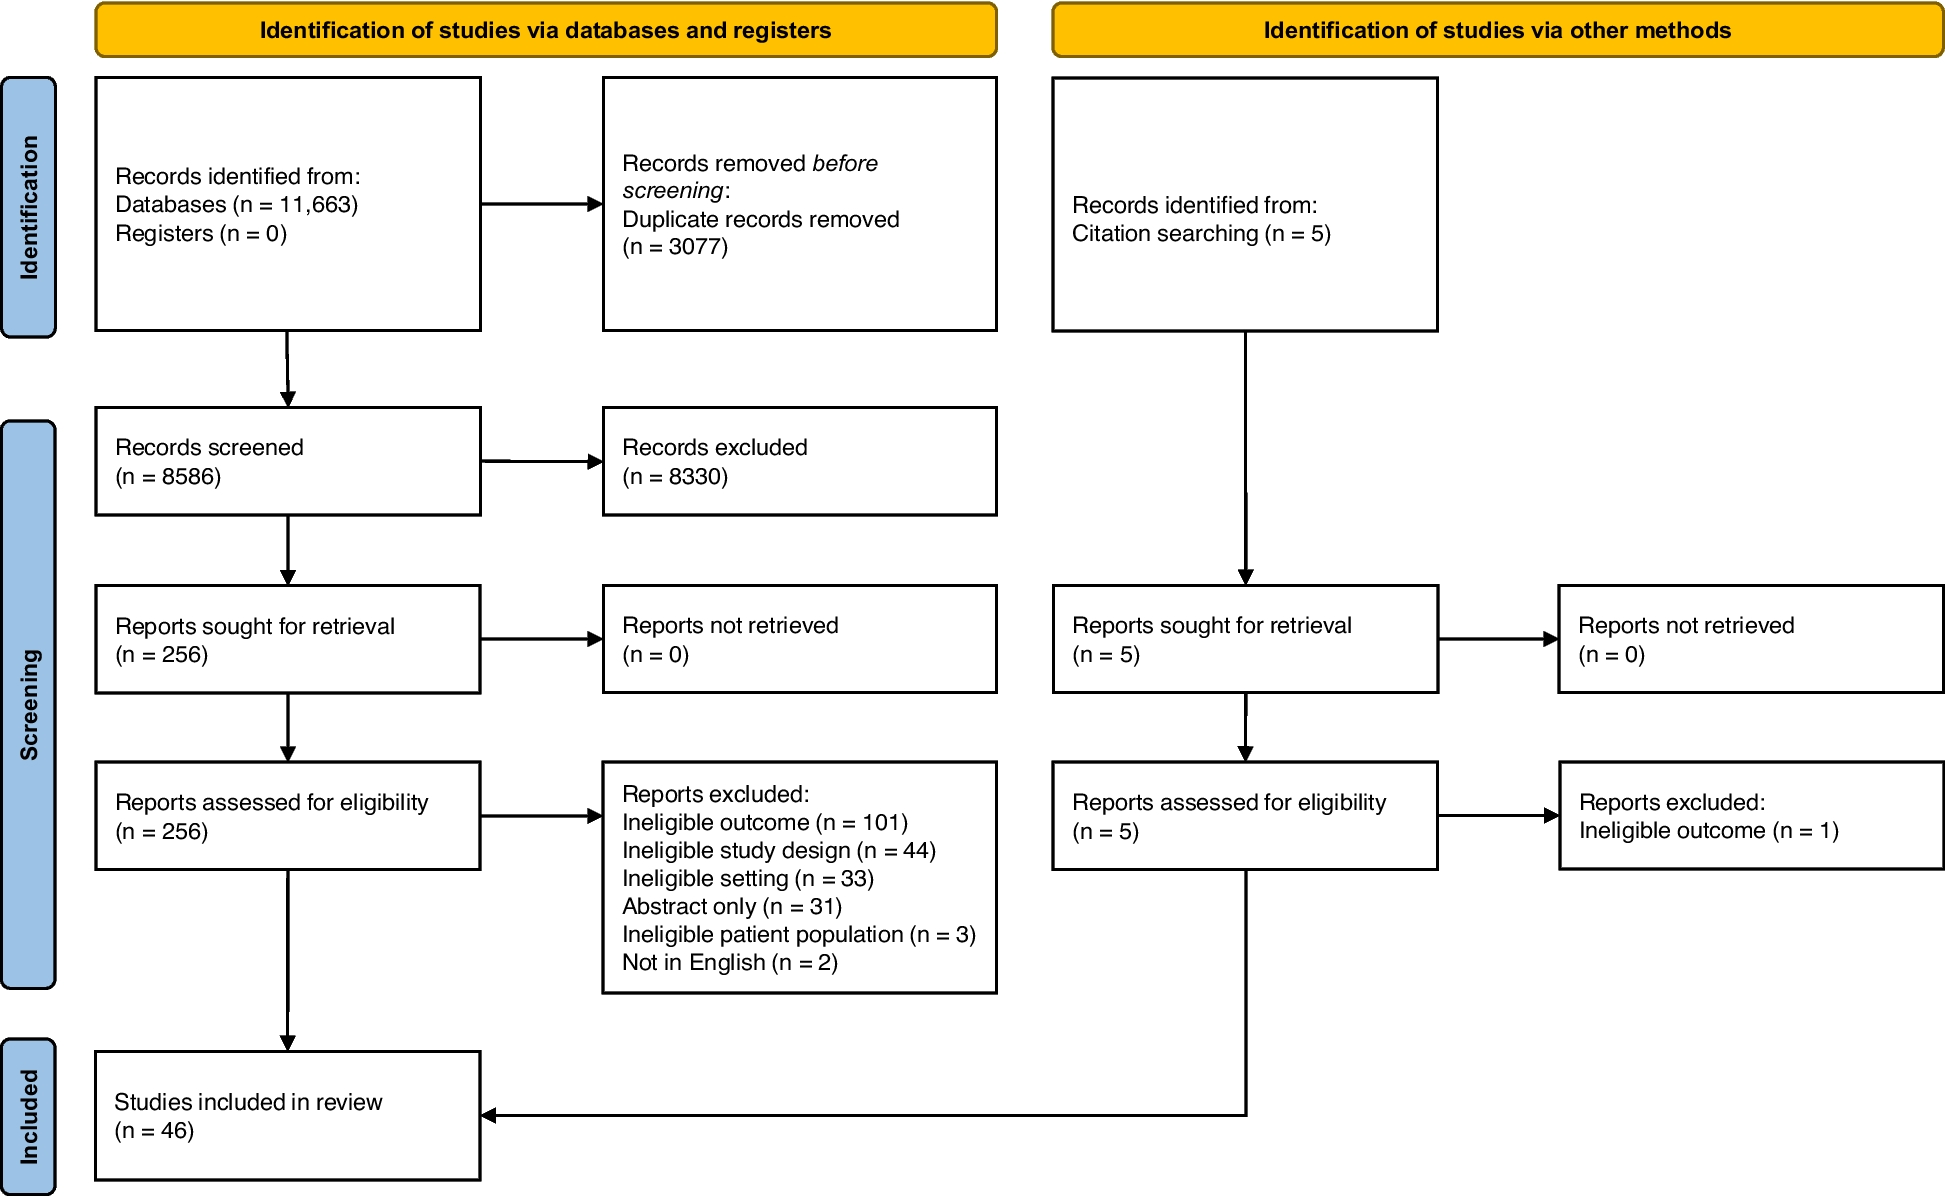
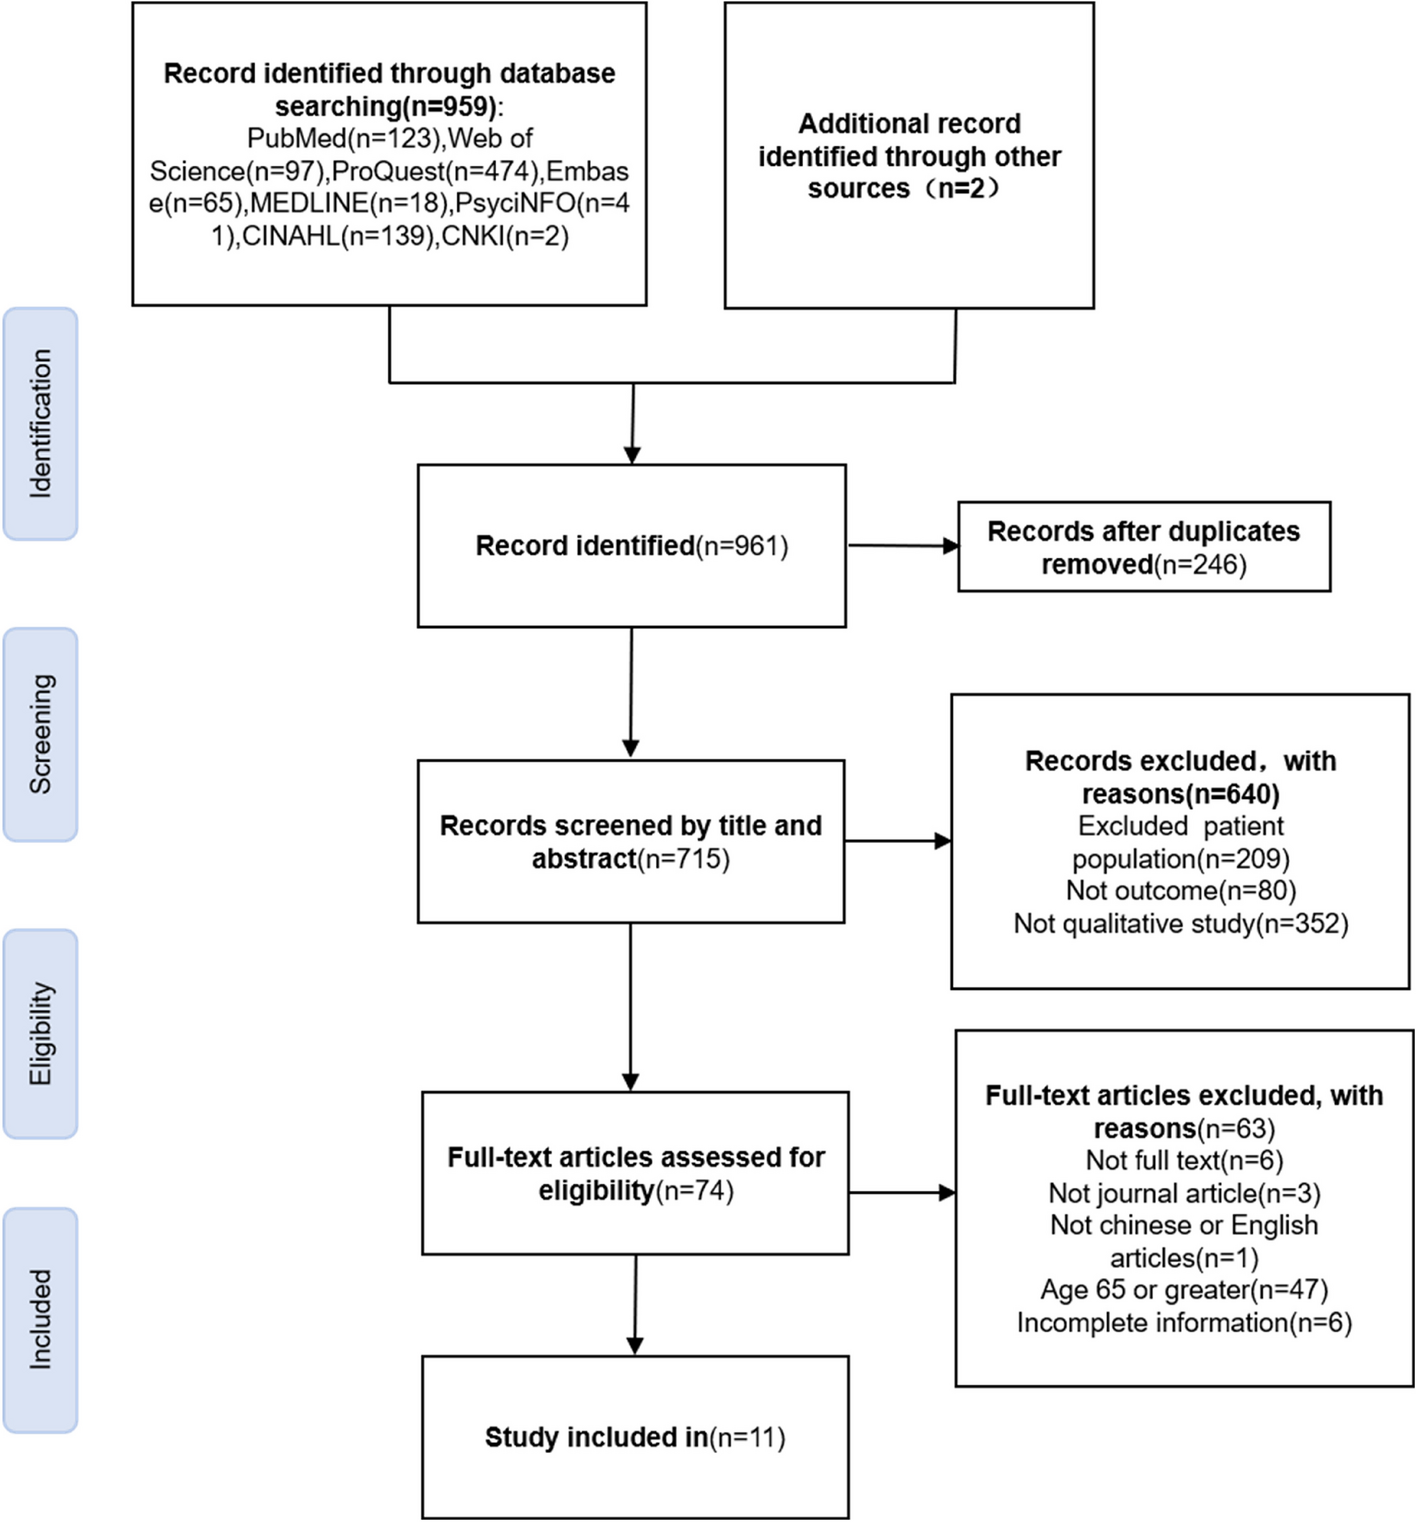
A total of 1,241 records were identified through database searches. After removing 232 duplicate records, 1,009 were screened by title and abstract, leading to the exclusion of 447 records. The remaining 36 reports were sought for retrieval, of which 26 were excluded for various reasons (Fig. 1). Ten RCTs identified from the major databases were included. After searching the CNKI database, 21 additional records were identified. After excluding studies that did not meet the eligibility criteria, 14 studies were ultimately selected for inclusion (Fig. 1). Overall, the meta-analysis included 24 RCTs [12,13,14,15, 24,25,26,27,28,29,30,31,32,33,34,35,36,37,38,39,40,41,42,43], all published between 2021 and 2024.
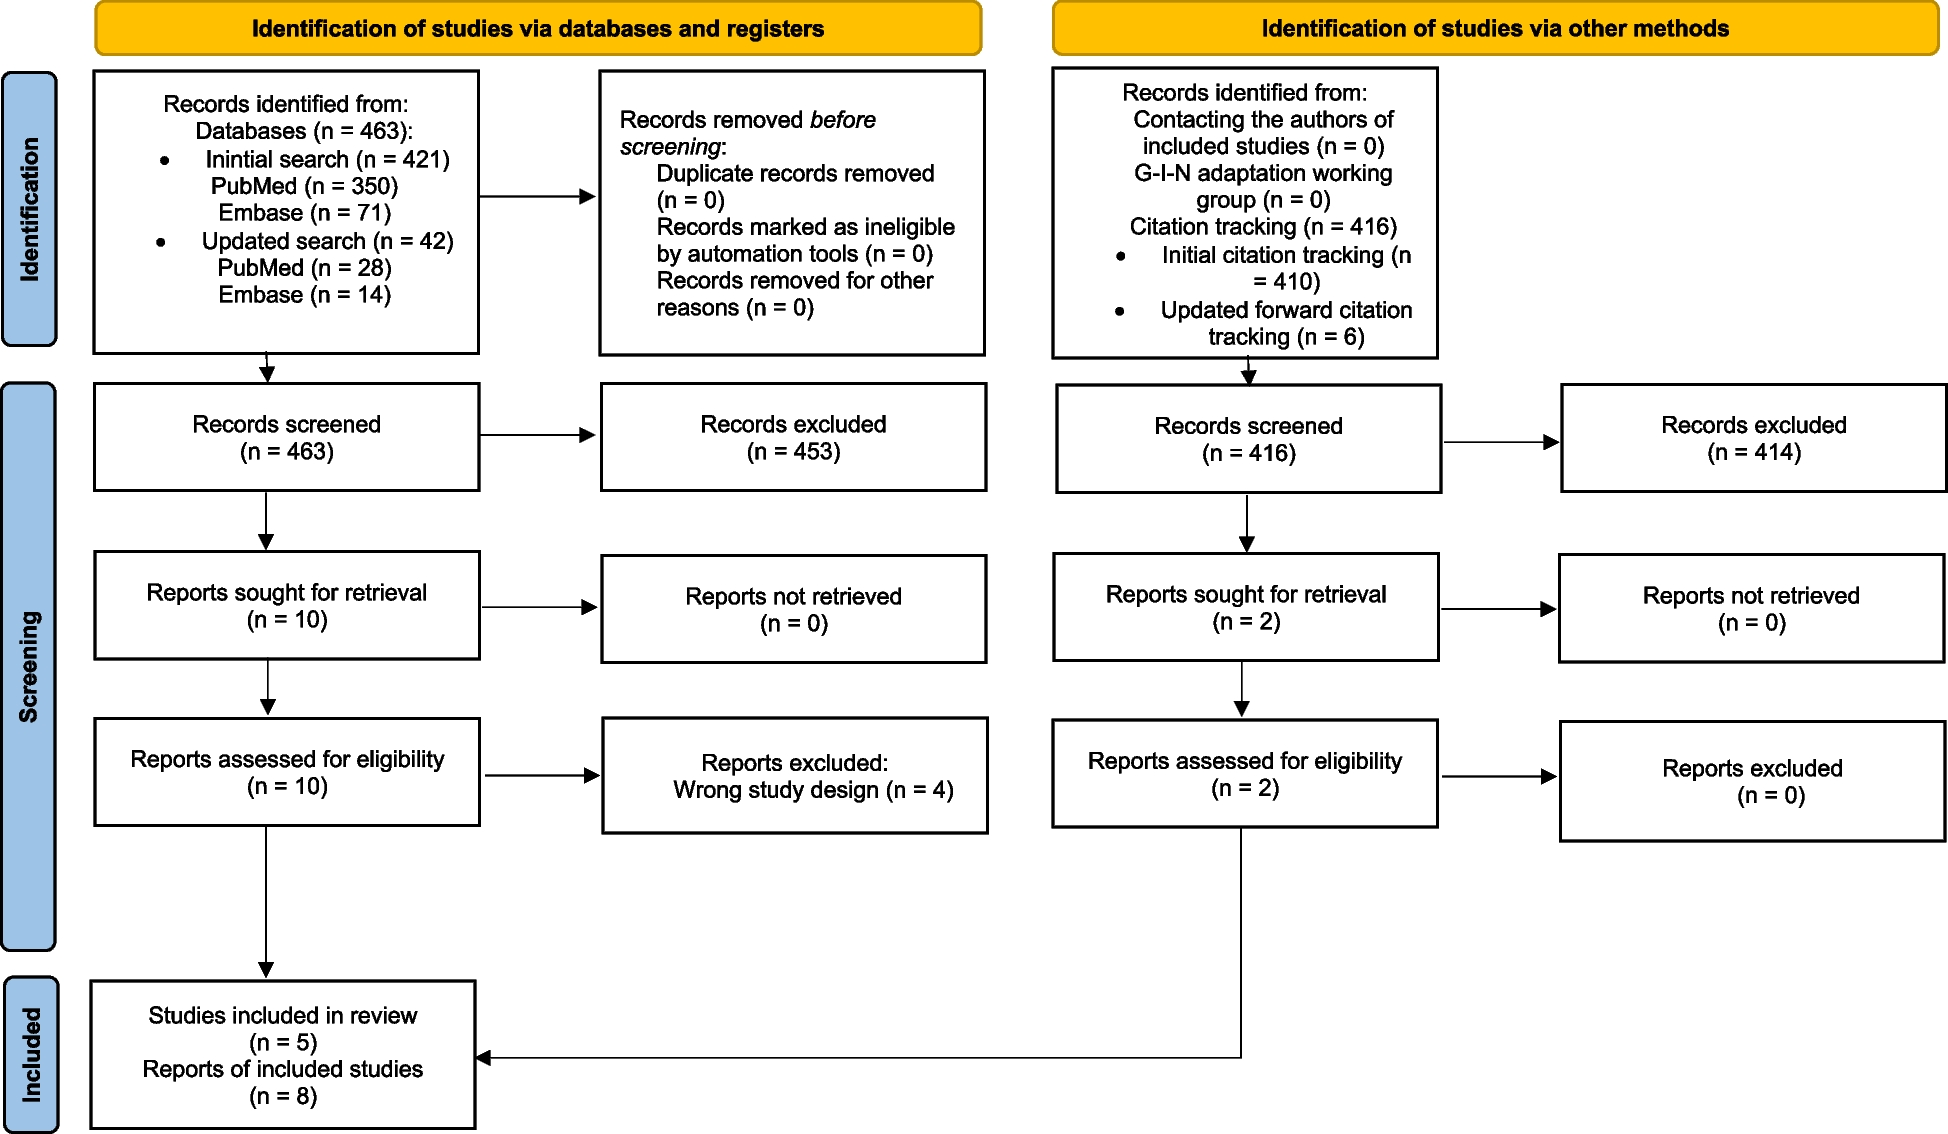
Fig. 1
Flow chart of the study selection process
The main characteristics of the 24 included trials, involving 2,130 patients, are summarized in Table 1. The included studies used various study designs, with 19 and 5 studies using two- and three-arm designs, respectively. The mean age of the participants ranged from 40 to 73 years, with the proportion of male patients varying from 0 to 77%. A total of 16 studies focused on the elderly population (i.e., mean age > 65 years) [13, 14, 24, 25, 27, 33,34,35,36,37,38,39,40, 42, 43], whereas eight included relatively young patients (aged ≤ 65 years) [12, 15, 26, 28,29,30,31,32]. The surgical procedures and diagnostic criteria for POND varied among the included studies (Supplemental Table 2). The mean surgical duration ranged from 51 to 269 min, and the estimated dosage of esketamine, which was administered before anesthetic induction or intraoperatively, ranged from 0.1 to 1.1 mg/kg (Supplemental Table 3). Fifteen studies reported the incidence of POND as an outcome [12,13,14, 24,25,26, 29, 30, 32, 34, 36, 38, 42, 43], and 19 studies assessed cognitive function using two measurement tools (i.e., MMSE or Montreal Cognitive Assessment) (Table 1) [13, 14, 26,27,28,29, 31,32,33,34,35,36,37,38,39,40, 42, 43]. The follow-up periods also differed across the studies, ranging from 1 day to 3 months postoperatively. All 24 studies were conducted in China.
Table 1 Summary of characteristics for 24 randomized controlled studiesRisk of biasIn the 24 included studies (Fig. 2), notable concerns were identified in eight trials regarding the randomization process, mainly because of insufficient details on the concealment of the allocation sequence. In the examination of bias from missing outcome data, one study [13] was categorized as high-risk, as more than 20% of the participants dropped out, and another study [29] raised concerns with a dropout rate exceeding 10%. In terms of outcome measurement, the risk of bias in the two studies [29, 30] that evaluated the occurrence of POND within POD 1 was considered to have some concerns attributed to the short follow-up period. Overall, the risk of bias was deemed low in seven studies, presented some concerns in 16, and was high in one.
Fig. 2
Risk of bias for 24 studies. Each study is assessed across six domains, with risk levels indicated by color coding: Green ( +): Low risk of bias; Yellow (?): Some concerns; Red ( −): High risk of bias. Two independent reviewers assessed the quality of the studies, resolving any disagreements through discussion or by consulting a third reviewer if needed
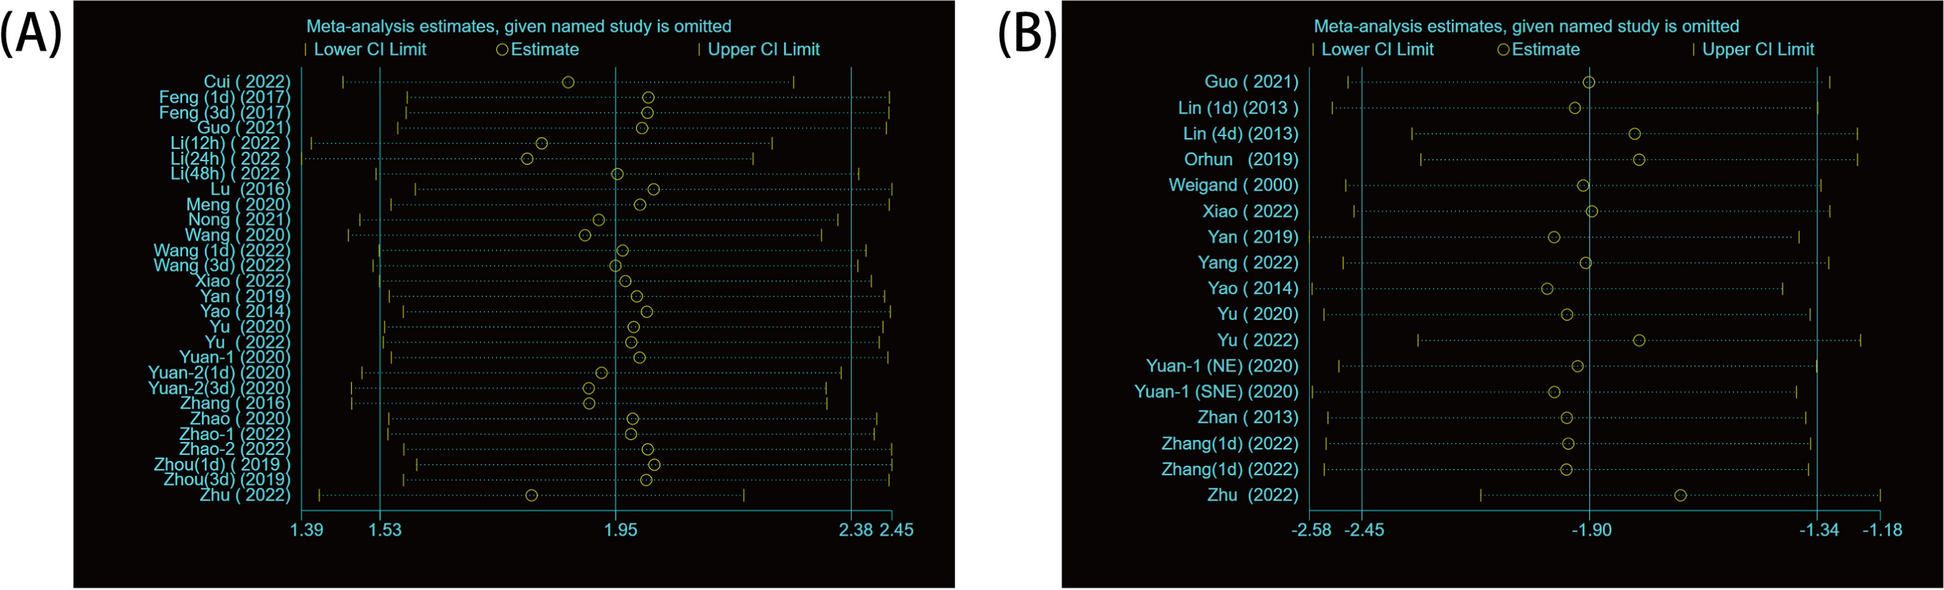
OutcomesPrimary outcome: risk of PONDThe cumulative incidences of POND were 13.3% (93/698) and 22.9% (147/642) in the esketamine and control groups, respectively. The esketamine group had a 47% lower risk of developing POND than the control group (RR: 0.53, 95% CI: 0.43–0.67, P < 0.00001, I2 = 0%) (Fig. 3) [12,13,14,15, 24,25,26, 29, 30, 32, 34, 36, 38, 42, 43]. Sensitivity analysis using the leave-one-out approach revealed consistent findings, indicating the robustness of the overall result. In the subgroup analysis by age, the RRs for POND in participants aged > 65 years and ≤ 65 years were 0.43 (95% CI: 0.31–0.6; P < 0.00001, I2 = 0%) and 0.64 (95% CI: 0.47–0.86; P = 0.003, I2 = 0%), respectively (subgroup difference, P = 0.09) (Supplemental Fig. 1). This finding indicates a greater risk reduction in the older age group, despite the absence of a statistically significant difference.
Fig. 3
Forest plot showing the risk of perioperative neurocognitive disorders (POND). (a) (b) denote different datasets within the same study. The diamond (◆) represents the overall pooled effect estimate, while the squares (■) indicate the weight of individual studies, with the size of each square proportional to the study's contribution to the meta-analysis. CI, confidence interval; M-H, Mantel–Haenszel method
In the subgroup analysis by study quality, the pooled relative risk (RR) was 0.6 (95% CI: 0.45–0.82, p = 0.001, I2 = 0%) for studies with a low risk of bias and 0.46 (95% CI: 0.33–0.64, p < 0.00001, I2 = 0%) for studies with some concerns to high risk of bias, with no significant subgroup differences (P = 0.24) (Supplemental Fig. 2). Subgroup analysis based on esketamine administration type also showed no significant difference between bolus only (RR: 0.56, 95% CI: 0.44–0.7; P < 0.00001, I2 = 0%) and bolus plus infusion doses (RR: 0.36, 95% CI: 0.18–0.73; P = 0.005, I2 = 0%) (subgroup difference: P = 0.26) (Supplemental Fig. 3).
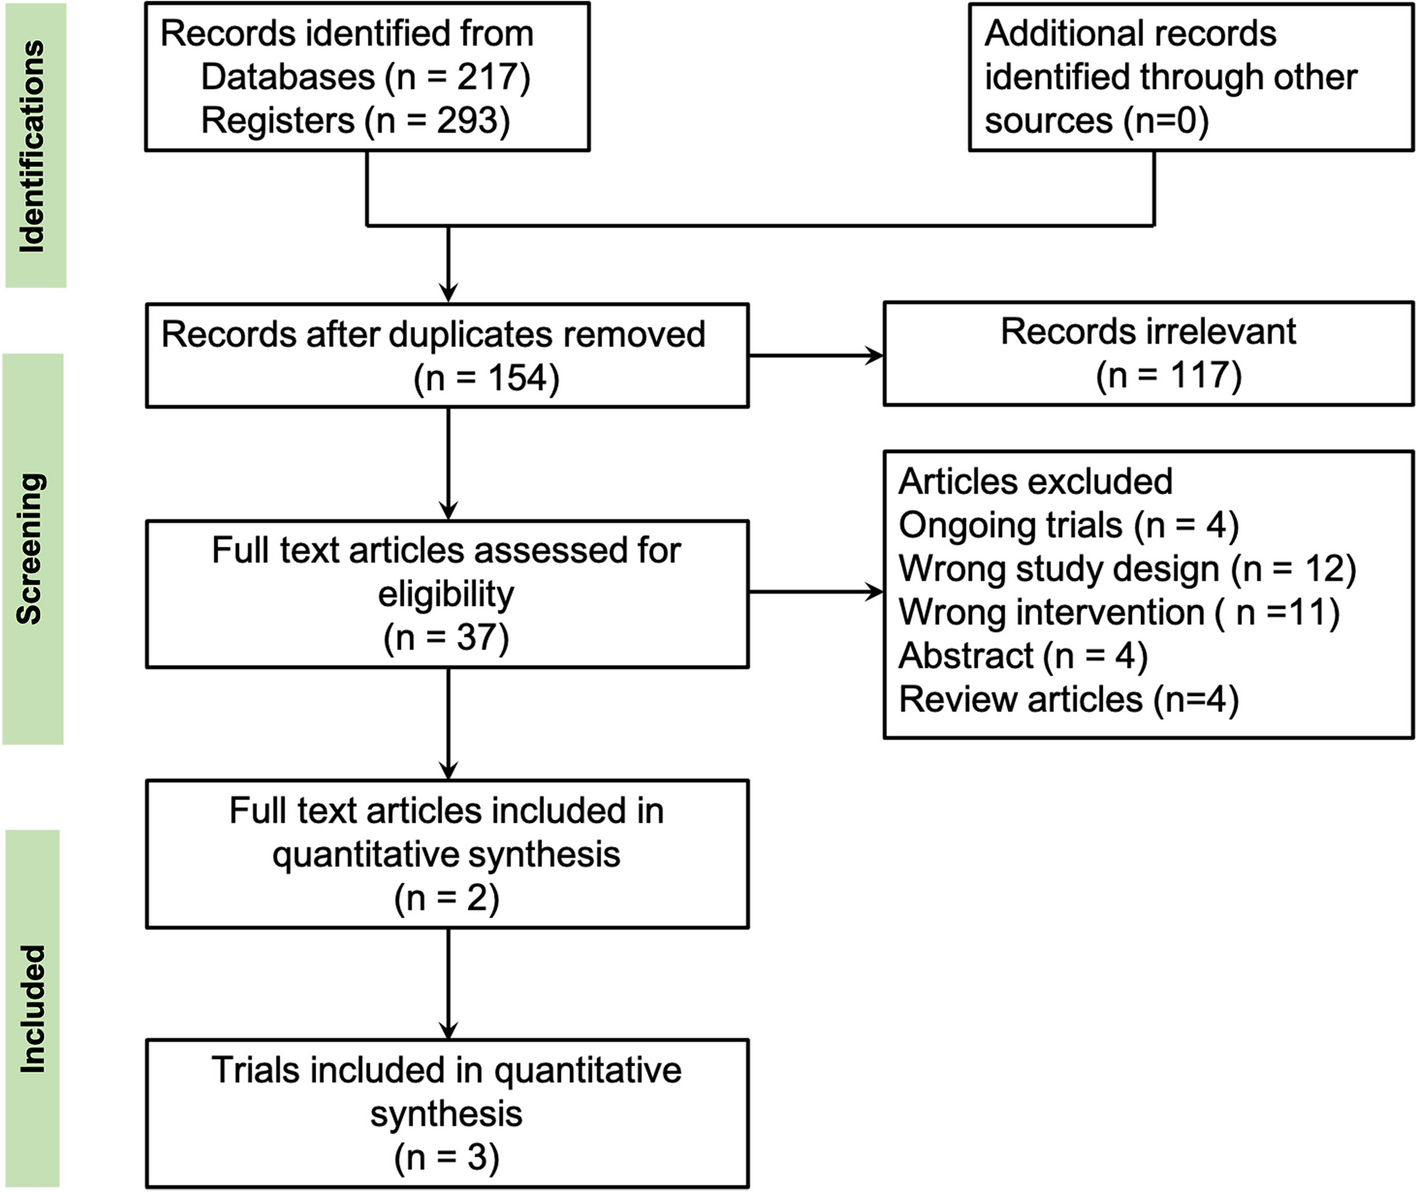
Primary outcome: cognitive function measurementOn POD 1, the pooled data indicated that the esketamine group had significantly better postoperative cognitive function than the control group (SMD: 1.22, 95% CI: 0.85–1.59; P < 0.00001, I2 = 91%) (Fig. 4) [13, 14, 26,27,28,29, 31,32,33,34,35,36,37,38,39,40, 42, 43]. Sensitivity analysis revealed consistent findings, confirming the robustness of the overall result. Subgroup analysis by age revealed that the cognitive benefit of esketamine was also more pronounced in older participants (aged > 65 years) (SMD: 1.34, 95% CI: 0.9–1.77; P < 0.00001) than in younger participants (aged ≤ 65 years) (SMD: 0.95, 95% CI: 0.23–1.66; P = 0.010), although the difference between the two subgroups was not statistically significant (Supplemental Fig. 4). In the subgroup analysis by quality of studies, the pooled effect size was 1.15 (95% CI: 0.56–2.45, I2 = 92%) for studies with a low risk of bias and 1.14 (95% CI: 0.74–1.55, I2 = 91%) for studies with some concerns to high risk of bias (subgroup differences: P = 0.49) (Supplemental Fig. 5). No significant difference was observed between studies using only bolus doses (SMD: 1.21, 95% CI: 0.8–1.63; P < 0.00001, I2 = 88%) and those using a combination of bolus and infusion doses (SMD: 1.23, 95% CI: 0.53–1.92; P = 0.0005, I2 = 94%) (subgroup difference: P = 0.97) (Supplemental Fig. 6).
Fig. 4
Forest plot showing the difference in cognitive function between the groups on postoperative day 1. (a) (b) denote different datasets within the same study, whereas (1) (2) denote different studies. The diamond (◆) represents the overall pooled effect estimate, while the squares (■) indicate the weight of individual studies, with the size of each square proportional to the study's contribution to the meta-analysis. CI, confidence interval; Std., standardized; IV: invariance
Comments (0)