
Remember me


Diabetes mellitus associated with exocrine pancreatic disease (also known as T3cDM) is a frequent manifestation in chronic pancreatitis (CP) with a prevalence estimation of 25%–80% (1). Although the global prevalence is not known with accuracy, the prevalence of diabetes in CP is consistently reported to be 30%–40% (2,3). The high incidence of diabetes in CP, its impact on quality of life, and the brittle nature of diabetes in the advanced stages is a clinical challenge. Despite the fact that insulin secretory defects were observed in CP as early as in 1960s, endocrine function in an inflammatory microenvironment is neither understood nor studied before the onset of diabetes mellitus. It is opined that understanding endocrine dysfunction and its progression to diabetes in pancreatitis is critical to develop screening tools for early detection or prediction, prevention, and intervention (4). The molecular pathways that lead to T3cDM are deemed to be different from other forms of diabetes because it occurs secondary to exocrine pancreatic disease (5). The importance of understanding pathophysiology of T3cDM is that both CP and diabetes are risk factors of pancreatic ductal adenocarcinoma (6). A small study involving 25 patients with CP demonstrated early alterations in glycemic control in nondiabetic CP patients (4). Biomarkers to predict such alterations in glycemia and progression to diabetes remain an unmet clinical need. Although earlier studies used metabolomic profiling to identify blood-based metabolic biomarker signature to differentiate CP from nonpancreatic disease (7) and pancreatic ductal adenocarcinoma from CP (8), metabolomics in the progression of normoglycemia to hyperglycemia has not been studied. PROCEED study developed a clinical prediction model with an AUC of 74.5% to identify patients with CP with greatest risk of developing diabetes (9,10).We performed metabolomic profiling to assess the metabolic differences between controls and patients with T3cDM and to evaluate whether the differences can identify non-diabetic CP patients with glycemic alterations by stratifying patients with CP. Novelty is the stratification of patients with CP based on glycemic status to identify metabolic aberrations associated with progression to prediabetes/diabetes. It is important to discriminate patients with CP with glycemic alterations before alterations in HbA1c levels so that strategies to arrest/delay progression to prediabetes/diabetes can be developed.
MATERIALS AND METHODS Study designThis is a single-center, prospective observational study conducted after obtaining approval from institutional ethics committee (AIG/IEC October 32, 2018/ER-02: March 05, 2019) and written informed consent from all participants. We performed metabolomics to identify patients who may have the risk of progressing to diabetes (see Supplementary Digital Content, Figure S1, https://links.lww.com/CTG/B115).
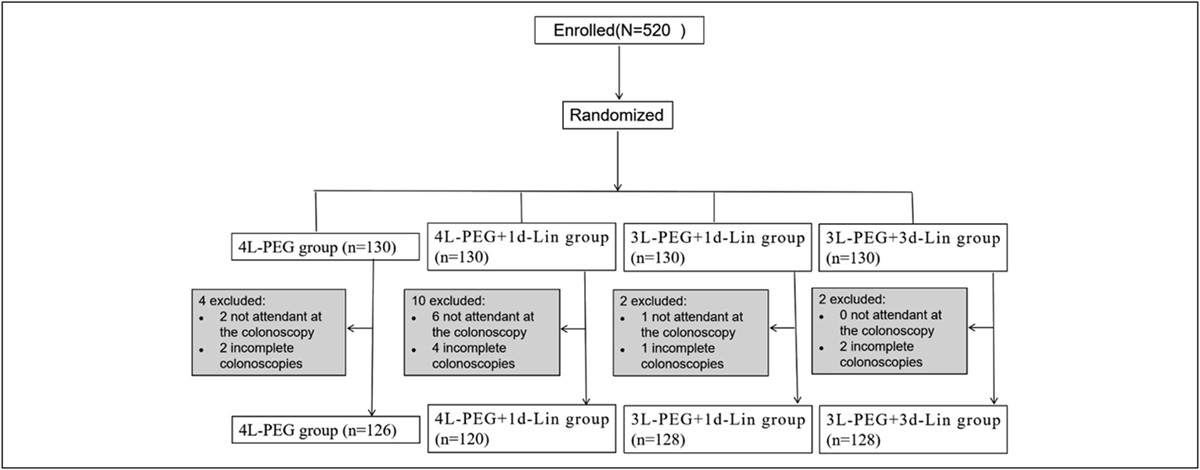
The study prospectively recruited 445 participants in identification and validation cohorts following TRIPOD guidelines (11) during 2019–2021 (Figure 1a, see Supplementary Digital Content, Table S1, https://links.lww.com/CTG/B115).Patients with documented CP from AIG Hospitals outpatient pancreas clinic were recruited, and hospital staff who were healthy volunteered to participate and formed controls (HC). CP diagnosis was based on the following criteria (i) presence of abdominal pain, (ii) histological evidence of pancreatic parenchymal changes, and (iii) presence of ductal calcifications and atrophic changes on imaging (12). All the participants underwent oral glucose tolerance test and were stratified based on ADA guidelines using cutoff of 2 hours OGTT (13). Patients who were diagnosed first time to have developed diabetes after CP diagnosis were included in the study and were considered treatment naïve for diabetes. Newly diagnosed patients with T2DM recruited from endocrinology outpatient clinics at AIG Hospitals were considered as disease controls (Figure 1). Patients with T2DM were confirmed to have diabetes by glycosylated hemoglobin (HbA1c) levels without any history of pancreatic disease. The participant samples were checked for the presence of GADD and anti-insulin antibodies to exclude type 1 diabetes. Patients with concomitant viral diseases, those with confirmed malignancy, and pregnant/lactating female individuals were excluded in all 3 cohorts.
 Figure 1.:
 (a) Consolidated cohort diagram of participants recruited for metabolome analysis. All participants were recruited prospectively in 3 different cohorts (identification cohort, validation cohorts 1 and 2). (b). Distribution of types of metabolites among healthy control, nondiabetic CP, pre-diabetic CP, and diabetic CP patients using high-resolution mass spectrometry. 21.4% of alcohols and polyols were detected in diabetic CP when compared with 4.6% in controls, 5.3% in non-diabetic, and 1.7% in prediabetic CP patients. Approximately 5.1% of aldehydes and ketones were detected in controls, 14% in non-diabetic, and 1.9% in prediabetic, and 10.9% in diabetic CP patients. Amines were found to be 7.6% in prediabetic CP when compared with 0.7% in non-diabetic CP and 3.5% in diabetic CP patients. Amino acids and conjugates were found to be 2.5% in diabetic CP and 1% in controls, 0.3% in nondiabetic CP, and 0.2% in prediabetic CP patients. Carbohydrates were higher in prediabetic CP, 4.5%, when compared with 0.7% in nondiabetic CP and 2.9% in diabetic CP patients. Approximately 60.3% of fatty acids and conjugates were detected in pre-diabetic CP when compared with 41.6% in controls, 28.7% in nondiabetic CP, and 13.4% in diabetic CP patients. Among organic acids and derivatives, 45.6% were in controls, 43.4% were in nondiabetic CP, 10.9% were in prediabetic CP, and 33.9% were in diabetic CP patients. Among all the types of metabolites detected, higher number of metabolites were detected in amines and polyamines, carbohydrates and conjugates, fatty acids and conjugates, while alcohols and polyols, aldehydes and ketones, and organic acids and derivatives decreased in prediabetic CP. CP, chronic pancreatitis.
We screened complete metabolomic profiles and quantified the dysregulated metabolites in fasting plasma samples to identify differences in the metabolomic profiles using high-resolution mass spectrometry (14–16). Direct ESI‐high-resolution mass spectrometry analysis of processed plasma samples was performed on a quadrupole‐time of flight mass spectrometer (Agilent 6,545 model), which is coupled with a UPLC (Agilent 1,290 model). Approximately 10 μL of processed plasma sample solution was introduced into the ionization source of the mass spectrometer by flow injection, where 0.1% formic acid in water:acetonitrile (70:30; v/v) was used as the mobile phase solvent for positive mode ESI condition, and 0.01% ammonia in water:acetonitrile (70:30; v/v) was used for negative mode ESI condition. The flow rate of LC was 0.4 mL/min. Nitrogen gas was set as the nebulizer gas (20 psig), drying gas (8 L/min), and sheath gas (11 L/min). The other conditions were drying gas temperature, 260°C; sheath gas temperature, 250°C; nozzle voltage, 1,000 V; capillary voltage, 3,200 V; skimmer voltage, 60 V; fragmentor voltage, 80 V; and RF voltage, 650 V. The mass spectrometer scanned from 50 to 1,500 m/z with a resolution of 40,000 (FWHM). Detected ions were putatively identified by matching the accurate masses (<5 ppm) against mass hunter and HMDB database (17). This method was validated following validation guidelines (18). Details of methodology are given in supporting information.
Statistical analysisOne-way ANOVA with Bonferroni post hoc analysis was performed on cohort statistics. A Student t test was used to compare the relative changes in metabolites among the stratified groups. All statistical analyses were conducted using the Statistical Package of Social Sciences (SPSS) (IBM SPSS 28.0; SPSS, Chicago, IL), MedCalc software (v22.013) (19). Cluster analysis was performed by partial least squares discriminant analysis (PLS-DA) and orthogonal projections to latent structures discriminant analysis (OPLS-DA) models among metabolites between stratified groups (20).
Biomarker discoveryA receiver operating characteristic (ROC) curve was used to determine AUC that discriminates stratified groups (HC and T3cDM; HC and ND; ND and PD; and PD and T3cDM) with the quantified metabolites. ROC analysis using MedCalc and combination of ROCs using CombiROC tool (21) were used to evaluate the performance of a single or a combination of targeted metabolites.
RESULTS Oral glucose tolerance test stratifies patients with CPThe baseline characteristics of the identification and validation cohorts are summarized in Table 1. OGTT stratified patients with CP into ND (n = 87/146; 59.58%), PD (n = 29/146; 19.86%), and T3cDM patients (n = 30/146; 20.54%) as per ADA guidelines (Table 1).
Table 1. - Baseline characteristics of participants Parameters Control (HC n = 73) Chronic pancreatitis (n = 96) P value Identification cohort (n = 169) Nondiabetic (ND n = 40) Prediabetic (PD n = 33) T3cDM (n = 23) Age (yr) 29.7 ± 3.9 28.4 ± 11.8 29.8 ± 13.2 35.1 ± 12.7 0.125 Disease duration (yr) NA 3.9 ± 2.5 3.7 ± 2.7 5.0 ± 4.9 0.354 Male 68% 70% 76% 70% BMI (kg/m2) 22.4 ± 3.3 23.0 ± 4.1 23.1 ± 4.2 22.6 ± 3.9 0.891 FBS (mg/dL) 88.64 ± 11.4 90.1 ± 13.1 98.2 ± 13.4 111.4 ± 17.0 <0.001 1 hr glucose (mg/dL) 104.8 ± 32.7 138.5 ± 24.2 193.9 ± 46.1 232.3 ± 35.0 <0.001 2 hr glucose (mg/dL) 88.7 ± 26.6 114 ± 12.7 159.2 ± 12.9 237.9 ± 36.2 <0.001 Validation cohort 1 (n = 133) Control (HC n = 26) Chronic pancreatitis (n = 107) P value Non-diabetic (ND n = 65) Pre-diabetic (PD n = 20) T3cDM (n = 22) Age (yr) 31.3 ± 5.6 33.5 ± 11.7 33.9 ± 12.7 36.8 ± 9.9 0.371 Disease duration (yr) NA 4.8 ± 4.6 6.1 ± 4.7 4.3 ± 3.0 0.389 Male 65% 80% 70% 82% — Alcohol intake Nil 14% 15% 27% — Smoking Nil 12% 18% 24% BMI, (kg/m2) 21.7 ± 2.3 21.9 ± 3.9 22.2 ± 4.4 20.9 ± 2.6 0.598 HbA1C (%) 4.5 ± 0.6 5.1 ± 0.5 5.4 ± 0.6 6.5 ± 0.4 <0.01 FBS (mg/dL) 81.55 ± 12.83 84.7 ± 10.3 91.6 ± 11.7 104.9 ± 19.4 <0.01 1 hr glucose (mg/dL) 104.8 ± 32.7 150.9 ± 27.5 179.6 ± 23.4 245.4 ± 44.3 <0.01 2 hr glucose (mg/dL) 88.7 ± 26.6 118.2 ± 5.6 163.1 ± 15.8 235.1 ± 42.6 <0.01 Haemoglobin (g/dL) 13.2 ± 2.3 13.7 ± 1.7 13.6 ± 1.9 12.7 ± 1.5 0.111 WBC (cells/cu mm) 6,915.4 ± 1898.5 7,397.9 ± 1711 7,526.7 ± 2,423.2 7,053.3 ± 1985.2 0.672 RBC (cells/cu mm) 4.1 ± 0.7 4.8 ± 0.5 4.8 ± 0.8 4.7 ± 0.7 <0.01 Platelet count(103/mm3) 2.8 ± 0.8 2.3 ± 0.7 2.2 ± 0.7 2.0 ± 0.6 0.001 Total protein (g/dL) 7.3 ± 0.5 7.6 0.4 7.7 ± 0.4 7.6 ± 0.4 0.008 Serum lipase (U/L) 28.08 ± 14.1 126.17 ± 227.0 66.75 ± 38.9 42.4 ± 22.6 0.135 Vit D (ng/mL) 48.0 ± 24.2 19.9 ± 8.3 24.5 ± 13.8 21.6 ± 21.7 <0.001 Vit B12 (pg/mL) 557.7 ± 193.21 372.9 ± 172.8 355.2 ± 151.6 513.8 ± 527.7 0.056 Validation cohort 2 (n= 69) Control (HC n = 30) Chronic pancreatitis (n = 39) P value Nondiabetic (ND n = 22) Prediabetic (PD n = 9) T3cDM (n = 8) Age (yr) 31.9 ± 5.3 36.2 ± 11.9 36.4 ± 13.1 40.1 ± 7.2 0.05 Disease duration (yr) NA 7.9 ± 3.6 8.7 ± 7.2 8.0 ± 7.3 0.935 Male 67% 86% 100% 92% Alcohol intake Nil 54% 22% 75% Smoking Nil 36% 11% 75% BMI (kg/m2) 21.7 ± 2.2 21.2 ± 3.4 22.9 ± 3.9 21.2 ± 4.1 0.575 HbA1C (%) 4.6 ± 0.6 5.4 ± 0.3 5.8 ± 0.4 6.8 ± 1.1 <0.001 FBS (mg/dL) 83.9 ± 13.4 96.8 ± 11.0 112.0 ± 11.9 133.7 ± 31.5 <0.001 1 hr glucose (mg/dL) 113.9 ± 38.3 161.1 ± 34.4 211.5 ± 50.3 301.6 ± 81.2 <0.001 2 hr glucose (mg/dL) 96.0 ± 31.1 113.2 ± 18.6 156.3 ± 17.4 296.8 ± 108.1 <0.001 Hemoglobin (g/dL) 13.1 ± 2.1 13.5 ± 1.3 13.6 ± 1.7 12.8 ± 1.93 0.74 WBC (cells/cu mm) 6,978.5 ± 1770.3 7,110.1 ± 1905.3 8,987.5 ± 2,108.1 7,854.5 ± 1949.0 0.04 RBC (cells/cu mm) 4.1 ± 0.6 4.6 ± 0.5 5.3 ± 0.72 4.7 ± 0.5 <0.001 Platelet count (103/mm3) 2.7 ± 0.7 1.9 ± 0.55 2.4 ± 1.1 2.0 ± 0.5 0.001 Total proteins (g/dL) 7.4 ± 0.5 7.8 ± 0.5 7.9 ± 0.5 7.9 ± 0.4 0.001 Serum lipase (U/L) 27.4 ± 13.4 118.1 ± 224.5 118.4 ± 141.1 95.1 ± 115.8 0.09 Vit D (ng/mL) 45.9 ± 23.1 22.9 ± 17.2 20.5 ± 12 19.4 ± 7.2 <0.001 Vit B12 (pg/mL) 546.2 ± 181.8 257.9 ± 193.5 235 ± 117 344.7 ± 121.1 0.001BMI, body mass index; CP, chronic pancreatitis; FBS, fasting blood sugar; HCs, healthy controls; PD, prediabetic CP; RBC, red blood cells; WBC, white blood cells, ND, nondiabetic CP.
P < 0.05 is considered statistically significant.
In the identification study, a total of >13,000 ions were detected in both ionization modes distributed into different classes of metabolites (Figure 1b). Fatty acid conjugates were the largest group in PD (60%) in comparison with ND (27%) and T3cDM patients (15%), and organic acids were lowest in PD (10%) in comparison with ND (40%) and T3cDM (31%). Compound discovery analysis identified the fatty acid conjugates as phospholipids, which were higher in number among PD CP (ND 2083, PD 3124 and T3cDM 2,874 ions) in the identification study. Peak filter analysis of all the metabolites from untargeted metabolomics identified 57 metabolites with higher peaks in 10 ontology classes of lipids among the 3 groups of CP. Of these, lysophosphatidic acid (LPA; 16:0), phosphatidic acid (32:0) lysophosphatidylethanolamines, LPE (16:0 and 22:6) phosphatidylcholines, PC (32:0, 32:1, 36:3), ceramides Cer (d18:1/18:0)/(18:1/24:1)/(18:2/24:1), phosphatidylethanolamines, and PE (34:1 and 38:7) were significantly increased and diacylglycerols, DAG (33:2 and 33:4) were decreased in T3cDM patients in comparison with those in controls. While deoxycholic acid, hexanoylcarnitine, lysophosphatidylethanolamine, LPE (16:0 and 22:6), phosphatidic acid (32:0), lysophosphatidiylcholine LPC (20:3), phosphatidylethanolamines, PE (34:1,34:2, 36:3, 38:7), and ceramides Cer (d18:1/18:0)/Cer (d18:1/24:1)/Cer (d18:2/24:1) increased, diacylglycerols, DAG (33:2 and 33:4) decreased in ND CP in comparison with those in controls. As the disease progressed to prediabetic stage, phosphatidyl glycerol (34:1), lysophosphatidylinositol, LPI (20:4) increased and ceramide Cer (d18:0/16:0) decreased. Fold changes were highly significant among the groups (P < 0.01–0.05, see Supplementary Digital Content, Table S2, https://links.lww.com/CTG/B115).
Discrimination of controls and stratified groups of CP across glycemic continuum using multivariate analysis of metabolitesTo assess whether the 57 metabolites with higher peaks segregate in CP across glycemic status, PLS-DA regression analysis was performed. HC and T3cDM stratified group with combined variance for PC1 and PC2 accounted for 36.1%. OPLS-DA R2Y represents the model interpretation rate, and Q2 indicates the model predictive ability. Permutation analysis using OPLS-DA of observed R2Y and cross-validated Q2 coefficients were 0.79 and 0.65, respectively (P < 0.01). The results showed apparent separation between the HC and ND groups with combined variance for PC 1 and PC2 accounted for 28.0%. Permutation analysis of observed R2Y and cross-validated Q2 coefficients were 0.50 and 0.37, respectively (P < 0.05). Similarly, for ND and PD groups, the combined variance for PC1 and PC2 accounted for 24.7%. Permutation analysis of observed R2Y and cross-validated Q2 coefficients were 0.27 and -0.08, respectively (P = 0.15). Likewise, the combined variance for PC1 and PC2 accounted for 27.1% among PD and T3cDM groups. Permutation analysis of observed R2Y and cross-validated Q2 coefficients were 0.48 and –0.50, respectively (P = 0.5). It is interesting to note clear segregation across glycemic status in CP. The results also showed apparent separation between T3cDM and T2DM groups with PC 1 and PC2 accounting for 24.2%. Permutation analysis of observed R2Y and cross-validated Q2 coefficients were 0.626 and 0.373, respectively (P < 0.01) (Figure 2).
 Figure 2.:
 Multivariate analysis of metabolites among the stratified groups. (a) PLS-DA score plot of HC (purple) vs T3cDM (red) (b) PLS-DA score plot of HC (purple) and PD (blue), (c) PLS-DA score plot of HC (purple) and ND (green) (d) PLS-DA score plot of ND (green) and PD (blue) (e) PLS-DA score plot of PD (blue) and T3cDM (red) (f) PLS-DA score plot of T2DM (cyan) and T3cDM (red). CP, chronic pancreatitis; HC, healthy controls; ND, nondiabetic CP; PD, prediabetic CP; PLS-DA, partial least squares discriminant analysis; T3cDM, postpancreatitis diabetes mellitus.
Biomarker discovery for discrimination of patients with CP with glycemic alterationsClear segregation of the metabolites by PLS-DA ranging from 24.7% to 36.1% by principal components 1 and 2 among HC and stratified groups of glycemia indicated the possibility of deriving a biomarker signature to discriminate ND CP patients with glycemic alterations. To identify a biomarker signature from the 57 dysregulated metabolites, 17 metabolites, 1 from each class were chosen for further validation, quantification, and predictive modeling based on quality of the chromatogram (see Supplementary Digital Content, Figure S2, https://links.lww.com/CTG/B115), peak area, and LC-ESI-MS/MS confirmation. Retention time of these metabolites are shown in Supplementary Digital Content (see Table S3, https://links.lww.com/CTG/B115). Metabolite concentrations of validation cohorts 1 and 2 are shown in Supplementary Digital Content (see Table S4 and Table S5 and 1-way ANOVA results in Table S6, https://links.lww.com/CTG/B115).
Initially, we assessed the metabolite profiles of HCs and T3cDM CP patients and noted marked differences in the metabolites. Metaboanalyst and COMBIROC of 17 metabolites yielded a panel of 7 metabolites (ceramide, lysophosphatidylethanolamine, phosphatidylcholine, LPA, phosphatidylethanolamine, carnitine, and lysophosphatidylcholine) to differentiate the 2 with 94% AUC, 91% sensitivity, and 85% specificity. Logistic regression analysis for this panel has an overall model fit (P < 0.0001) with an AUC, 93% (95% CI: 81–99%). Similarly, a panel of 7 metabolites (lysophosphatidylethanolamine, ceramide, sphinganine, phosphatidylcholine, LPA, phosphatidylethanolamine, and phosphatidylinositol) discriminated HC from ND with 76% AUC, 60% sensitivity, and 90% specificity. Logistic regression analysis for 7-metabolite panel has an overall model fit (P = 0.0007) with an AUC 82% (95% CI: 73%–90%). During the glycemic continuum, a 3-metabolite panel (LPA, phosphatidylinositol, and ceramide) differentiated PD from ND with an AUC of 64%, sensitivity 75%, and specificity 52%. This AUC was expected because there will be an overlap of metabolites in the stratified groups of nondiabetic and prediabetic CP. Logistic regression analysis for these 3-metabolite panel has an overall model fit (P = 0.11), AUC, 66% (95% CI: 55%–76%). Likewise, another panel of 3 metabolites (LPA, phosphatidylinositol, and sphinganine) differentiated prediabetes from diabetic CP with 82% AUC, 59% sensitivity, and 95% specificity. Logistic regression analysis for 3 metabolites panel has an overall model fit (P = 0.08), AUC 70% (95% CI: 54%–83%). We tested whether the 3-metabolite panel can discriminate PD from ND in the second validation cohort. AUC, sensitivity, and specificity for this cohort were 69%, 67%, and 73%, respectively (Figure 3). The 95% CI for this cohort was almost similar to validation cohort 1 (41–77%). This indicated that the biomarker signature AUCs were almost similar in both the validation cohorts.
 Figure 3.:
 ROC curves of biomarker panels (a) AUC of 7-metabolite panel discriminating T3cDM patients from healthy controls (HCs) in validation cohort 1 (b) AUC of 7-metabolite panel along with pancreatic morphological features discriminating T3cDM patients from HC, validation cohort 1 (c) AUC of 7-metabolite panel discriminating ND from HC, validation cohort 1 (d) AUC of 7 metabolites along with pancreatic morphological features discriminating ND patients from HC, validation cohort 1 (e) AUC of 3-metabolite panel discriminating PD from ND, validation cohort 1 (f) AUC of 3 metabolites along with pancreatic morphological features discriminating PD from ND, validation cohort 1 (g) AUC of 3-metabolite panel discriminating PD from ND, validation cohort 2 (h) AUC of 3 metabolites along with pancreatic morphological features discriminating patients with PD from ND, validation cohort 2 (i) AUC of 3-metabolite panel discriminating T3cDM patients from PD, validation cohort 1 (j) AUC of 3 metabolites along with pancreatic morphological features discriminating T3cDM from PD, validation cohort 2. AUC of models represented as yellow star and circled in red. AUC, area under the curve; CP, chronic pancreatitis; HCs, healthy controls; ND, nondiabetic CP; PD, prediabetic CP; ROC, receiver operating characteristic; T3cDM, postpancreatitis diabetes mellitus.
Integration of metabolite panel with pancreatic morphological features improved the discrimination of the stratified groups of glycemiaTo improve the AUC of discriminating nondiabetic CP with glycemic alterations, we integrated the 3-metabolite panel (LPA, phosphatidyl inositol [PI], and ceramide) with demographics (age, BMI), pancreatic morphological features (dilated duct more than 3 mm, presence/absence of calcified stones), and presence of atrophy (normal pancreatic morphology or atrophic morphology). We performed COMBIROC and logistic regression analysis to assess whether there will be any improvement in discriminating non-diabetic CP patients who may develop glycemic alterations (Figure 3). COMBIROC of integrated panel yielded an AUC 69%, sensitivity 75%, and 57% specificity with a cutoff of 0.22 for discriminating PD from ND, and logistic regression showed AUC 75% (95% CI 64%–84%), overall model fit, P = 0.18 for validation cohort 1. Likewise, AUC was 91% with 78% sensitivity and 92% specificity with a cutoff of 0.50 in validation cohort 2. Although age and disease duration were marginally higher in validation cohort 2, the panel discriminated patients with prediabetes from nondiabetic CP patients similarly in both cohorts; 75% in validation cohort 1 and 78% in validation cohort 2 (Table 2 and Figure 4a,b).
Table 2. - Metabolite panels and integrated models with pancreatic morphological features for stratified groups Stratified group Combiroc (combinations of ROC) Logistic regression AUC (%) Sensitivity (%) Specificity (%) Optimal cutoff AUC 95% CI Model fit 1 HC and T3cDM (7-metabolite panel) 94.1 91.0 85.0 0.33 93.0 81–98 P < 0.0001 2 HC and T3cDM (7 metabolites, disease duration, age, BMI, and pancreas morphology) 100 100 100 0.5 100 93–100 P < 0.0001 3 HC and ND (7-metabolite panel) 76.4 60.0 90.0 0.77 82.0 73–90 P = 0.0007 4 HC and ND (7 metabolites, disease duration, age, BMI, and pancreas morphology) 88.8 86.2 80.8 0.62 100 96–100 P < 0.0001 5 ND and PD (3 metabolites, validation cohort 1) 64.0 75.0 52.0 0.20 66.0 55–76 P = 0.1156 6 ND and PD (3 metabolites, disease duration, age, BMI, and pancreas morphology: Validation cohort 1) 68.5 75.0 56.9 0.22 75.0 64–84 P = 0.186 7 ND and PD (3 metabolites, validation cohort 2) 69.0 67.0 73.0 0.34 60.0 41–77 P = 0.7644 8 ND and PD (3 metabolites, disease duration, age, BMI, and pancreas morphology: Validation cohort 2) 90.9 77.8 91.9 0.50 74.0 55–88 P = 0.859 9 PD and T3cDM (3 metabolites) 82.0 59.0 95.0 0.65 70.0 54–83 P = 0.0855 10 PD and T3cDM (3 metabolites, disease duration, age, BMI, and pancreas morphology) 90.7 86.4 90.0 0.54 83.0 68–93 P = 0.05CP, chronic pancreatitis; HCs, healthy controls; ND, nondiabetic CP; PD, prediabetic CP; ROC, receiver operating characteristic; T3cDM, postpancreatitis diabetes mellitus.
P < 0.05 is considered statistically significant.
 Figure 4.:
 Prediction probabilities and cutoff scores of ND-PD stratified groups for validation cohorts 1 and 2 (a) for validation cohort 1, computed cutoff for the model = 0.22. (b) For validation cohort 2, computed cutoff for the model = 0.50. True positives (purple), false negatives (red), true negatives (light blue), and false positives (green). (c) Metabolic profiles of nondiabetic CP patients with alterations in metabolites. CP, chronic pancreatitis; ND, nondiabetic CP; PD, prediabetic CP.
The goal is to identify nondiabetic CP patients who may develop glycemic alterations early in the course of the disease. Therefore, in addition to the above CombiROC analysis, we developed logistic regression (LR) equation. LR model was derived from 116 participants (ND = 87; PD = 29) using 3 metabolites, demographic, and morphological features. The outcome of the fitted LR equation ranged between 0 and 1; 0.01 to 0.49 indicates ND, and 0.50 to 1.00 indicates PD.
The fitted LR equation is:Logit (p^[x])=−2.14637+metabolites 0.00015463 [(Phosphatidylinositol)+0.00085024 (Ceramide) − 0.0030667 (Lysophosphatidic acid)]− 0.0069116 (Age)+0.0094184 (BMI)+0.092592 (disease duration of CP) − 0.19374 (Atrophy)+0.10562 (Ductal dilatation) − 1.44001 (Calcification).
Among 87 nondiabetic CP patients, 56 had HbA1c levels < 5.7 and were considered to be nondiabetic. This model identified 41 nondiabetic CP patients of 56 to have an outcome >0.5 using the LR equation, indicating that 73% of nondiabetic CP patients developed metabolic alterations. The remaining 15 (27%) with an outcome <0.5 are only nondiabetic without any metabolic aberrations. Box whisker plots of the 3 metabolites PI, ceramide, and LPA are shown in Figure 4c.
The integrated model was verified using Rapidminer to assess its performance for predicting glycemic alterations for the combined validation cohorts (n = 116). Of the 9 algorithms tested by rapidminer, the model generated by random forest algorithm demonstrated an AUC of 72% (see Supplementary Digital Content, Figure S3, https://links.lww.com/CTG/B115).
DISCUSSIONWe performed plasma metabolomic profiling in patien
Comments (0)