Animals and drug treatment
Animal experiments were carried out with the approval of the Ethics Committee of the First Affiliated Hospital of Xi’an Jiaotong University (No. 2022 − 1240). Male C57BL/6 mice, 6–8 weeks old, 20 g ± 2 g, were purchased from the Laboratory Animal Center of Xi’an Jiaotong University. Sirt3−/− mice were kindly supplied by the Jackson Laboratory. All mice were fed at 25 ℃ and 50-60% humidity with free access to water and food. 50 mg of resveratrol was added to 8.34 ml of drinking water and each mouse was gavaged with 100 ul of resveratrol for 2 weeks. Diluted resveratrol is for one-day use only and should be protected from light.
Model of intestinal I/R
Mice were anesthetized with 5% isoflurane and disinfected with Aner iodine. A midline incision was made in the upper abdomen to expose and dissociate the mesenteric artery. Closure of the mesenteric artery was performed for 60 min with a small artery clip to simulate the ischemic process. The arterial clamp was released to simulate the reperfusion process. Three different reperfusion times, namely, 15 min, 30 min, and 60 min, were used. The method used to establish the I/R model is shown in Figure S1.
Transmission electron microscopy
Intestinal tissue (1–2 mm3) was placed in an electron microscope fixative (G1102, Servicebio). The samples were dehydrated and embedded. Ultrathin tissues were stained and observed with an HT7700 transmission electron microscope at 80 kV.
Cell culture and an hypoxia-reoxygenation (H/R) model
Caco-2 colorectal adenocarcinoma (CL-0050, ProCell) cells were cultured in minimum essential medium (MEM, Gibco) with 20% fetal bovine serum (FBS, 10,091,148, Gibco) in a 5% CO2 incubator at 37 °C. Caco-2 cells were incubated in a microaerophilic system (Thermo Fisher) containing 1% O2, 5% CO2, and 94% N2 for 12 h to induce an H/R model.
Construction of stable shSIRT3 and siFoxO3a cell lines
Caco-2 cells were infected with shSIRT3 lentiviruses (GenePharma). Seventy-two hours after infection, shSIRT3-Caco-2 cells were selected with 3 µg/mL puromycin (A1113803, Gibco) for one week. Caco-2 cells were infected with siFoxO3a plasmid (Tsingke), and RNA and protein were extracted. shSIRT3 (forward: 5′-ccggGTGGGTGCTTCAAGTGTTGTTctcgagAACAACACTTGAAGCACCCACtttttg-3′ and reverse: 5′-aattcaaaaaGTGGGTGCTTCAAGTGTTGTTctcgagAACAACACTTGAAGCACCCAC-3′). siFoxO3a-1 (forward: 5′-GGAACGUGAUGCUUCGCAA-3′ and reverse: 5′- UUGCGAAGCAUCACGUUCC-3′), siFoxO3a-2 (forward: 5′-GCUCUUGGUGGAUCAUCAA-3′ and reverse: 5′- UUGAUGAUCCACCAAGAGC-3′).
Drug treatment and CCK8 assay
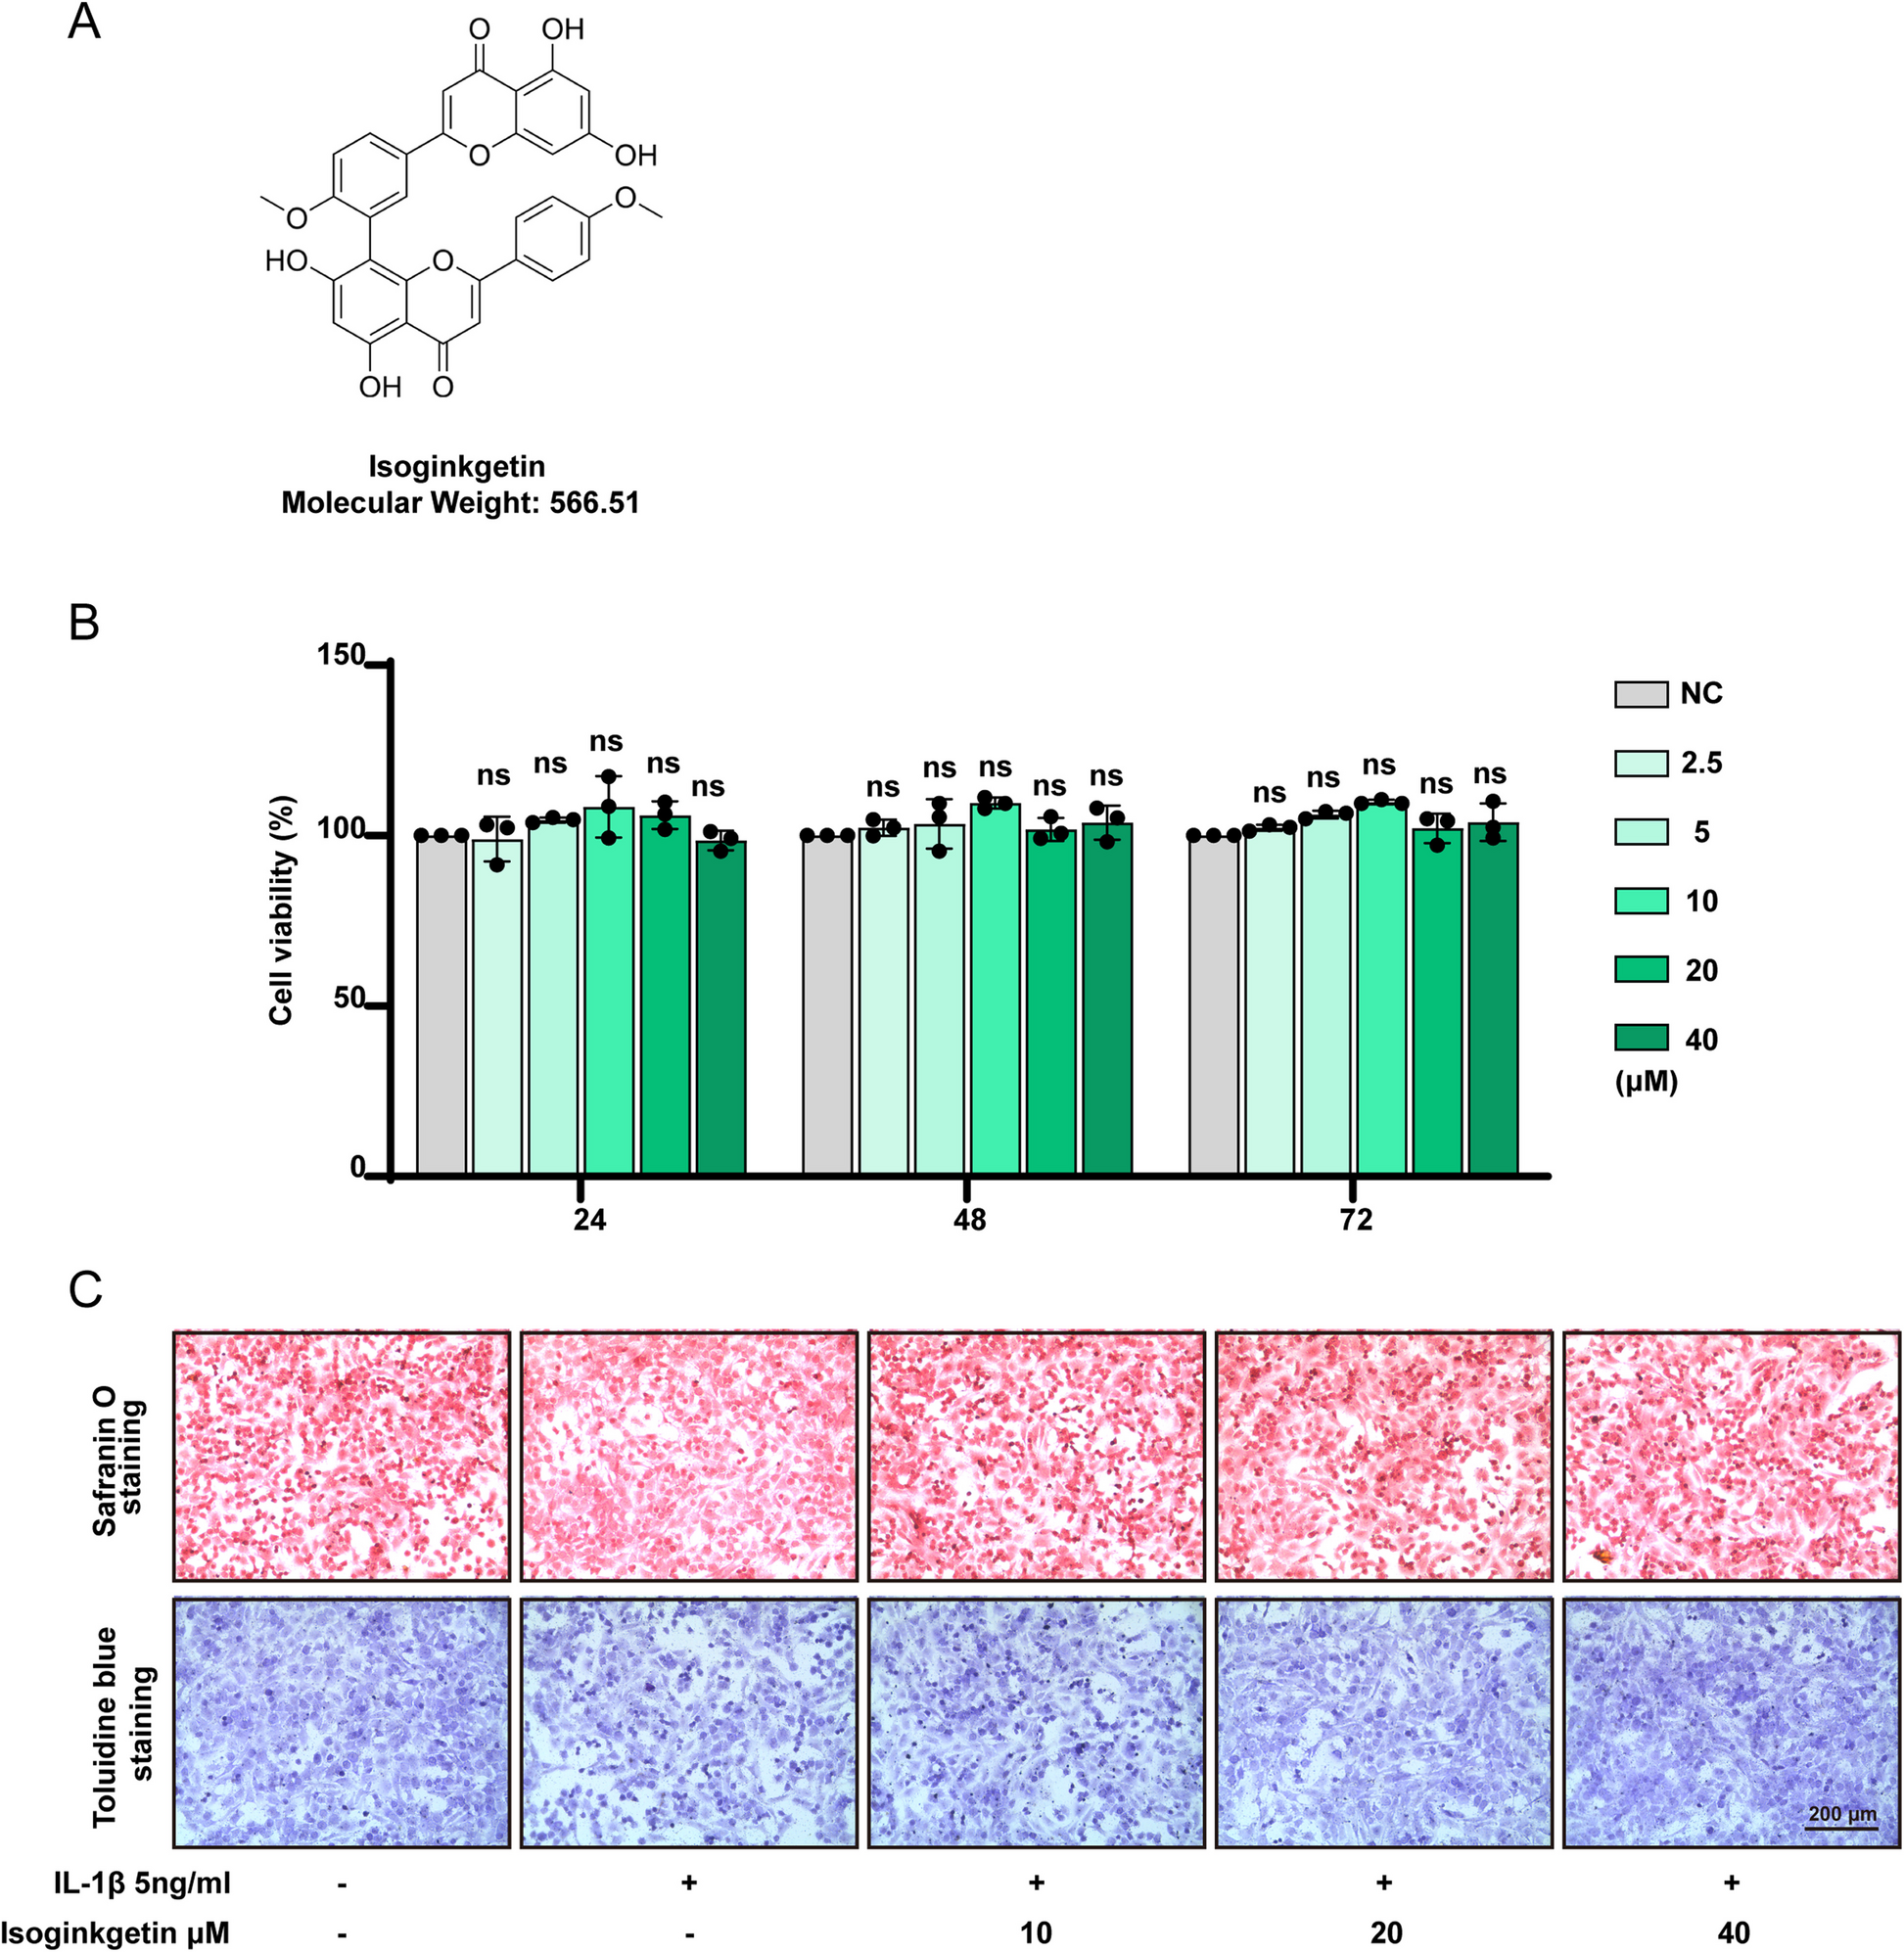
RSL3 (IR1120, Solarbio) was used to induce ferroptosis in Caco-2 cells at concentrations of 2, 4, 8, 12, 16, 20, 24 and 28 µM for 24 h. Resveratrol (GC14553, GlpBio) was dissolved in DMSO at a concentration of 10 mM. Caco-2 cells were seeded in 96-well culture plates (500 cells per well) and treated with resveratrol at concentrations of 2.5, 5, 10, 20 and 40 µΜ for 24 h, 48 h, or 72 h. Ten microliters of CCK8 reagent (C0005, TargetMol) and 90 µl of MEM were added to each well at 37 °C for 2 h. Before the test, 96-well plates were placed on a shaker for 5 min. Finally, the cell viability was quantified using a microplate reader at 450 nm. All experiments were performed in triplicate.
LIVE/DEAD assay
As in the CCK8 assay, 100 µl of LIVE/DEAD (L3224, Thermo Fisher Scientific) working solution was added to the wells. After 20 min of incubation in dark conditions at room temperature, the signal was visualized with a fluorescence microscope (DM IL LED, Leica) at 200X.
Western blot
Proteins were obtained from Caco-2 cells and intestinal tissues, resolved by electrophoresis, transferred to nitrocellulose filter membranes (HATF00010, Sigma), blocked with 5% skim milk in TBST, incubated with primary antibodies overnight at 4 °C and incubated with a secondary antibody for 1 h at room temperature. Electrogenerated chemiluminescence (ECL, P10300, NcmBiotech) produced the corresponding protein color. GAPDH was used as a control for whole homogenates. The results were analyzed for gray values using Fiji software. The primary antibodies used were anti-GAPDH (5174, Cell Signaling Technology), anti-Occludin (91,131, Cell Signaling Technology), anti-SIRT3 (5490, Cell Signaling Technology), anti-GPX4 (59,735, Cell Signaling Technology), anti-FTH1 (4393, Cell Signaling Technology), anti-ACSL4 (ab155282, Abcam), anti-ZO-1 (13,663, Cell Signaling Technology), anti-SIRT4(69,786, Cell Signaling Technology), anti-SIRT5(8782, Cell Signaling Technology), anti-SOD2 (24127-1-AP, Proteintech), anti-catalase (24127-1-AP, Proteintech) and anti-FoxO3a (10894-1-AP, Proteintech), and secondary antibody (7074, Cell Signaling Technology).
Measurement of inflammatory factor levels
Blood samples were taken from the inferior vena cava of anesthetized mice and stored in a coagulation tube. Centrifugation was carried out at 1500 × g for 10 min to separate the serum from the cells. The serum was then effectively collected. An ELISA kit was used to test interleukin-6 levels (IL6, ab100712, Abcam), tumor necrosis factor α levels (TNF-α, ab208348, Abcam), and lactate dehydrogenase levels (LDH, ab102526, Abcam) according to the manufacturer’s instructions. Before measuring LDH, the serum was diluted 1/10. The levels of IL6, TNF-α and LDH were measured with a microplate reader at 450 nm.
Intestinal permeability assay
According to the studies of Fox et al. (Fox et al. 2012) and Liu et al. (Liu et al. 2020), fluorescein isothiocyanate dextran 4 (FD4, 60,842, Sigma) was dissolved in normal saline at a dose of 0.5 mg/g. Mice were fasted for 8 h and gavaged with 0.5 ml of FD4 solution 3 h before ischemia. Serum was collected as described above. The concentration of FD4 was read with a microplate reader using an excitation wavelength of 490 nm and an emission wavelength of 520 nm. An intestinal fatty acid binding protein (IFABP) kit (abx153976, abbexa) was used to test intestinal permeability according to the instructions, and the absorbance at 450 nm was measured.
Iron, MDA, and glutathione assays
The total iron, Fe2+ and Fe3+ levels were assessed with an iron test kit (ab83366, Abcam) with a microplate reader at OD 593 nm. Malondialdehyde (MDA) was assessed with a Lipid Peroxidation Assay kit (ab118970, Abcam) at OD 532 nm. Glutathione, GSH, GSSG and GSH/GSSG levels were assessed using the GSH + GSSG/GSH Assay Kit (ab239709, Abcam) at OD 412 nm. Tissue samples and cell samples were prepared according to the manufacturer’s protocols.
Lipid peroxidation (LPO) assay
The intensely fluorescent BODIPY is an effective tracer of lipid trafficking (Bai et al. 1997). The C11-BODIPY 581/591 kit (D3861, Thermo Fisher) was used to test the LPO concentration in cells following the manufacturer’s instructions. Briefly, after cell treatment, 5 µM reagent was added to 96-well plates, and the cells were incubated for 30 min at 37 °C, washed with PBS three times, stained with 5 µg/ml Hoechst (33,342, Thermo Fisher) for 30 min at 37 °C, photographed under a fluorescence microscope (DM IL LED, Leica) and analyzed with Fiji software.
Hematoxylin and eosin (HE) staining
After reperfusion, intestinal samples were collected and fixed in 4% PFA (BL539A, Biosharp, China) at RT for 24 h. After dehydration, 5 μm sections were stained with HE. The staining was scored by three pathologists blinded to this research according to the methods of Chiu et al. (Chiu et al. 1970) and Hacioglu et al. (Hacioglu et al. 2005). A morphometric study was conducted using a Phmias microscope (MC-D310U/C).
Real-time polymerase chain reaction (PCR) analysis
Total RNA was obtained from Caco-2 cells treated with or without resveratrol using TRIzol reagent (15596018, Thermo Fisher). Complementary DNA was synthesized with All-In-One 5X RT MasterMix (592, abm). Quantitative PCR was performed with a SYBR Green assay (25741, Thermo Fisher). As the gene of interest, RT-PCR was run for SIRT3, SIRT4, SIRT5, and FoxO3a. GAPDH served as a reference gene. The primer sequences were as follows: SIRT3: (forward: 5’- CCCTGGAAACTACAAGCCCAAC-3’ and reverse: 5’- GCAGAGGCAAAGGTTCCATGAG–3’); SIRT4: (forward: 5′-CAGCAAGTCCTCCTCTGGAC-3′ and reverse: 5′-CCAGCCTACGAAGTTTCTCG-3′); SIRT5: (forward: 5′-TGGCTCGGCCAAGTTCAAGTATG-3′ and reverse: 5′-AAGGTCGGAACACCACTTTCTGC-3′); FoxO3a: (forward: 5′-CTTGATGTCTCAGGCCAGCA-3′ and reverse: 5′-CAAGTCGCTGGGGAACTTCT-3′); and GAPDH: (forward: 5’- CCACCCATGGCAAATTCCATGGCA-3’, and reverse: 5’- TCTAGACGGCAGGTCAGGTCCACC-3’).
ROS measurement
The level of ROS in the cells was detected with a MitoSOX Red kit (M36008, Thermo Fisher). After treatment, the cells were stained with 5 µM MitoSOX Red in HBSS/Ca/Mg solution, incubated for 10 min at 37 °C and washed with prewarmed HBSS/Ca/Mg solution three times. Next, the cells were stained with 5 µg/ml Hoechst for 30 min at 37 °C and washed with warm HBSS/Ca/Mg. The mean fluorescence intensity (MFI) was imaged by fluorescence microscopy (DM IL LED, Leica) and analyzed with Fiji software.
MitoTracker Red and immunofluorescence (IF) staining
After treatment, the cells were stained with the MitoTracker Red kit (M7512, Invitrogen, Thermo Fisher) in prewarmed HBSS/Ca/Mg for 30 min at 37 °C and washed with warm HBSS/Ca/Mg three times. The cells were incubated with the primary antibody for 2 h at room temperature, washed with prewarmed HBSS/Ca/Mg three times and incubated with secondary antibody (11,008, Thermo Fisher) and DAPI (36,935, Thermo Fisher) at the same time for 1 h at room temperature. After the cells were washed with prewarmed HBSS/Ca/Mg, the MFI was observed by fluorescence microscopy (DM IL LED, Leica) and analyzed with Fiji software. The primary antibodies used were anti-SIRT3 (5940, Cell Signaling Technology) and anti-SOD2 (13,534, Abcam).
Statistical analysis
GraphPad Prism 9.0 was used to analyze the data. GraphPad Prism 9.0 was used to analyze the data. In vitro studies, data are mean ± SD of three independent experiments in triplicates (n = 3). In vivo studies (including samples from mice), data are expressed as the means ± SD (n = 8), all experiments were repeated in triplicate. Normality was tested by the Shapiro-Wilk test. Measurement data were analyzed by Student’s t test or analysis of variance (ANOVA), and ranked data were analyzed by the Kruskal-Wallis H test. P < 0.05 was considered significant.


Comments (0)