Microarray data
Microarray-based gene expression profiles were obtained for Gene Expression Omnibus (https://www.ncbi.nlm.nih.gov/geo/). GSM849381, GSM849382, GSM849383 datasets and GSM849372, GSM849373, GSM849374 datasets contained expression profiles of hippocampus of normal rats and streptozocin (STZ) treated rats. Applying the limma package, the differentially expressed genes (DEGs) in hippocampus between normal rats and DM rats were analyzed with P value < 0.05 and |logFC| > 1.
GSM849381, GSM849382, GSM849383, GSM849384, GSM849385, GSM849386, GSM849387, GSM849388, GSM849389 datasets and GSM849372, GSM849373, GSM849374, GSM849375, GSM849376, GSM849377, GSM849378, GSM849379, GSM849380 datasets contained expression profiles of compared with the striatum, hippocampus and prefrontal cortex of normal rats and STZ treated rats. Applying the limma package, the DEGs in striatum, hippocampus and prefrontal cortex between normal rats and DM rats were analyzed with P value < 0.05 and |logFC| >1.
Data miner
To explore interactions between DEGs, a protein–protein interaction networks were analyzed using the Search Tool STRING (http://www.string-db.org/) to assess interactions between proteins. The cut-off value was set at a confidence score > 0.7 and individual nodes were filtered out. Then, the PPI pairs were inputted into Cytoscape software version 3.8.0 (http://www.cytoscape.org) to construct the PPI network.
Cell culture
The mouse hippocampal neuronal cell line HT22 were purchased from Qingqi (Shanghai) biotechnology Co. Ltd. The cell line was cultured in DMEM (Gibco, 11965118) supplemented with 10% FBS (Gibco, 10099141 C) and 1% penicillin and streptomycin (Solar bio, P1400) at 37 °C in 5% CO2.
Animals
C57BL/6 male mice aged 8 weeks were obtained from the SPF (Beijing) Biotechnology Co. The mice were placed in controlled environments (12-h light/dark cycle; 21 ~ 26 °C; 40–70% humidity) and had free access to enough food and water. All animal experiments were conducted with the approval of the Experimental Animal Ethics Committee of the First Hospital of Jilin University Hospital. All protocols were performed under conditions to minimize animal suffering.
Cell transfection
HT22 cells were planted on 6-well plates for 24 h. Different 2.5 µg plasmid FCGR2B pcDNA3.1 (+) (SHC1 pcDNA3.1 or sh-FCGR2B plasmid or sh-SHC1 plasmid) and 4 µL lipofectamine 8000 (Beyotime, C0533) in the experimental group were prepared with the corresponding volume of medium into 125 µL diluent. The amount of 125 µL lipofectamine-DNA mixture was uniformly added to the 2 mL fresh culture medium in each well and then gently mixed. There were 3 replicates in each group. Empty vector transfected cells were used as negative control.
DM model
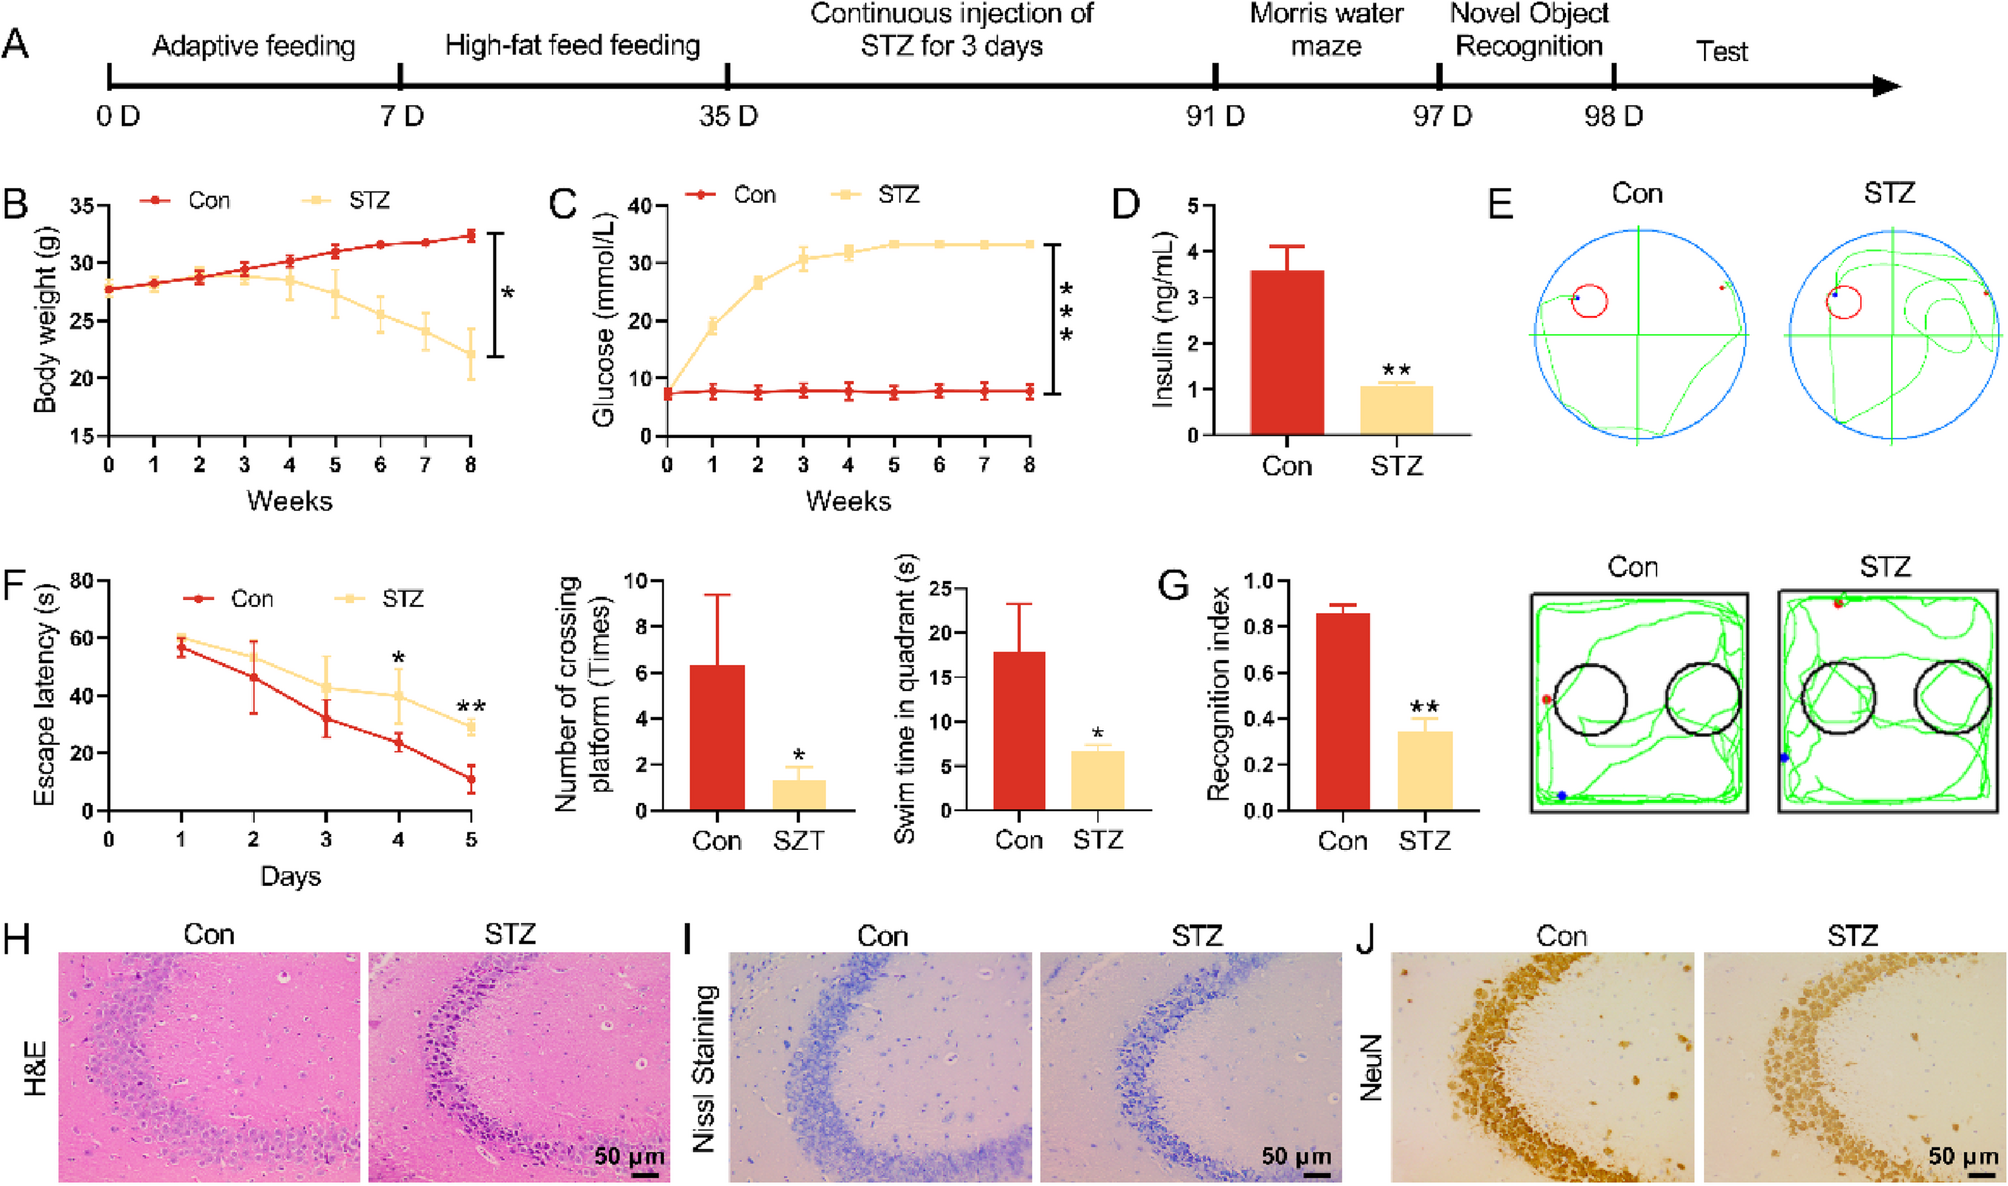
After 1 week of adaption, C57BL/6 male mice were fed a high-fat diet for 1 month, followed by a single dose of STZ, which was freshly prepared in cold 0.1 M pH 4.5 citrate buffer (60 mg/kg, intra-peritoneal injection, ip) to induce DM model. Three days after this STZ injection, fasting blood glucose (FBG) levels were determined. Levels > 11.1 mM were established as the diagnostic criteria for DM in this mice model. Blood glucose values were monitored as achieved from samples collected from the tail veins of the mice. Blood glucose levels and body weights were determined at 1, 2, 3, 4, 5, 6, 7 and 8 weeks after the STZ injection. After the treatments, the Morris water maze test and novel object recognition were carried out to examine cognitive function.
Hippocampal stereotaxic injection
At 4 days post-STZ injection, mice were anesthetized with pentobarbital sodium (40 mg/kg, i.p.) and fixed onto the brain-stereotaxic apparatus (Stoelting, USA). After the skull was fully exposed, a small hole was drilled at the anchor point. AAV-sh-FCGR2B were injected into mice of the DE group. A total of 2 µL (1012 vg/mL) of virus solution was injected into the hippocampus per site. To ensure that AAVs were transfected in sufficient hippocampal region for the subsequent synaptosomes isolation, the stereotactic coordinates were chosen at − 1.94 AP, ± 2.3 ML, − 1.8 DV, − 2.3 AP, ± 2.6 ML, − 2 DV, − 2.54 AP, ± 2.9 ML, and − 2.25 DV from Bregma according to the mice brain atlas. The wound was carefully disinfected and sutured.
Morris water maze test
Morris water maze test was carried out utilizing a pool (110 cm diameter) filled with tap water and white milk to evaluate spatial learning and memory ability as previously described (Curdt et al. 2022). The pool was divided into four virtual quadrants: I (target quadrant), II (initiation site), III, IV. A hidden circular platform (10 cm) was placed in the I quadrant. Each mouse was subjected to cued training and acquisition training. During 5 days of acquisition training, mice were allowed to find the platform freely. Once a day, the mice were placed in water facing the pool wall and recorded time to find the platform (escape latency) and the swimming pathway within the 120 s. Space exploration experiments were conducted in the morning. Remove the platform and drop the mice into the water from a random quadrant facing the pool wall. The track of mice searching for the original platform and its quadrant swimming time over the original platform were recorded within 120 s.
Novel object recognition
The Novel object recognition procedure consisted of habituation, familiarization, and test phases. In the habituation phase, each animal was placed in an empty test arena and allowed to explore it for 10 min in 1 day. On the second day, each mouse was placed in the same open-field arena, which contained two identical objects (A + A) placed side by side for 10 min (familiarization phase). After a delay of 6 h, one of the objects was changed to a novel object. Following the familiarization phase, the animal was returned to the arena with two objects, one of which was identical to the object used in the familiarization phase and the other was a novel object for 10 min. The behavior of the mice during the tests was recorded with a camera. For each animal, we measured the time spent exploring the novel object (TN) and the old object (TO) during the test phase. A recognition index was defined as (TN-TO)/(TN + TO). The arena and objects were cleaned with 75% alcohol after each test in order to eliminate olfactory cue.
Terminal Deoxynucleotidyl transferase dUTP Nick end labeling (TUNEL) staining
TUNEL assay was performed to determine the apoptotic rates of the cell, in the hippocampus region of the mouse using TUNEL kit (G1507-50T, Servicebio) according to the manufacturer’s instructions. Briefly, paraffin-embedded brain sections were fixed using 4% paraformaldehyde for 24 h, allowing sections to be prepared. The sections were deparaffinized with xylene, hydrated with ethanol, and incubated with Proteinase K (20 µg/mL) for 20 min at room temperature. The endogenous peroxidase was blocked with 3% H2O2, after which sections were incubated in terminal deoxynucleotidyl transferase (TdT) reaction mixture. The sections were then incubated with streptavidin-HRP and colorized diaminobenzidine (DAB). Nucleus were counterstained with hematoxylin and the sections were visualized and captured under a fluorescent microscope (Leica, Germany). TUNEL-positive cells were expressed as a percentage of the total cell count.
Golgi staining
After various experimental treatments, mouse brains were collected. The hippocampus was cut into 2–3 mm blocks and immersed in Golgi solution for 48 h-Golgi solution was changed once every three days for a total of 14 days. After that, samples were further sliced into 60 μm sections and added with Golgi developer solution. Images were captured as soon as possible using a super-resolution confocal microscope (Leica, VT1000S).
Nissl staining
The brain tissues were fixed in 4% paraformaldehyde and then cut into 4 μm thick coronal paraffin-embedded tissue sections (Leica, Germany). The sections were subsequently dewaxed using a gradient of xylene, pure ethanol, 95% ethanol and 70% ethanol, and distilled water followed by staining with Nissl staining solution (Service bio, G1036-100ML) for 5 min. Afterward, they were dehydrated 95% alcohol, placed in xylene for transparency, sealed with neutral gum, and observed under a microscope (Leica, Germany).
Hematoxylin & Eosin (H&E) staining
Following dewaxing and hydration, hippocampus sections were stained with hematoxylin for 3 min, and then incubated with eosin for 30 s. After that, the pathological changes of hippocampus were observed under an optical microscope.
Immunohistochemistry (IHC)
Paraffin-embedded hippocampus was subjected to dewaxing and hydration. For antigen retrieval, the slides were heated in 10 mM Tris-EDTA buffer (pH 8.0), 100 °C for 15 min. Then, the slides were treated with 3% H2O2 for 10 min and incubated with 10% goat serum for 0.5 h. Primary antibodies were applied to incubated the sections at 4 °C overnight, including anti-albumin (ALB) (Cusabio, CSB-PA001561LA01HU), anti-amphiregulin (AREG) (Boster, A01787-1), anti-FCGR2B (Abclonal, A12553), anti-c-fos (Genetex, GTX60996), anti-GABAA (Abcam, AB300069) and anti-NeuN (Boster, BM4354). The sections were incubated with HRP-conjugated secondary antibody at room temperature for 30 min. The sections were stained with DAB and counterstained with hematoxylin. The positive cells were observed under an optical microscope (Leica, German).
Immunofluorescence assay (IF)
Hippocampus were post-fixed in 4% paraformaldehyde overnight at room temperature and cut into 5 μm coronal sections. The sections were blocked with 1% BSA. Sections were incubated overnight at 4 °C with a primary antibody against FCGR2B (Abclonal, A12553) and NeuN (Boster, BM4354), SHC1 (Bio-swamp, PAB35440) and NeuN (Boster, BM4354), Ki67 (Abclonal, A20018), or Brdu (Abclonal, A1482). Immunoreactivity was visualized using Cy3-conjugated Goat anti-Rabbit IgG (or Cy3-conjugated Goat anti-Mouse IgG) and stained with 4′,6-diamidino-2-phenylindole (DAPI) for 3 min and imaged using a laser scanning confocal microscope (Leica, Germany). Sections were analyzed and quantified using Image Pro Plus to measure the number of positive cells, with six sections of each sample used to calculate the average.
Western blot
Hippocampus or HT22 cells were treated with RIPA Lysis Buffer (Biosharp, Hefei, China), and ground with liquid nitrogen to extract total proteins. The concentration of total proteins was detected utilizing BCA Protein Assay Kit (Biosharp). By performing 10% SDS-PAGE gel electrophoresis, the total proteins were separated and then transferred onto the nitrocellulose membranes. The membranes were incubated with primary antibody at 4 °C overnight, including anti-ALB (Boster, BM4963), anti-AREG (Protein tech,6433-1-Ig), anti-FCGR2B (Boster, A01690-1), anti-p-PI3K (Thermo Fisher, PA5-104853), anti-PI3K (Thermo Fisher, MA1-74183), anti-p-AKT (CST, 4060), anti-AKT (CST, 9272), anti-SHC1 (GeneTex, GTX50620), anti-c-FOS (CST, 2250 C), anti-CaMKII (abcam, ab134041), anti-GABAA (abcam, ab300069), anti-GABARAP (Boster, BM5326) anti-β-actin (Protein tech, 60008-1-Ig). The membranes were incubated with secondary antibodies at 37℃ for 1 h, including goat anti-rabbit HRP-IgG (Abways, AB0101) or goat anti-mouse HRP-IgG (Abways, AB0102). The immunoprecipitated bands were developed with ECL reagent (Millipore, WBKLS0100).
Quantitative real-time PCR (qRT-PCR)
For extraction of total RNA, hippocampus or HT22 cells were ground with liquid nitrogen and then treated with TRIzol™ reagent (Servicebio, G3013). Complementary DNA was synthetized utilizing PrimeScript™ RT reagent Kit (Takara, RR037Q). PCR reaction was carried out using TB Green® Premix Ex Taq™ II (Takara, RR820Q). The primer sequence was listed as Tables 1 and 2.
Table 1 Mouse primers used in qRT-PCRTable 2 Sh sequence of FCGR2BStatistical analysis
Each assay was performed for 3 times. Data were analyzed by SPSS 22.0 statistical software (IBM, Armonk, NY, USA) and expressed as mean ± standard deviation. Two-tailed Student’s t test and two-way ANOVA were used to analyze the statistical difference. P < 0.05 was considered as a significant difference.


Comments (0)