
Remember me
Two hundred and fifty-nine youth, including autistic gender-referred, nonautistic gender-referred, autistic cisgender, and nonautistic cisgender individuals, were recruited for this study. To be eligible participants had to be aged 7 to 14 years, have a good English language comprehension, be verbally fluent, live in the UK, have parental consent, and have a caregiver who also consented to participate. Additionally, gender-referred youth had to report a gender identity that did not align with their assigned sex at birth, cisgender youth had to report a gender identity that aligned with their assigned sex at birth, and autistic youth had to have a formal diagnosis of autism.
Participants with missing data on the key study variables (n = 34), uninterpretable data on the IAT (n = 1), or those who were nongender-referred but reported an experienced gender (i.e., the gender that a person identifies with) that did not align with their assigned sex at birth (n = 15) were excluded from the analyses.
The final sample included 209 participants aged 7–16 years. To enhance recruitment, participants aged 15 to 16 years were included following an amendment to the study protocol and receipt of the necessary approvals from the relevant ethics boards. Participant characteristics are presented in Table 1. A log-linear analysis indicated no significant differences in assigned sex at birth ratio across groups (p =.272, BF10= 0.13). However, groups differed significantly in age and FSIQ, as assessed by the Vocabulary and Matrix Reasoning subtests of the WASI-II [36]. To maximise statistical power, we deviated from the pre-registration, and analysed the unmatched samples and reported in this paper. However, matched-sample analyses yielded substantively identical results (i.e., no significant effect observed in the unmatched samples became nonsignificant in the matched samples, or vice versa) and are provided in the Supplementary Information. We would not have deviated from the presentation by using unmatched samples if the results in matched samples differed meaningfully from those in unmatched samples.
Table 1 Sample characteristics and two-way ANOVA statistics for age and FSIQ in Study 1Cisgender participants were recruited through schools, social media, autism charities, and the Kent Child Development Unit database. Gender-referred participants had been referred to a national specialist clinic for gender-related issues and were recruited from an ongoing prospective longitudinal study [37] and social media. Out of 86 gender-referred participants, 80 reported a gender identity that did not align with their assigned sex at birth (76 identified with the binary gender opposite to their assigned sex at birth, and 4 identified as both genders). The remaining six participants reported a gender identity that was congruent with their assigned sex at birth. Excluding these six participants results did not change substantively (see Supplementary Information), so they were included in the main analyses, deviating from the pre-registration to maximise statistical power. It is also important to note that these six gender-congruent participants were referred to a specialist clinic, reflecting the presence of significant concerns about gender identity even if the participant reported a currently congruent identity. Such fluidity over time may be a hallmark of gender diversity/dysphoria, so excluding those participants risks producing unrepresentative groups (though we stress we would have removed them if results changed meaningfully after their exclusion, which they did not). Nearly all participants (99.04%) were native English speakers.
All participants in the autism groups had a formal diagnosis of ASD (Mage of diagnosis = 8.76, SD = 2.83; n = 85), with the exception of five individuals who were in the process of assessment. Excluding these participants did not change the results (see Supplementary Information), so they were retained in the main analyses, deviating from the pre-registration to maximise statistical power. Autism features were assessed in all but eight autistic participants via the Brief Observation of Symptoms of Autism (BOSA) [38, 39]and in all but two via the Autism Diagnostic Interview-Revised (ADI-R) [40]. The BOSA is an observational diagnostic measure, derived from the Autism Diagnostic Observation Schedule–2 (ADOS-2) [41], designed for online/virtual administration. The ADI-R is a standardised, comprehensive diagnostic interview conducted with caregivers to assess their child’s early development and current behaviour. 96% of participants scored above the clinical cut-off on either the BOSA (≥ 6) or on all three ADI-R Domains: A (≥ 10), B (≥ 8), and C (≥ 3). Breaking this down, 85% of participants scored above the clinical cut-off on the BOSA (≥ 6) and a high percentage of participants also exceeded the clinical cut-offs on each domain of the ADI-R: 90% scored ≥ 10 in Domain A (Social Interaction), 91% scored ≥ 8 in Domain B (Communication), and 93% scored ≥ 3 in Domain C (Restricted and Repetitive Behaviours).
Prior to participation in the study, written electronic informed consent was obtained from all caregivers for their child’s participation, and written electronic informed assent was obtained from all participating children and young people. The study was approved by the Kent Psychology (approval number: 202216553002907588) and HRA and London–Hampstead (reference number: 22/LO/0805) Research Ethics Committees. The study was preregistered on Open Science Framework (preregistration can be viewed here: https://osf.io/u3xvm/?view_only=70e0a169251e49b9bf5aa6b6ffa26e2c). Deviations from the preregistration are presented in the Supplementary Information.
MaterialsGender identity IATTo measure implicit gender self-concept, we used the Gender Identity IAT employed by Gülgöz et al. [29]; following Olson et al. [30]. Children classified words and pictures using two response keys (A and L) into one of four categories: (a) Me [I, me, mine, myself]; (b) Not Me [they, them, theirs, other]; (c) Girl [four pictures of girls]; and (d) Boy [four pictures of boys]. The pictures of girls and boys were selected from the National Institute of Mental Health Child Emotional Faces Picture Set (NIMH-ChEFS) [42] and depicted neutral child faces with a direct gaze.
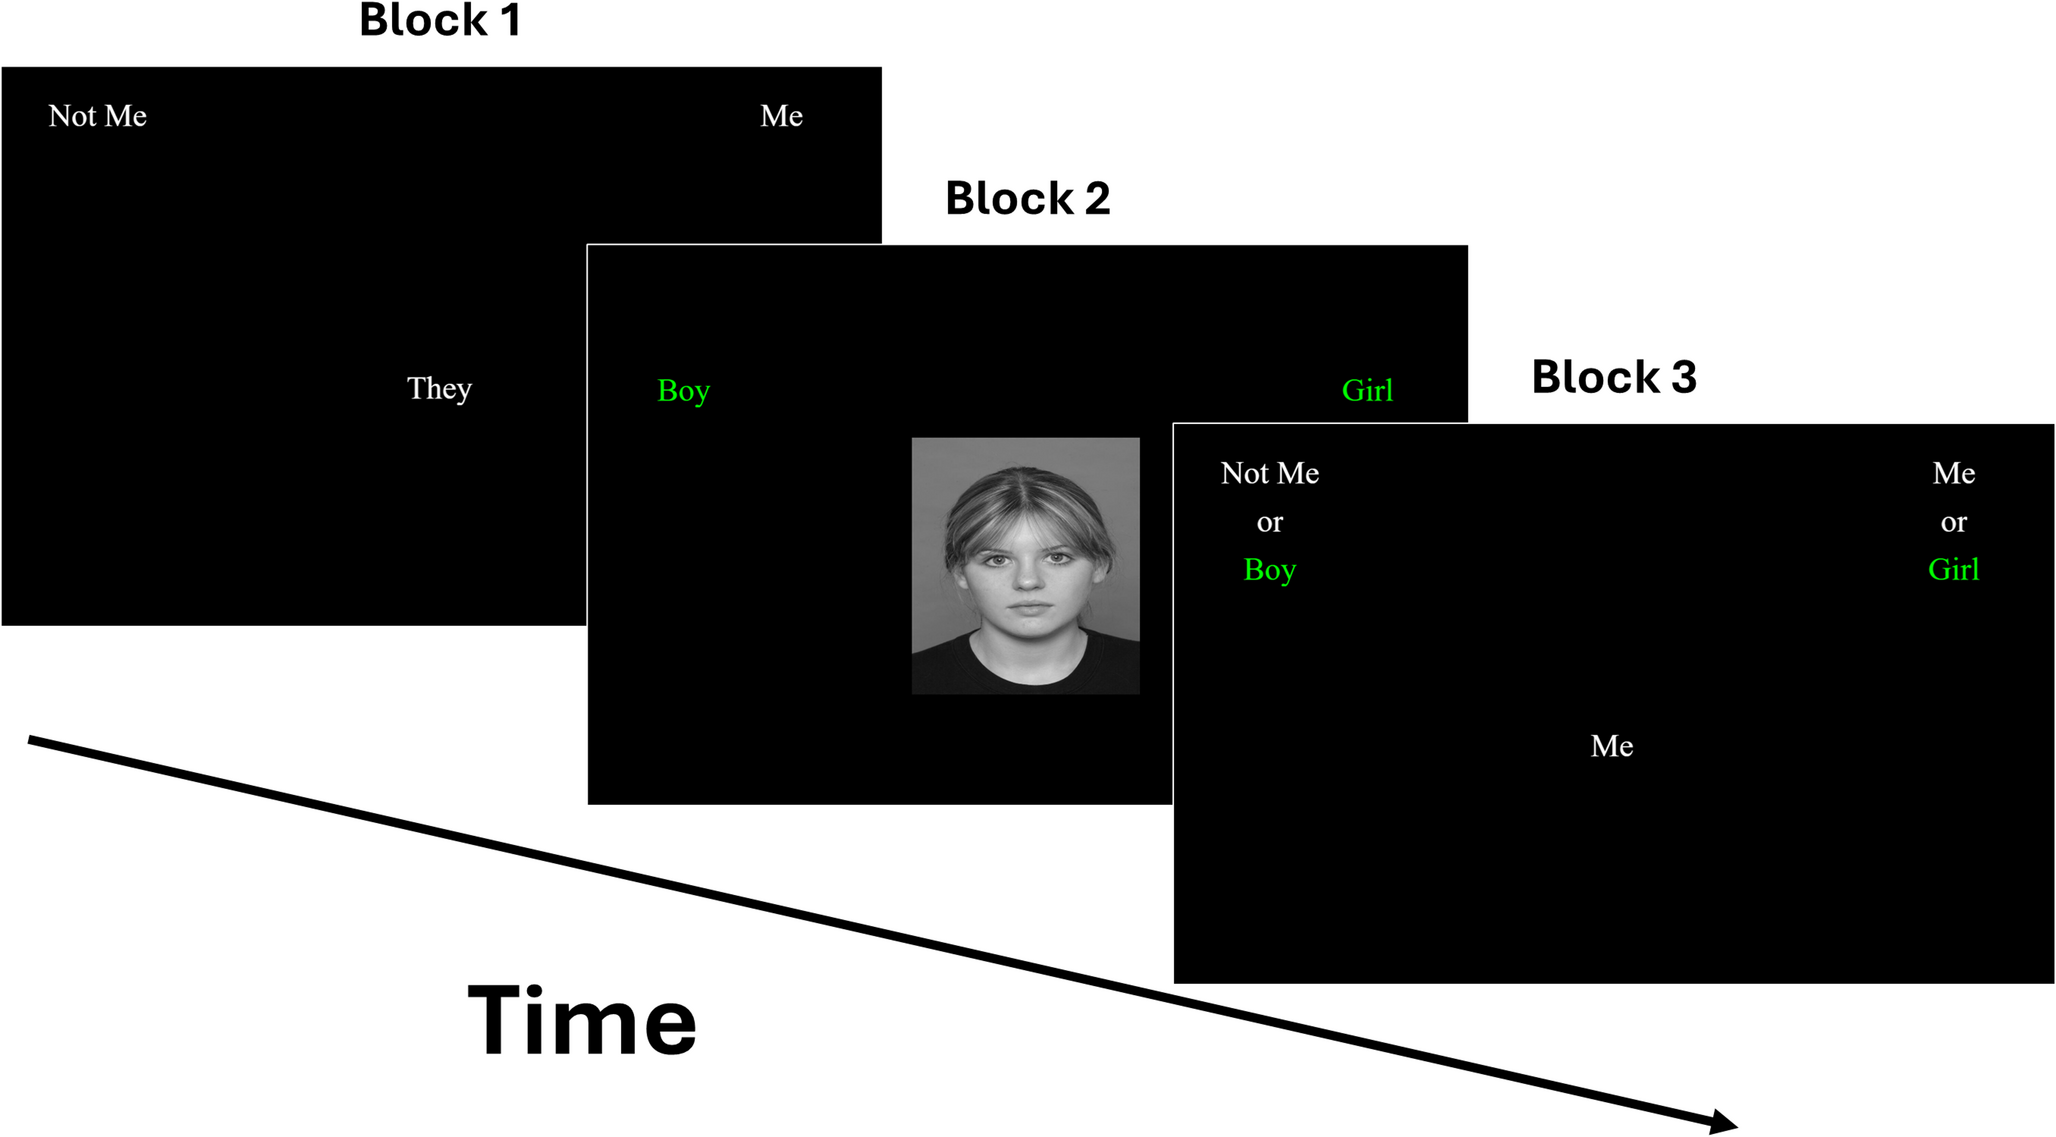
The task comprised seven blocks [20], of which an example of the first three blocks is shown in Fig.1. Blocks 1 and 2 introduced the binary categories separately (Me vs. Not Me; Boy vs. Girl) across 20 trials each. Blocks 3 and 4 presented combined categories (e.g., Me/Girl; Not Me/Boy), with block 3 as practice and block 4 comprising 40 experimental trials. In Block 5, the Me/Not Me categories switched sides. Blocks 6 and 7 repeated the combined sorting with the reversed Me/Not Me positions (e.g., Me/Boy; Not Me/Girl). The sequence of combinations in blocks 3–7 was counterbalanced across participants. To proceed from one trial to the next, participants had to provide a correct categorisation. In cases of incorrect responses, a red “X” appeared on the screen, and participants were instructed to correct their mistake in order to continue.
Fig. 1
Illustration of Blocks 1 (Me vs. Not Me), 2 (Boy vs. Girl) and 3 (Me/Girl vs. Not Me/Boy) of the IAT in Study 1. Note. In this example, block 5 would be identical to block 1, except with the Me and Not Me categories swapping sides. Blocks 6 and 7 would be identical to block 3, but with the Me and the Not Me categories again on opposite sides
Automatic association strength (D score) was calculated using Greenwald et al.'s algorithm [43]. This algorithm uses data from the critical blocks (blocks 3, 4, 6, and 7) only, and requires trials with latencies > 10,000 ms as well as participants with > 10% of trials < 300ms to be excluded (n = 1). Two standard deviations were calculated: one from the practice blocks (3 and 5), and another from the experimental blocks (4 and 7). Mean response times were then computed for each of these four blocks (3, 4, 6, and 7). Two difference scores were then calculated by subtracting the mean latency of block 6 from block 3, and the mean latency of block 7 from block 4. Each difference score was then divided by its corresponding standard deviation. Lastly, the two resulting values were averaged to yield the overall IAT D score.
Participants who responded faster in the Me/Girl condition than in the Me/Boy condition received a positive D score, indicating a female self-concept. Conversely, participants who responded faster in the Me/Boy condition than in the Me/Girl condition received a negative D score, indicating a male self-concept (i.e., intergroup scoring).
For the main analysis, we used an alternative method in which positive scores reflect a stronger association with one’s assigned sex at birth, and negative scores reflect a stronger association with the opposite sex (e.g., ingroup scoring). To achieve this, D scores remained the same for participants assigned female at birth, whereas positive and negative scores were reversed for participants assigned male at birth (i.e., positive scores were converted to negative scores and negative scores were converted to positive scores).
Task accuracy was calculated as the proportion of correct responses in the critical blocks (i.e., blocks 3–4, and 6–7). The task was programmed in PsychoPy (v2021.1.4) [44] and administered online via Pavlovia.
Explicit gender identityTo measure explicit gender self-concept, participants who reported a binary gender identity were asked, “How much like a boy/girl do you feel?” using a 3-point scale (“a little bit,” “moderately,” “very much”). The gender label matched the participant’s gender identity. Scores ranged from 1 to 3, with higher scores indicating a stronger explicit gender self-concept.
Participants who identified as nonbinary were asked two separate questions: one about feeling like a girl and another about feeling like a boy. Scores from these two questions were averaged to create a composite explicit gender self-concept score. Gender-referred participants who identified as genderfluid, questioning, or agender (n= 4) did not complete this task. Note that this single-item measure was developed by the authors based on current conceptualisations of gender in research [45]and on how gender is often described by gender diverse people, emphasising the internal experience of gender rather than characteristics associated with assigned sex at birth [46].
ProcedureThe majority of participants completed the Matrix Reasoning and Vocabulary subtests of the WASI-II, along with the IAT and the explicit task, during a virtual session with a researcher. A small subset of participants (7 out of 208) completed these tasks either in person or independently via Qualtrics. Following Nosek at al.’s [20] recommendation, all participants completed the IAT and the explicit task in counterbalanced order.
Statistical analysisTo examine between-group differences in IAT performance, we performed a series of analyses, each with a different dependent variable. First, we conducted a 2 (diagnostic status: autistic\non-autistic) × 2 (gender identity status: gender-referred/cisgender) ANOVA on the proportion of correct responses in the critical blocks (3, 4, 6, and 7) to assess group differences in IAT accuracy. Second, we conducted a 2 × 2 ANOVA on IAT D scores to assess group differences in the strength of the IAT automatic association. Third, we conducted a series of one-sample t-tests on IAT D scores to examine whether the strength of the automatic association was significantly above chance level in each gender identity group. Fourth, we conducted a 2 × 2 ANOVA on scores from the explicit gender identity task to assess group differences in the strength of explicit gender identity.
Effect sizes are reported using (a) partial eta squared (ηp²) with 0.01, 0.06, and 0.14 indicating small, medium, and large effects, respectively, or (b) Cohen’s d, with 0.20, 0.50, and 0.80 indicating small, medium, and large effects, respectively. Bayesian analyses assessed evidence strength for the alternative versus null hypothesis [47]. Bayes factors (BF₁₀) > 1 support the alternative hypothesis (with > 3, >10, and > 30 reflecting substantial to very strong evidence), while values < 1 support the null (< 0.33, < 0.10, and < 0.03 indicating substantial to very strong evidence). Analyses were conducted in R (v4.3.3) and JASP (v0.19.3).
Comments (0)