Study population
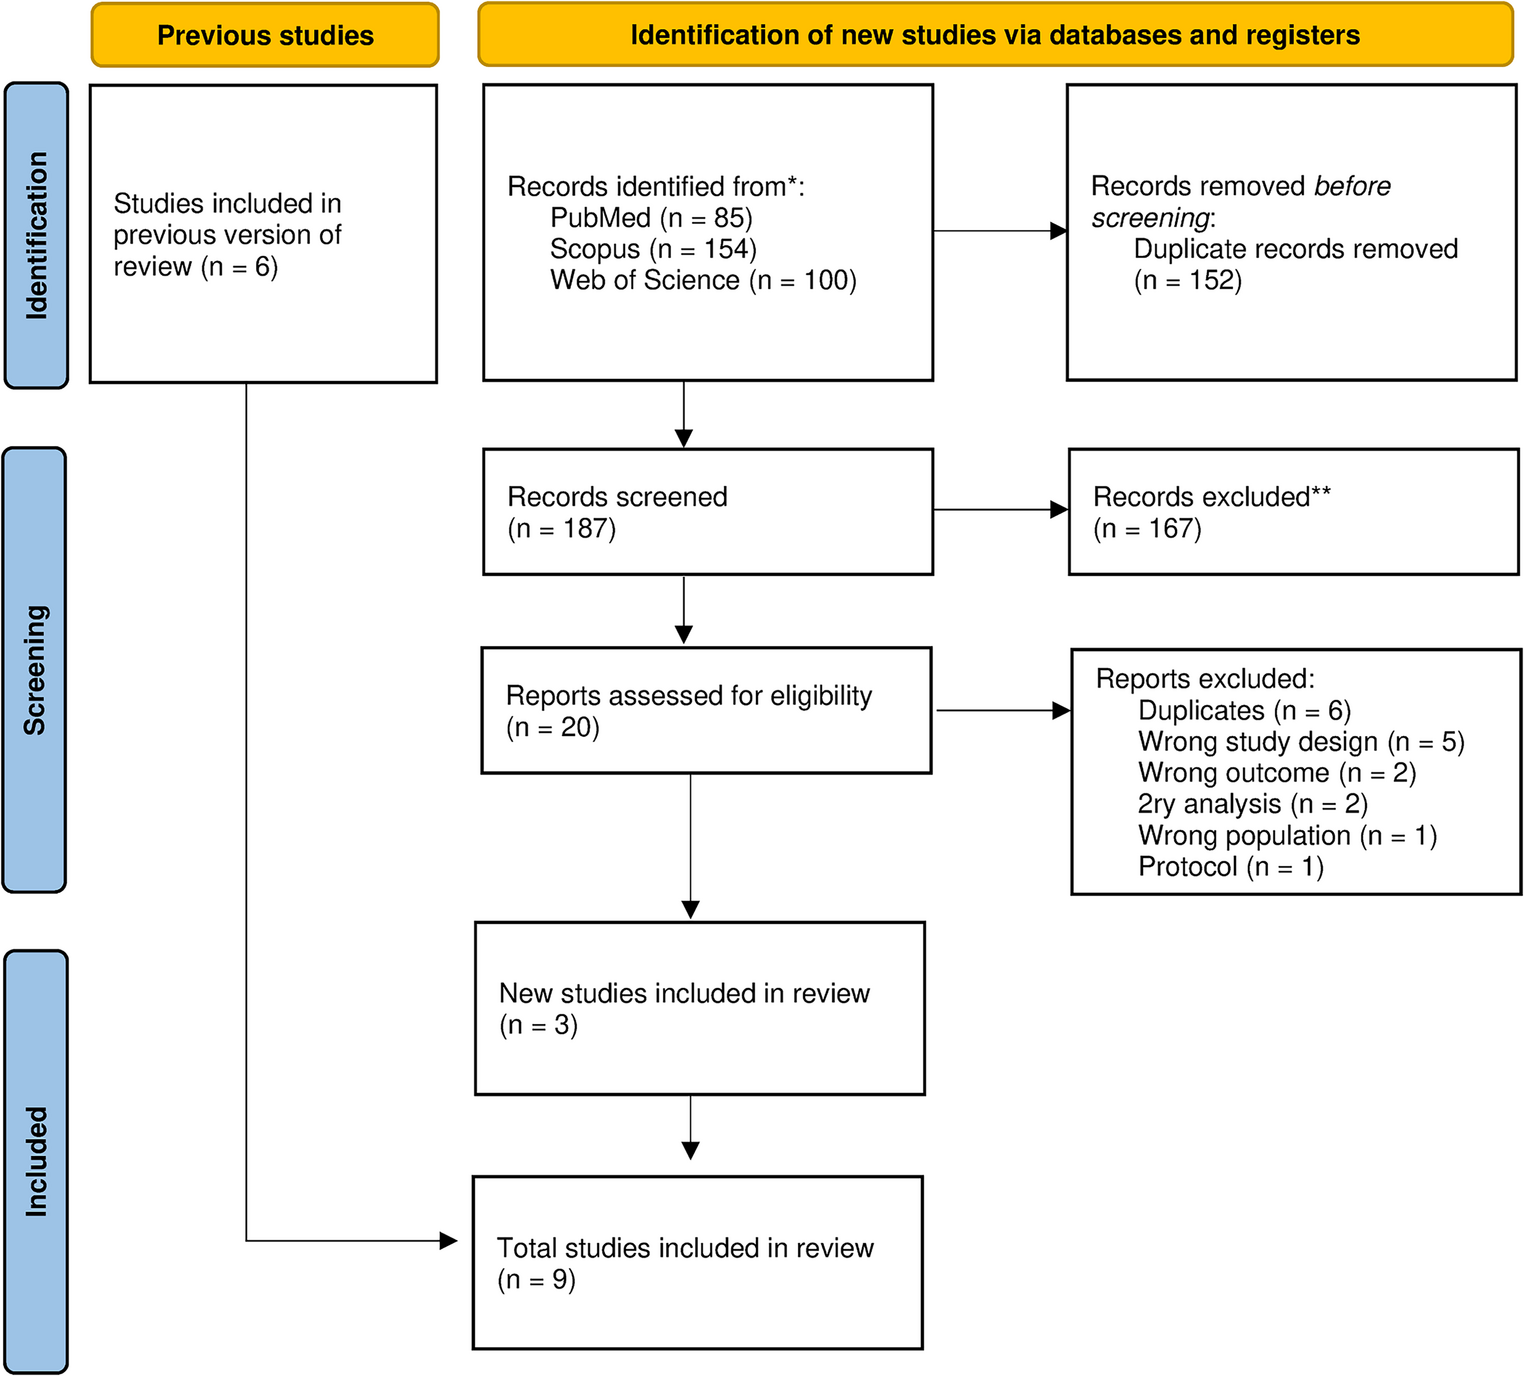
The Amsterdam Born Children and their Development (ABCD) study is a prospective population-based cohort study of 8000 children who were born in Amsterdam, the Netherlands [28]. Between January 2003 and March 2004, all pregnant women living in Amsterdam (n = 12,373, covering an estimated ≥ 99% of the target population) were invited to participate during their first prenatal visit to a general practitioner, midwife or gynecologist. A total of 8266 women (67%) returned a completed questionnaire that was sent to their homes (phase 1). Mothers and children were followed up during infancy (phase 2), at age 5–6 years (phase 3), at age 11–12 (phase 4) and age 15–16 (phase 5). The present study used data from phases 3, 4 and 5. We included children with enough data available to calculate a self-control score and with data available for at least one of the four mental health outcomes (see below). Of the 4582 children included in phase 3, 1998 children were excluded because they had incomplete information on self-control measures at age 5–6 or 11–12. Furthermore, 809 children were excluded because there was no outcome data available at age 15–16. In total, 1775 children were included in the study, of whom 829 (46.7%) were boys and 946 (53.3%) girls (Supplemental Fig. 1). Approval of the study was obtained from the Central Committee on Research involving Human Subjects in the Netherlands, the Medical Ethical Committees of participating hospitals, and from the Registration Committee of Amsterdam, and was conducted according to the Declaration of Helsinki. Each mother gave written informed consent for herself and her child, and the children themselves provided consent at age 16.
Self-control
Our measure of self-control across childhood was based on the work of Moffitt et al. [8], Fergusson et al. [17], and Richmond-Rakerd et al. [22], as discussed in the Introduction, although not constructed in exactly the same way (fewer repeated measurements and using different scales). In all three studies, self-control was assessed through repeated measurements collected at various points during childhood (ages 3–11 and 6–12), using reports from multiple informants—including parents, teachers, and the children themselves—to capture different facets of the construct. We here used data collected at age 5–6 years and at age 11–12 years to construct the self-control measure during childhood (fewer repeated measurements compared to the other studies). From the data collected at age 5–6, we used the ‘hyperactivity/inattention domain’ (5 items) from the Strengths and Difficulties Questionnaire (SDQ) [29] which was filled in by the mother (Cronbach’s α = 0.75) and the school teacher (α = 0.84). From data collected at age 11–12, we used the same five items from the SDQ, which was filled in by the mother (α = 0.80), the school teacher (α = 0.86) and the child (α = 0.86). We also used nine items from the Behavior Rating Inventory of Executive Function (BRIEF) [30] filled in by the mother (α = 0.83), that focused on self-control in the domains of working memory, emotional control and inhibition. Finally, we used five items from the Substance Use Risk Profile Scale (SURPS) (α = 0.74) [31], which were all in the impulsivity domain. Supplemental Table 1 provides an overview of all the self-control items.
Table 1 Demographic characteristics and covariates per self-control quintileIn these measures, a higher score indicated lower self-control. To this end, we had to invert some of the data. To calculate an overall child self-control score, each child’s total score per questionnaire was standardized (Z-score). These scores were then summed and divided by the number of questionnaires filled in per child (maximum of 7) to get an overall self-control score per child. The final self-control score was therefore a continuous variable.
To assess whether our construct indeed reflects a single self-control factor, we conducted a confirmatory factor analysis (CFA) using the lavaan package in R on the seven scales upon which the measure was based. We used the WLSMV estimator for categorical data and accounting for non-normality of distributions. Fit indices indicated an acceptable to good model fit (CFI = 0.98, TLI = 0.97, RMSEA = 0.08, SRMR = 0.06). Factor loadings ranged from 0.49 to 0.90. These outcomes suggest that the one-factor solution provides a moderate to good fit to the data.
For our descriptive table and for the graphical presentation of the results, the self-control variable was categorized into quintiles. In addition, we calculated separate self-control scores for age 5–6 and age 11–12 to evaluate the development and relative stability of self-control. We calculated these scores in the same way as our overall self-control score. We examined the correlations between the individual questionnaires, self-control per age period and overall self-control.
Outcome measures
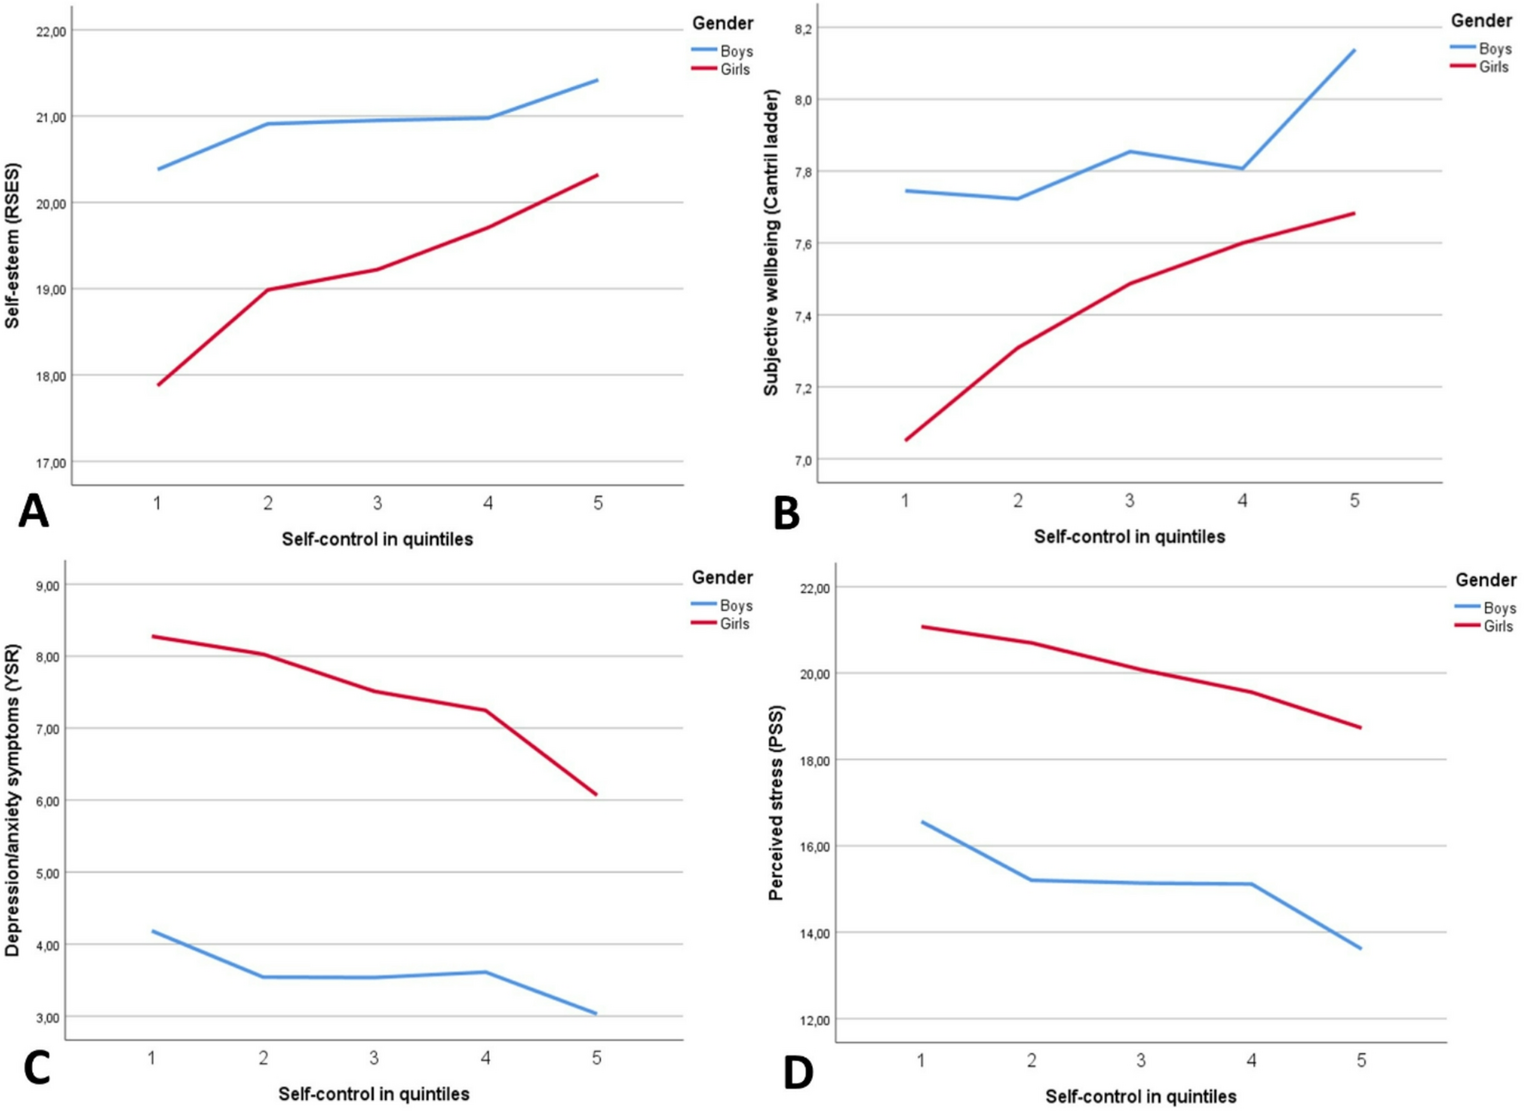
As outcome measures at the age of 15–16 years, we focused on the mental health factors self-esteem, subjective well-being, depression/anxiety symptoms and perceived stress. The Rosenberg Self-Esteem Scale (RSES) was used to measure self-esteem [32]. We used a short version containing five items (n = 1505), of which the reliability was α = 0.82. The Cantril ladder was used to score subjective well-being with the question ‘Rate your life on a scale from 1–10’ (n = 1683) [33]. The Youth Self Report (SR) focuses on anxiety and depressive symptoms [34]. We used a short version of 16 questions (n = 1773), with α = 0.87. Finally, the 10-item Perceived Stress Scale (PSS) was used to measure perceived stress (n = 1434), with α = 0.78 [35].
Demographic characteristics, covariates and mediator
To describe our study population, we included the variables gender, ethnicity of maternal origin (Dutch, other western and non-western, based on the country of birth of the mother and grandmother of the participants), household characteristics (two-parent household, single-parent or other), mean age of the child during the age 15–16 data collection, age of the mother during the age 11–12 data collection, and age of the father during the age 11–12 data collection. As a covariate, we included socioeconomic status (SES) because the literature shows that higher self-control is associated with higher SES of the parents [8, 17]. SES was measured using the highest level of education from either parent assessed during the age 11–12 data collection and applying the three categories based on the International Standard Classification of Education (ISCED) (category 1 = low education (no education, early childhood, pre-primary, primary, lower secondary stage or second stage of basic education (< 6 years education)), category 2 = medium education (upper secondary, post-secondary, non-tertiary (6–9 years education)) and category 3 = high education (short-cycle tertiary, Bachelor, Masters, Doctoral or equivalent (≥ 10 years education)) [36]. Conduct problems was investigated as a mediator and determined by the Conduct problems domain from the SDQ measured during the age 11–12 data collection, which was filled in by the mother (α = 0.53), teacher (α = 0.61) and the child (α = 0.40). These scores were added together and divided by the number of questionnaires filled in.
Statistical analysis
A non-response analysis was performed to examine the representativeness of the included children. The included children were compared to the excluded children with regard to: ethnicity of maternal origin, age of the mother, age of the father, household characteristics (all during the age 5–6 data collection), IQ, gender, socioeconomic status of the parents and conduct problems by T-tests (continuous variables) and Chi-square tests (categorical variables).
To examine development and stability of self-control over time, we made a table and Sankey diagram with self-control in quintiles during the age 5–6 and age 11–12 data collection phases. We applied Spearman’s rank correlation coefficients to quantify the stability of self-control over time.
We stratified all analyses by gender applying concurrent, side-by-side models, because the literature shows differences in self-control by gender and differences in mental health outcomes by gender [5, 6, 14]. We also formally tested whether gender was a significant effect-modifier for each outcome variable by adding an interaction term.
We applied linear regression analysis to assess the association between the self-control measure and the four mental health outcomes (model 1) and additionally controlling for SES (ISCED) (model 2). Mediation analysis was performed using the PROCESS tool for SPSS [37]. We assessed the effect of self-control on conduct problems (the a path), the effect of conduct problems on mental health outcomes (the b path), the simple effect of self-control on mental health outcomes (total effect or c path), the effect of self-control on mental health outcomes controlling for conduct problems (the direct or c′ path), and the effect of self-control through mediator conduct problems on mental health outcomes (the indirect effect as the product of a and b). A 95 percentile bootstrap CI was calculated based on 5,000 bootstrap resamples for the indirect effect, in order to test for significance. See Supplemental Fig. 2 for a schematic overview of this analysis.
Furthermore, we performed a sensitivity analysis on a subgroup of children with available IQ scores at age 11–12 years. Previous longitudinal studies have shown that higher self-control is associated with a higher IQ and it is therefore important to control for IQ of the child [8, 17]. We measured the IQ of the child using the Raven’s intelligence test [38]. The models for the sensitivity analysis are the same as models 1 and 2, but with additional adjustment for IQ in model 2, and will be referred to as models 1a and 2a.
P-values of less than 0.05 were considered to be statistically significant.

Comments (0)