
Remember me
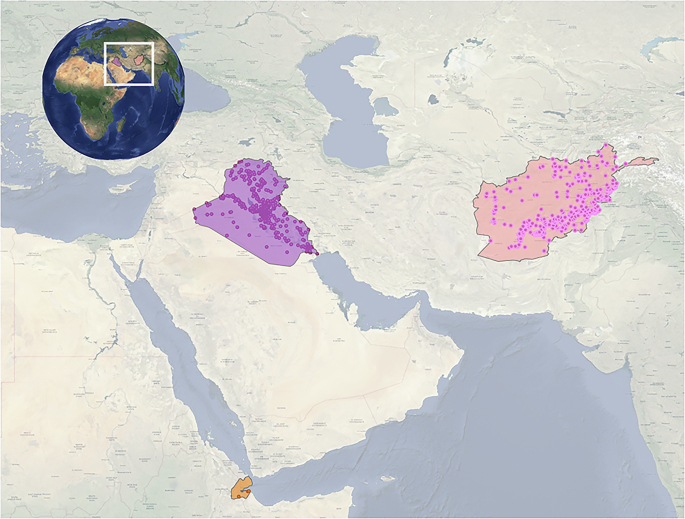
There were 285,810 MODIS active fire detections in Iraq and 3702 in Afghanistan from 2002 through 2012 (Fig. 2). In both countries, the distributions of retrieval confidence were skewed, with most values concentrated on the right towards higher confidence. The median retrieval confidence was 77 in Iraq (IQR = 26) and 69 in Afghanistan (IQR = 30). The mode (i.e., the most frequent) retrieval confidence in both countries was 100. The distributions of FRP were also skewed, but with the data concentrated at lower values. The median FRP was 21.6 MW (IQR = 24.8 MW) in Iraq and 19.9 MW (IQR = 30.4 MW) in Afghanistan. The higher median FRP in Iraq is likely due to the dominance of hotter industrial combustion sources like oil and gas flaring. The higher FRP IQR in Afghanistan suggests a greater mix of fire sources and heterogeneous topography, which may reduce detection particularly of lower-temperature fires.
Fig. 2
Flow diagram of MODIS Active Fire data processing steps to identify persistent burning sources within 5 km of military base locations in Iraq and Afghanistan between 2002 and 2012.
HDBSCAN resultsAfter stratifying all MODIS fires by year and applying HDBSCAN, we distinguished persistent burn locations (fire observations that were part of clusters) from aberrant burning occurrences, which were classified as noise points (Fig. 2).
In Iraq, the tuned value of k (minimum number of fires in a cluster) was 5 in all years except for 2003 when it was 6. With this specification, noise observations accounted for 0.9% to 2.5% (overall 1.6%) of the total number of detections, leaving 281,352 fires that were clustered (Fig. 1). The number of annual clusters ranged from 92 to 192, and the number of fires per cluster was highly skewed, with medians ranging from 12 to 27.
We observed that the number of fires remained relatively stable from 2004 through 2009, with annual totals ranging from approximately 23,000 to 26,000 (Table 1). This consistency likely reflects the sustained use of burn pits and other combustion sources throughout the main years of U.S. operations. Notably, there was a peak in the number of clusters in 2010, followed by increases in total fire counts in both 2011 and 2012, reaching 32,256 and 36,776, respectively. These later peaks may correspond to heightened activity related to base closures and waste disposal as the U.S. military began its formal withdrawal from Iraq. In 2012, the year after withdrawal from Iraq many fires were still detected. It is possible that intensified clean-up efforts, increased burning of remaining waste, or reactivation of burn pits contributed to these elevated fire counts. In addition, Iraq’s substantial oil and gas infrastructure, particularly in the south, showed significant increases in flaring after 2010 (IEA Iraq 2000-2030 flaring trends) [24].
Table 1 Annual Summary Statistics of MODIS Active Fire Observations, Clusters, Noise, and Median Number of Fires per Cluster for Iraq and Afghanistan.In Afghanistan there were far fewer fires detected (3702) and the annually tuned k was consistently 3. The annual number of clusters ranged from 24 to 70, with a small median number of fires per cluster across all years (between 4 to 6). The proportion of noise observations was much higher than in Iraq, ranging from 5.9% to 18.9% (Table 1). The smaller clusters and higher proportion of noise points is indicative of less tightly clustered fire signals and lower burning persistence. After excluding noise observations there were 3199 fires for analysis.
We observed a peak in the number of clustered fires in 2003, followed by a second, slightly lower peak in 2010 that aligns with the troop surge [25]. The higher number of fires in 2003 may reflect the widespread use of burn pits at newly established bases that lacked formal waste infrastructure. Early-stage burning likely involved more intense combustion, increasing the likelihood of detection. By 2010, however, the Department of Defense had begun introducing incinerators and implementing restrictions on open-air burning, potentially reducing both the frequency and intensity of detectable fires.
Notable in both Iraq and Afghanistan, in 2002 there were far fewer observations because the MODIS Aqua satellite only came online in July of that year.
Near- and on-base burningOf the 612 bases in Iraq, 398 (65%) had at least one fire cluster within 5 km during the study period, encompassing a total of 71,092 fires (Fig. 2, Table 2). The median number of fires in a cluster linked with a base was 20 but had a wide range from 5 to 10,235. With a median membership probability of 0.91 and small IQR (0.12), the fires near Iraqi bases were strongly associated with clusters, suggesting the core of the cluster was dense.
Table 2 Summary statistics (counts, medians, and interquartile ranges) of clustered fires detected within 5 km of military bases in Iraq and Afghanistan.Geographically, the most prominent “hotspots” in Iraq were near bases in the southern Gulf cities Basra and Az Zubayr and northern portions of the country near Baghdad, Kirkuk, and Mosul (Fig. 3).
Fig. 3
Map of the clusters of MODIS-detected fires within 5 km of bases during the study period in Iraq (top) and Afghanistan (bottom); circles are sized by the number of fires in each cluster.
Of the 435 bases in Afghanistan, 122 (28%) had at least one fire cluster within 5 km during the study period, encompassing a total of 776 fires (Table 2, Fig. 2). In contrast to Iraq, the median number of fires per base was smaller (5 with range 2–73) and the clusters were less tightly formed, with a median membership probability only 0.16 (IQR = 0.59). This again suggests that fire clusters in Afghanistan were more dispersed and less persistent than those in Iraq. Another notable difference was in the FRP, which was higher in Iraq (14.3 MW) than Afghanistan (13.2 MW), indicating higher temperature combustion activity in Iraq. Nevertheless, the high IQRs for each country suggest that the FRP values in both countries span a broad range, with some fires being much more intense than others, and indicative of different combustion sources.
The most prominent “hotspots” in Afghanistan were in the northeastern portions of the country on the border of Pakistan. Groupings of smaller clusters appeared in Kabul and in the south near Kandahar (Fig. 3). Consistent with how many fewer fires were detected in Afghanistan, the range of fire clusters shows far less persistence compared to Iraq.
Interestingly, despite the median retrieval confidence being similar, the median FRP of fires occurring within 5 km of military bases was lower than that of all detected fires in both Iraq and Afghanistan (Table 2). This suggests that fires near bases, which likely included burn pits, waste burning, and other localized combustion, tended to be lower in intensity compared to regional fires that included hotter combustion sources such as oil and gas flaring and refinery flaring. This difference aligns with the expectation that open-air waste burning and smoldering fires common on or near bases produce weaker thermal signatures than more industrial or landscape-scale fires.
The bases with the most persistent fire signals within 5 km were all located in Iraq, some with identified clusters across all 11 years of the study (Table 3). The most active burning locations included bases in the Gulf region of Basra, including Camp Hutch/Steelback (10,235 fires over 11 years), Manchester (9815 fires over 11 years), and Camp Al Saad (7520 fires over 11 years). To the north, Kirkuk, which is both the name of the base and the region, also showed persistent burning. Balad, the largest U.S. military base in Iraq, located outside Baghdad, had one detected cluster that persisted across 6 years of the study period.
Table 3 Summary statistics of the bases in Iraq and Afghanistan with largest number of clustered fires within 5 km. Number of annual clusters, number of years that satellite detections were observed, and the median fire radiative power.The bases in Afghanistan were associated with fewer fires, but many of the bases were small and within close proximity to each other. The highest concentrations of fire activity occurred in the mountainous northeast near the Pakistan border including Phoenix, which saw persistent burning over seven years, and Warheit, located 100 km to the north. Jalalabad, a city east of Kabul, also exhibited fire clusters, along with two of the largest bases in Afghanistan, Camp Bastion (west of Kandahar) and Bagram (north of Kabul), which had clusters in four to six years of the study period.
In Iraq, bases associated with oil and gas flaring such as Camp Al Saad (median FRP = 26.1 MW), had notably higher FRP than bases where on-base open-air burning was the dominant combustion source, such as Joint Base Balad (median FRP = 6.2) (Table 3). In contrast, FRP values were highly variable and inconsistent in Afghanistan, likely due to the smaller numbers of fires in clusters near the bases.
Validation with imageryWe validated the clustered fire signals with high resolution military imagery over the study period for the bases identified in Table 2. Where available, we extracted images from Google Earth for this publication. Interesting patterns emerged between the two countries. In Iraq, we noted the most persistent burning occurred near bases in very tight clusters. For example, the 10,235 fires at Camp Hutch/Steelback, which was also near Shaibah, Chindit and Waseem, were in three clusters both on and near the base (Fig. 4). The persistent burning cluster to the south west was identified in both military imagery and GoogleEarth from 2002 to be oil and gas flaring (Fig. S1).
Fig. 4
MODIS-detected fires near Camp Hutch/Steelback, Iraq (top) where nearby oil and gas dominated the fire signal, and at Joint Base Balad, Iraq (bottom) where an on-base burn pit was identified. The red dots are the MODIS-detected dires, blue dots are the georeferenced bases, and red dotted lines are the 5 km buffers around the bases.
Similarly, with 2009 and 2010 military imagery, we confirmed a large cluster of fires just a few hundred meters to the west of Camp Al Saad. When zoomed in we identified the fire signals appearing to be from oil and gas operations and the 2010 GoogleEarth image shows active flaring (Fig. S1). K-1 (Kirkuk), close to Barbarian, had multiple sources of burning both on and off base, including oil and gas and a possible burn pit identified from 2003 military imagery (Fig. S2).
A smaller cluster of fires were observed at Joint Base Balad where we identified a burn pit in the northeast corner of the base (Fig. 4).
As expected, fires in Afghanistan were more scattered around military bases, with fewer of the tightly formed clusters observed in Iraq. Many Afghan bases were situated in mountainous terrain, and their physical footprints were smaller. For example, although a cluster of fires was detected near Phoenix (Fig. 5), it appeared to be shared by multiple small bases near the Pakistan border. The burning in this area appeared to occur off-base and from sporadic sources. In contrast, Camp Bastion, a large airfield located further south in a sparsely populated desert region of Afghanistan showed evidence of on-base burning at two distinct locations, consistent with burn pit activity (Fig. 5). This figure also highlights inconsistencies in the military geocodes, which referred to the same base but were associated with slightly different geographic coordinates.
Fig. 5
MODIS-detected fires near Phoenix (Vimoto), Table Rock, Atlanta (Restrepo), Korengal, Vegas, and Reno, Afghanistan (top), and at Camp Bastion, Afghanistan (bottom) where two on-base burn pits were identified.
Sensitivity analysis: MODIS and VIIRSThe civilian burn pit, located approximately 2 km to the south of Camp Lemonnier, Djibouti was detected by both MODIS and VIIRS between 2016 and 2023 (Fig. 6). Using HDBSCAN, we identified a distinct cluster at the burn pit site. VIIRS detected 39 fires events whereas MODIS recorded only 13, a three-fold difference. This discrepancy highlights the greater sensitivity and higher spatial resolution of VIIRS compared to MODIS, particularly in detecting smaller or lower intensity fires. Notably, the median membership probability of the MODIS fires in the cluster was 0.48 compared to 0.61 for VIIRS, indicating that the VIIRS-detected fires formed a tighter and more peristent cluster. Although FRP values from MODIS and VIIRS are not directly comparable due to differences in spatial resolution, the spectral bands used by the intruments, and the retrieval algorithms, MODIS recorded a median FRP of 15.3 MW, while VIIRS had lower median FRP of 4.3 MW. This difference likely reflects the finer spatial resolution of VIIRS, which enables detection of smaller, more isolated fires with lower total radiative energy output per pixel.
Fig. 6
MODIS-detected fires (red dots) and VIIRS-detected fires (yellow dots) at a civilian burn pit near US military base Camp Lemonnier, Djibouti (blue dot).
Comments (0)