
Remember me
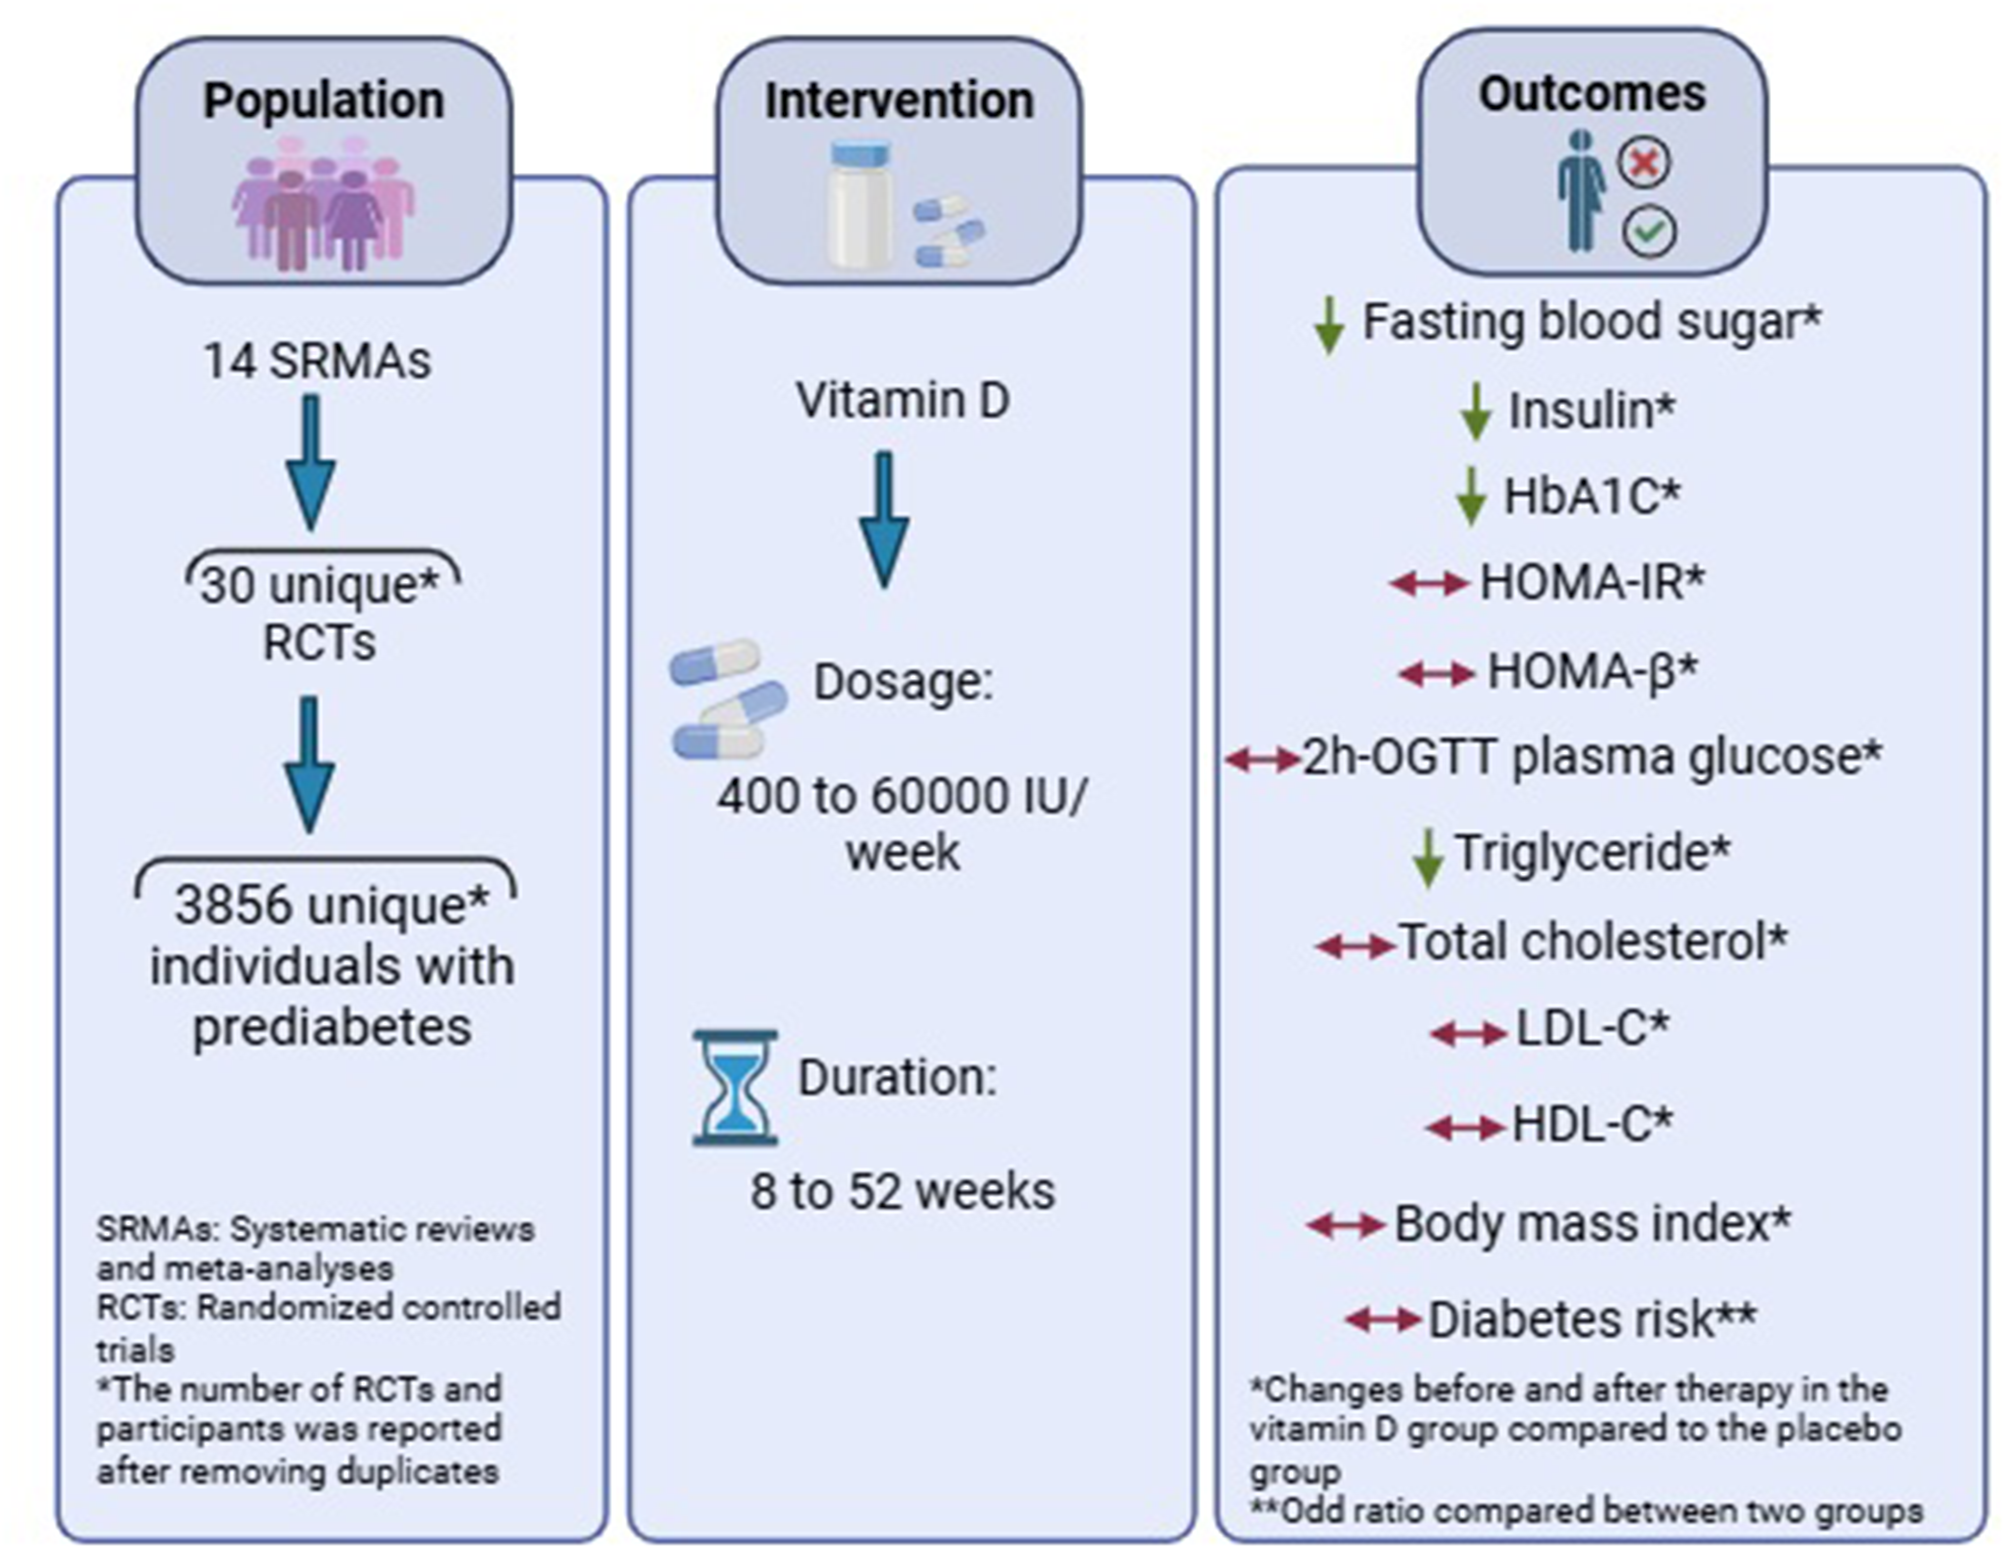
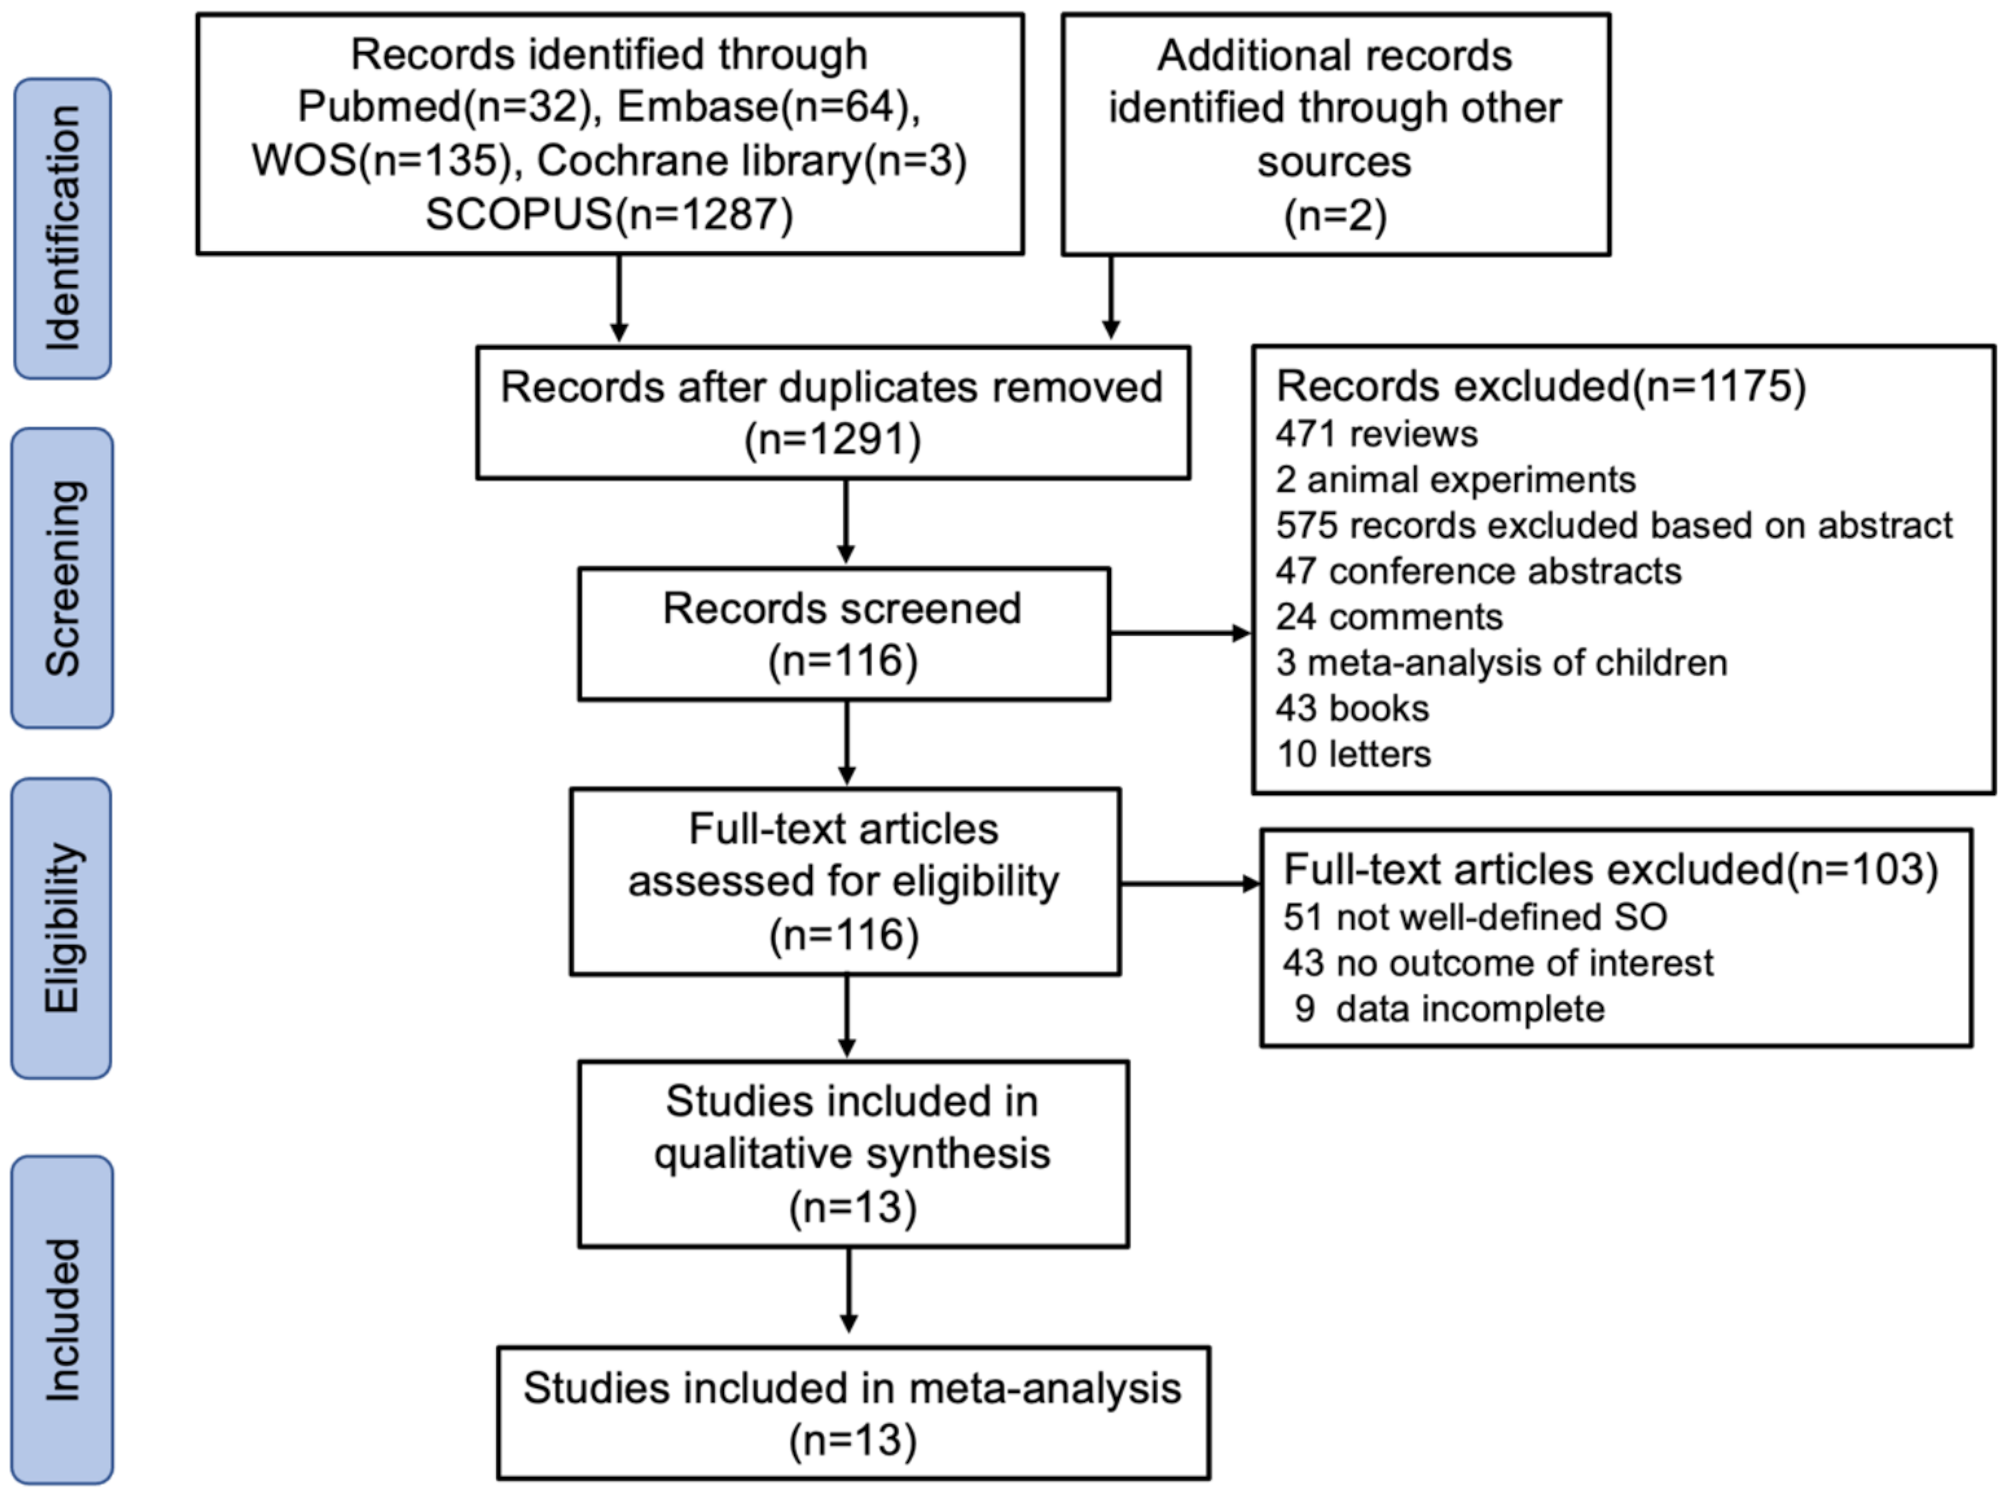


Figure 1 (PRISMA diagram) illustrates the process of study search and selection for this review. A total of 2981 potential articles were identified through searches in various databases: PubMed (n = 370), Web of Science (n = 808), Scopus (n = 1116), Science Direct (n = 259), Cochrane (n = 243), and Google Scholar (n = 185). After eliminating duplicates, 1589 studies remained for further screening. Initial screening based on titles and abstracts resulted in the exclusion of 1566 irrelevant studies. The remaining 23 articles underwent critical analysis, leading to the exclusion of 11 systematic and umbrella reviews that lacked the necessary data. Supplementary Table 3 provides details on the excluded studies and the reasons for their exclusion. The final selection comprised 12 meta-analyses of RCTs, which were included in this review [9, 11, 12, 26, 34,35,36,37,38,39,40,41].
Fig. 1
PRISMA diagram; The study selection process
Characteristics of the included studiesThe key features of the studies included in this analysis are summarized in Table 2. The meta-analyses, published between 2012 and 2023, included five to 29 randomized controlled trials (RCTs). These studies included participants of both genders. The Cochrane Collaboration’s criteria were used to assess the quality of the RCTs, which were found to be of high standard across all meta-analyses, except for one that did not provide quality assessment information (9). After eliminating duplicate studies, the meta-analyses encompassed 31 RCTs involving 3856 prediabetic patients, with the trials conducted from 2007 to 2020. The interventions varied in dosage from 400 to 60,000 and duration between 8 and 52 weeks. Most study participants were classified as overweight or obese, with a majority exhibiting vitamin D deficiency before the intervention. A summary of the included meta-analyses’ results is presented in Supplementary Table 4.
Table 2 Characteristics of the included meta-analyses that examined the effects of vitamin D supplementation on prediabetic patientsRisk of bias assessment and certainty of the evidenceThe risk of bias assessment results for the included meta-analyses are presented in Supplementary Table 5. Seven meta-analyses demonstrated a low risk of bias, and five cases had a moderate risk of bias according to the AMSTAR2 criteria. Some studies failed to provide clear information regarding PICOS criteria and their protocol. The quality of the RCTs was assessed by Cochrane Collaboration’s tool, which, except for two trials, others had acceptable quality (Supplementary Table 6). Moreover, the certainty of the evidence obtained for insulin was graded as high quality, and for the others, as moderate quality, using the GRADE scale (Table 3). Additionally, regarding insulin levels, the findings of long-term trials or those with a higher intervention dose had a high certainty, whereas the results of short-term trials or those with a lower intervention dose had a moderate certainty of evidence.
Table 3 Summary of results and quality of evidence assessment using the GRADE approachOutcomesEffects of vitamin D supplementation on glycemic indicesSeven included meta-analyses of 25 RCTs comprising 3144 patients with prediabetes and evaluated the effects of vitamin D supplementation on serum FBS levels. Combining their findings using the random-effects model demonstrated that vitamin D intervention reduced FBS levels in participants with prediabetes (WMD= -0.377 mg/dl, 95% CI (-0.589, -0.165), p = 0.001) (Fig. 2). There was a high heterogeneity among the studies (I2 = 87.5%, Pheterogeneity<0.001). Sub-group analysis showed that vitamin D supplementation was more effective in studies on patients aged ≥ 50 years (WMD= -0.419 mg/dl, 95% CI (-0.735, -0.103)), with sample size ≥ 100 (WMD= -0.388 mg/dl, 95% CI (-0.629, -0.147)), participants with vitamin D deficiency (WMD= -0.322 mg/dl, 95% CI (-0.460, -0.183)), and with intervention dose < 30,000 IU/week (WMD= -0.406 mg/dl, 95% CI (-0.665, -0.147)) (Supplementary Table 7). Based on the sensitivity analysis, removing each included study did not alter the results (Supplementary Fig. 1A). Egger’s results indicated no small study effect (p = 149); however, a partial asymmetry was observed in the funnel plot. As a result, the trim-and-fill method was used with 34 RCTs (9 imputed) in which the imputed ES increased in magnitude (WMD: -0.621 mg/dl, 95% CI (-0.872, 0.370)) (Supplementary Fig. 1B). In addition, the results of meta-regression analysis indicated that moderator variable including the sample size (p = 0.747), intervention dose (p = 0.699) and duration (p = 0.526), geographic region (p = 0.899), and baseline 25(OH)D levels (p = 0.733) of participants had no significant impact the vitamin D supplementation effects on FBS levels. The results of meta-regression are shown in Table 4.
Fig. 2
Forest plot detailing effect sizes and 95% confidence intervals for the impact of vitamin D supplementation on fasting blood sugar
Table 4 Meta-regression analysis resultsThe effects of vitamin D supplementation on HbA1c were reported by five meta-analyses that included 28 RCTs of 3697 prediabetic patients. Pooling of their findings using a random-effects model indicated a significant reduction in HbA1c after vitamin D administration (WMD = -0.479, 95% CI (-0.714, -0.245), p < 0.001) (Fig. 3). There was low heterogeneity among the studies (I2 = 94.1%, Pheterogeneity <0.001). In the subgroup analysis, administration of vitamin D was more effective in studies with patients aged ≥ 50 years (WMD= -0.608, 95% CI (-0.986, -0.230)), sample size ≥ 100 (WMD= -0.560, 95% CI (-0.877, -0.242)), participants with baseline vitamin D deficiency (WMD= -0.274, 95% CI (-0.453, -0.094)), and intervention duration ≥ 24 weeks (WMD= -0.569, 95% CI (-0.872, -0.265)) (Supplementary Table 7). The sensitivity analysis revealed that omitting each study alone did not change the overall effect (Supplementary Fig. 2A). According to the Egger test result, there was a significant publication bias (p = 0.021), and a partial publication bias was detected on the left of the funnel plot. The trim-and-fill test was applied to 37 studies (9 imputed) in which the polled ES was increased in magnitude (WMD= -0.756 (95%CI: -1.055, -0.458)) (Supplementary Fig. 2B). Meta-regression analysis also showed that the sample size (p = 0.742), intervention dose (p = 0.677) and duration (p = 0.525), geographic region (p = 0.902), and baseline 25(OH)D levels (p = 0.697) of patients did not influence significantly the vitamin D intervention effects on HbA1c (Table 4).
Fig. 3
Forest plot detailing effect sizes and 95% confidence intervals for the impact of vitamin D supplementation on Hemoglobin A1c
Six meta-analyses of 22 RCTs comprising 2794 patients with prediabetes examined the effect of vitamin D supplementation on insulin resistance by homeostasis model assessment (HOMA-IR). Pooling the results from these RCTs demonstrated no significant reduction in HOMA-IR (WMD= -0.147, 95% CI (-0.496, -0.201), p = 0.407) with high heterogeneity among them (I2 = 94.5%, Pheterogeneity<0.001) (Fig. 4). However, according to subgroup analysis, vitamin D administration significantly decreased HOMA-IR in studies of participants with sufficient and insufficient vitamin D levels (WMD = -0.739, 95% CI (-1.344, -0.135)), supplement dose < 30,000 IU/week (WMD = -0.147, 95% CI (-0.496, -0.201)), and intervention duration ≤ 24 weeks (WMD = -0.181, 95% CI (-0.340, -0.023)) (Supplementary Table 7). Based on the sensitivity analysis, after excluding the Bhatt et al. study, the pooled ES became significant (WMD = − 0.347, 95% CI: − 0.603, − 0.0921) (Supplementary Fig. 3A). The results of the Egger test showed no small study effects (p = 0.397). Owing to partial asymmetry in the funnel plot, the trim-and-fill test was performed without imputing any studies in which the obtained ES was not changed (Supplementary Fig. 3B). Moreover, meta-regression analysis demonstrated that moderator variables such as the sample size (p = 0.791), intervention dose (p = 0.078) and duration (p = 0.770), geographic region (p = 0.221), and baseline 25(OH)D levels (p = 0.113) of participants did not change significantly the vitamin D supplementation effects on HOMA-IR (Table 4).
Fig. 4
Forest plot detailing effect sizes and 95% confidence intervals for the impact of vitamin D supplementation on Homeostasis model assessment of insulin resistance (HOMA-IR)
Four eligible meta-analyses with 15 RCTs, including 2178 prediabetic participants, examined the impact of vitamin D supplementation on insulin levels. By combining the findings of RCTs using the random-effects model, it was shown that insulin levels significantly decreased following the intervention (WMD = -0.174 µU/mL, 95% CI (-0.274, 0.074), p = 0.001), with a low amount of heterogeneity among RCTs (I2 = 20.6%, Pheterogeneity= 0.224) (Fig. 5). Upon subgroup analysis, it was detected that vitamin D supplementation was more effective in studies with sample size ≥ 100 (WMD = -0.200 µU/mL, 95%CI (-0.317, -0.082)), published after 2015 (WMD = -0.217 µU/mL, 95% CI (-0.337, 0.097)), patients aged < 50 years (WMD = -0.270 µU/mL, 95%CI (-0.411, -0.128)), intervention dose ≥ 30,000 (WMD = -0.271 µU/mL, 95%CI (-0.432, -0.111)), and duration ≥ 24 weeks (WMD = -0.189 µU/mL, 95%CI (-0.307, -0.072)) (Supplementary Table 7). The sensitivity analysis showed that removing each study alone did not alter the obtained effect (Supplementary Fig. 4A). Egger’s test revealed no evidence of a small study effect (p = 0.813); moreover, visual inspection of the funnel plot did not reveal an asymmetry in the funnel plot. However, the trim-and-fill procedure was applied by imputing one trial in which the pooled ES did not change (ES: -0.162, 95% CI (-0.266, 0.057)) (Supplementary Fig. 4B). The meta-regression analysis revealed that vitamin D supplementation duration (p = 0.043) and geographic region of the studies (p = 0.036) significantly impact the vitamin D effects on insulin levels and were the possible sources of heterogeneity among the included studies. However, the sample size (p = 0.760), intervention dose (p = 0.177), and baseline 25(OH)D levels (p = 0.687) of participants did not relate significantly to the effect size of the study (Table 4).
Fig. 5
Forest plot detailing effect sizes and 95% confidence intervals for the impact of vitamin D supplementation on insulin
The impact of vitamin D administration on 2 h-PG levels was reported by three meta-analyses, including 20 RCTs of 2310 prediabetic patients. Pooling their findings discovered that 2 h-PG levels were not considerably reduced after the intervention (WMD = -0.099 mg/dl, 95% CI (-0.239, 0.041), p = 0.166) (Fig. 6). There was relatively high heterogeneity among RCTs (I2 = 57.1%, p = 0.001). However, subgroup analysis revealed that the supplementation of vitamin D significantly decreased 2 h-PG in trials with sample size ≥ 100 (WMD = -0.146 mg/dl, 95%CI (-0.291, -0.002)), published after 2015 (WMD = -0.156 mg/dl, 95%CI (-0.282, -0.030)), patients aged < 50 years (WMD = -0.306 mg/dl, 95%CI (-0.574, -0.038)), participants with baseline vitamin D deficiency (WMD = -0.305 mg/dl, 95%CI (-0.519, -0.090)), and supplement dosage ≥ 30,000 IU/week (WMD = -0.305 mg/dl, 95% CI (-0.519, -0.090)) (Supplementary Table 7). According to the sensitivity analysis, by omitting each study, the results were not changed (Supplementary Fig. 5A). There was no publication bias based on Begg’s test (p = 0.417), but a partial asymmetry was observed in the funnel plot. As a result, the trim-and-fill method was used with 21 RCTs (one imputed) that ES was not changed significantly (ES: -0.083, 95% CI (-0.227, 0.060)) (Supplementary Fig. 5B). The results of the meta-regression analysis revealed that moderator factors such as the sample size (p = 0.780), intervention dose (p = 0.115) and duration (p = 0.847), geographic region (p = 0.202), and baseline 25(OH)D levels (p = 0.033) of participants did not change significantly the effects of vitamin D supplementation on 2 h-PG concentration (Table 4).
Fig. 6
Forest plot detailing effect sizes and 95% confidence intervals for the impact of vitamin D supplementation on 2 h oral glucose tolerance test plasma glucose (2 h-PG)
Combining the findings of 10 RCTs involving 928 participants with prediabetes that were reported by three included meta-analyses indicated no significant reduction in homeostasis model assessment of β-cell function (HOMA-β) following vitamin D treatment (WMD = 0.190, 95% CI (-0.088, 0.468), p = 0.180) (Fig. 7). A high amount of heterogeneity was among the trials (I2 = 76.0%, Pheterogeneity<0.001). Based on the subgroup analyses, sample size, intervention dose, and duration, publication year, and baseline serum vitamin D levels did not affect the pooled ES (Supplementary Table 7). By removing each included study, the obtained results did not alter in the sensitivity analysis (Supplementary Fig. 6A). Egger’s test result revealed no evidence of a minor study effect (p = 0.276); however, visual inspection of the funnel plot showed an asymmetry to the right of the pooled ES. Thus, the trim-and-fill test was done with 11 RCTs (one imputed), and the pooled ES was not altered (ES = 0.267, 95%CI (-0.034, 0.569)) (Supplementary Fig. 6B). Upon the meta-regression analysis, the sample size (p = 0.357), intervention dose (p = 0.789) and duration (p = 0.892), geographic region (p = 0.944), and baseline 25(OH)D levels (p = 0.849) of participants did not affect significantly the obtained effects (Table 4).
Fig. 7
Forest plot detailing effect sizes and 95% confidence intervals for the impact of vitamin D supplementation on Homeostasis model assessment of β-cell function (HOMA-B)
Effects of vitamin D supplementation on lipid profileTwo meta-analyses, including four trials involving 620 participants, evaluated the effects of vitamin D supplementation on serum levels of total cholesterol (TC), triglycerides (TG), low-density lipoprotein cholesterol (LDL-C), and high-density lipoprotein cholesterol (HDL-C). Combining the findings of these studies with the random-effects model indicated no significant change in serum levels of TC (WMD = -0.213 mg/dl, 95% CI (-0.637, 0.210), p = 0.323; I2 = 80.2%, Pheterogeneity=0.002), LDL-C (WMD = -0.041 mg/dl, 95% CI (-0.239, 0.157), p = 0.682; I2 = 23.0%, Pheterogeneity=0.270), and HDL-C (WMD = 0.036 mg/dl, 95% CI (-0.342, 0.413), p = 0.852; I2 = 78.1%, Pheterogeneity=0.003) (Supplementary Fig. 8A, B, C) after vitamin D supplementation with a relatively high heterogeneity among the trials. While, the pooled ES of the RCTs’ findings revealed that vitamin D intervention significantly reduced serum TG levels (WMD = -0.385 mg/dl, 95% CI (-0.622, -0.147), p = 0.002) (Supplementary Fig. 8D). There was not considerable heterogeneity among these studies (I2 = 44.0%, Pheterogeneity=0.148).
Sensitivity analyses were done, and omitting each of the RCTs did not alter the obtained results of vitamin D effects on TC, LDL-C, HDL-C, and TG levels (Supplementary Fig. 9A, B, C, D). In addition, except for LDL-C levels (p = 0.042), there was no publication bias for the studies of TC (p = 1.00), TG (p = 0.497), and HDL-C (p = 0.174) levels based on the Begg test. The trim-and-fill procedure was applied, but the pooled effect was not changed (Supplementary Fig. 10A, B, C, D).
Effects of vitamin D supplementation on body mass index (BMI)Three eligible meta-analyses comprising 23 RCTs of 2873 prediabetic participants investigated the effect of vitamin D supplementation on BMI. Pooling their findings using the random-effects model demonstrated that the BMI of participants did not decrease significantly after the intervention compared to the placebo group (WMD = 0.009 kg/m2, 95% CI (-0.224, 0.241), p = 0.940) (Fig. 8) with significant heterogeneity among the studies (I2 = 88.7%, Pheterogeneity<0.001). Subgroup analysis revealed that the sample size, intervention dosage and duration, year of publication, baseline vitamin D levels, and age of participants among the included studies did not change the overall pooled ES (Supplementary Table 7). Based on sensitivity analysis, excluding each study did not significantly alter the results (Supplementary Fig. 7A). The Egger test indicated no significant publication bias (p = 0.787); however, there was an asymmetry in the funnel plot. The trim-and-fill method was conducted with 30 trials to adjust for publication bias in meta-analyses and address the asymmetry observed in funnel plots (seven imputed), and the overall effect did not alter (ES = 0.270, 95% CI (0.005, -0.535)) (Supplementary Fig. 7B). Based on the meta-regression analysis, the moderator variables such as the sample size (p = 0.940), intervention dose (p = 0.249) and duration (p = 0.224), geographic region (p = 0.740), and baseline 25(OH)D levels (p = 0.548) of participants had no significant influence on the vitamin D supplementation effects on BMI (Table 4).
Fig. 8
Forest plot detailing effect sizes and 95% confidence intervals for the impact of vitamin D supplementation on BMI
Effects of vitamin D supplementation on diabetes riskPooled ESs from nine RCTs comprising 1074 participants that were involved in five included meta-analyses indicated no significant effects of vitamin D supplementation on diabetes risk in prediabetic patients (OR = 0.958, 95%CI (0.889, 1.032)) (Fig. 9) along with a low heterogeneity between the trials (I2 = 6.2%, Pheterogeneity = 0.383). Subgroup analysis showed that the overall pooled effect was not altered with different sample sizes, baseline vitamin D levels, and intervention dosage and duration (Supplementary Table 7). Upon the sensitivity analysis, removing each trial did not change the significance of the results (Supplementary Fig. 11A). According to Begg (p = 0.677) and Egger (p = 0.071) tests’ results, there was no significant publication bias. Based on the visual inspection, there was an asymmetry in the funnel plot, so the trim-and-fill was done with three imputed studies, and the overall effect was not changed (OR = 0.966, 95% CI (0.896, 1.042)) (Supplementary Fig. 11B). Based on the meta-regression analysis, vitamin D intervention dose (p = 0.037) and duration (p = 0.030), as likely sources of heterogeneity, significantly moderated the vitamin D effects on HOMA-β. Nevertheless, the sample size (p = 0.644), geographic region (p = 0.153), and baseline 25(OH)D levels (p = 0.079) of participants did not significantly connect with the vitamin D supplementation effects on (Table 4).
Fig. 9
Forest plot detailing effect sizes and 95% confidence intervals for the impact of vitamin D supplementation on the risk of diabetes
Comments (0)