
Remember me
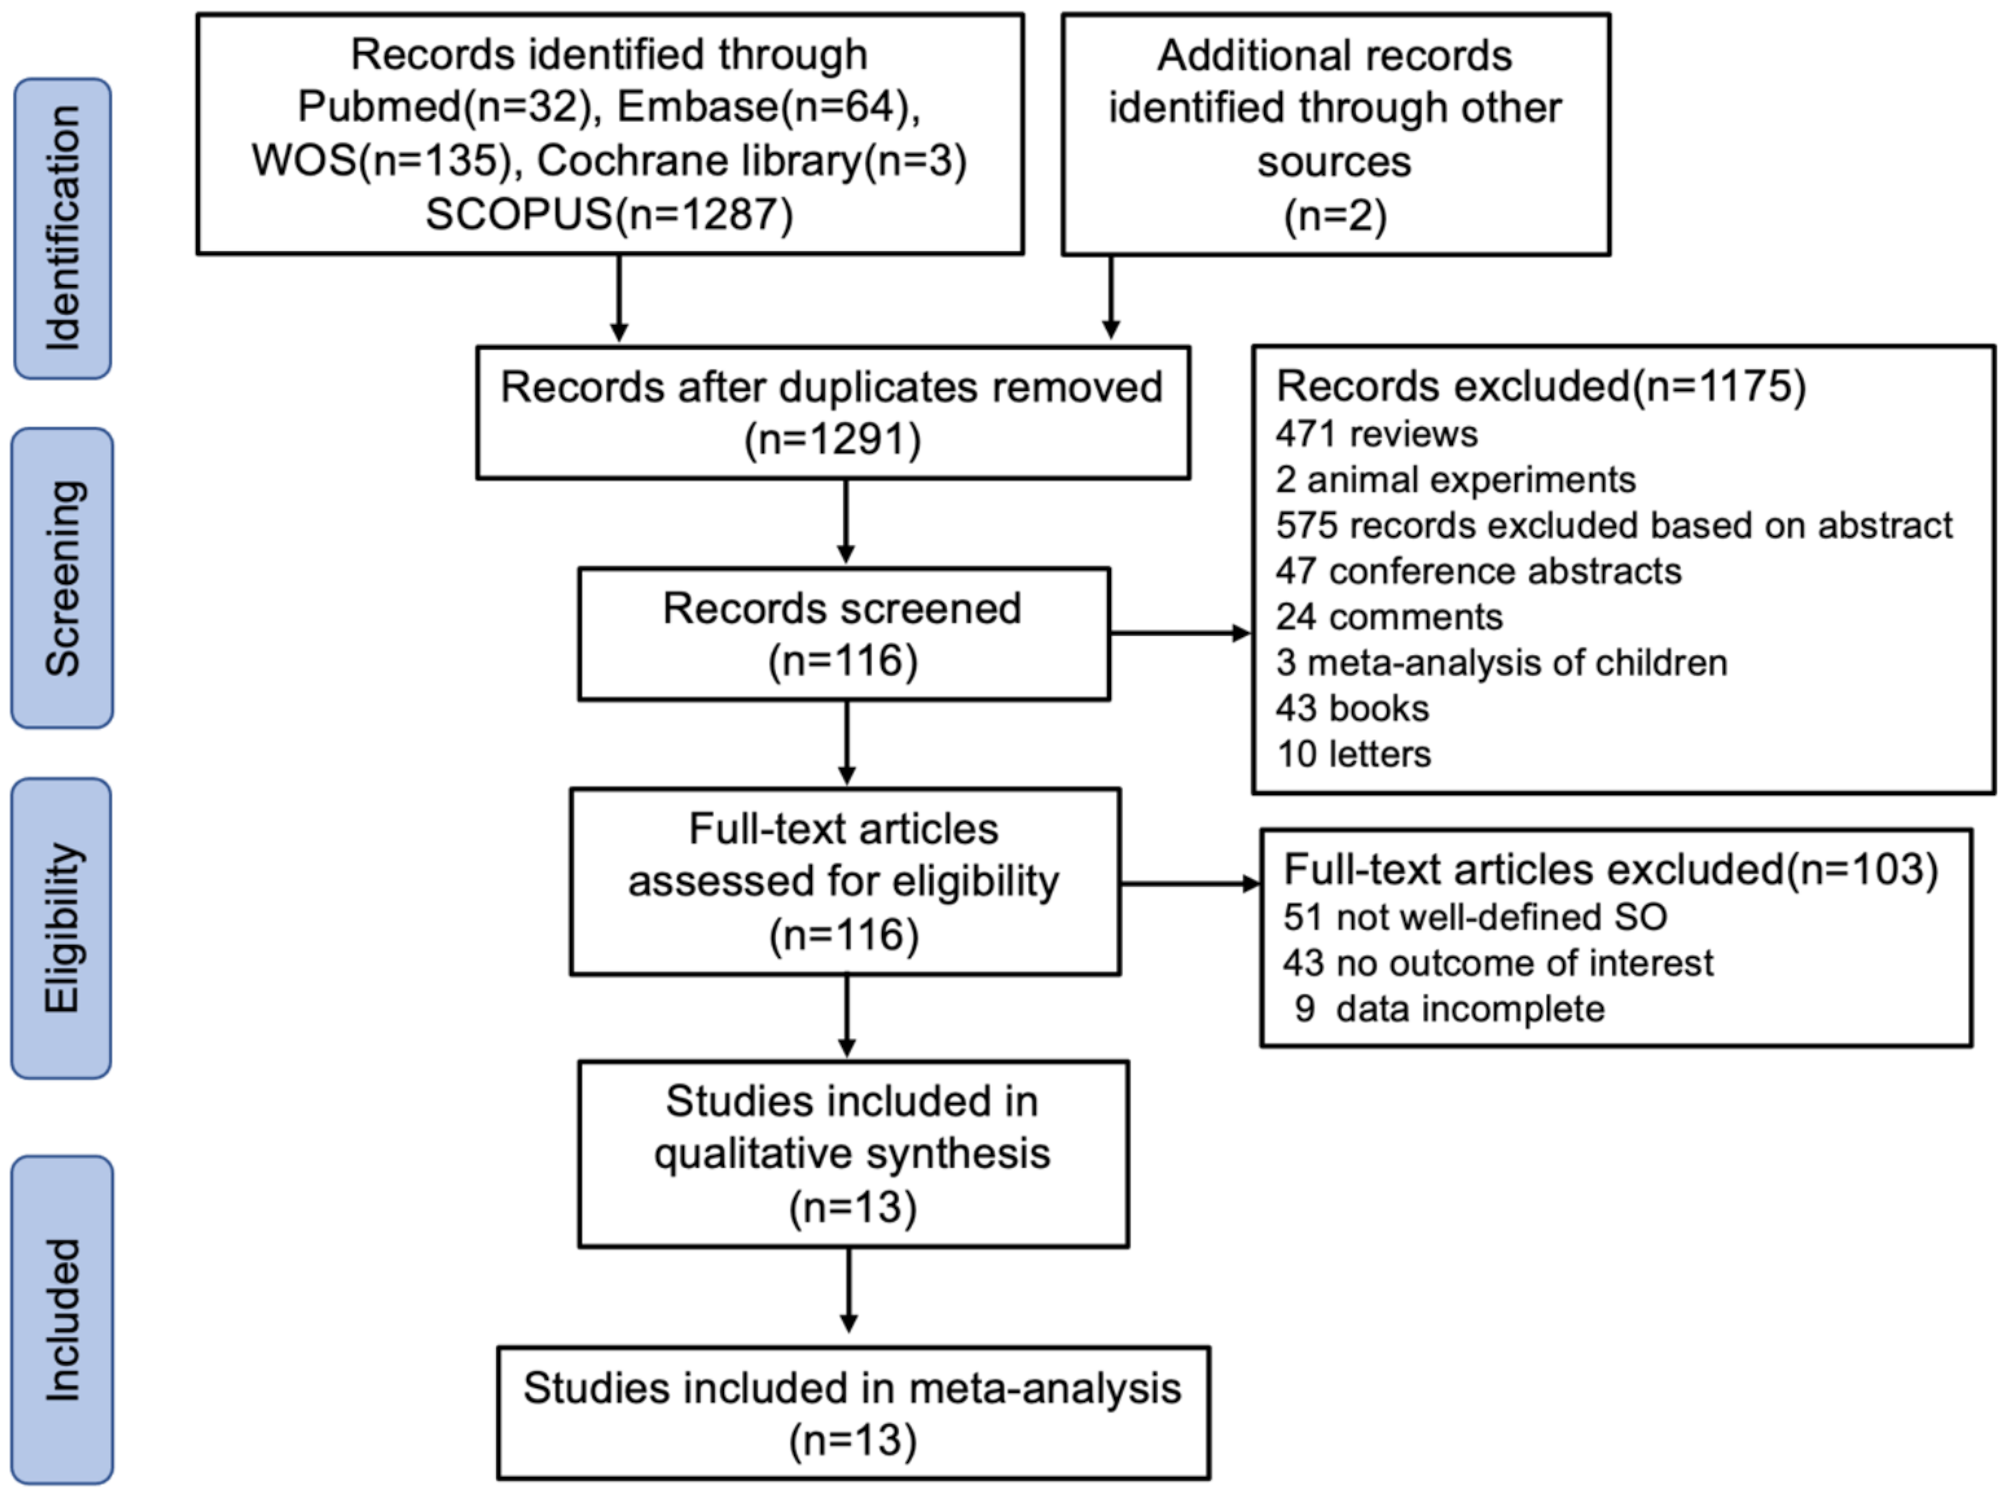


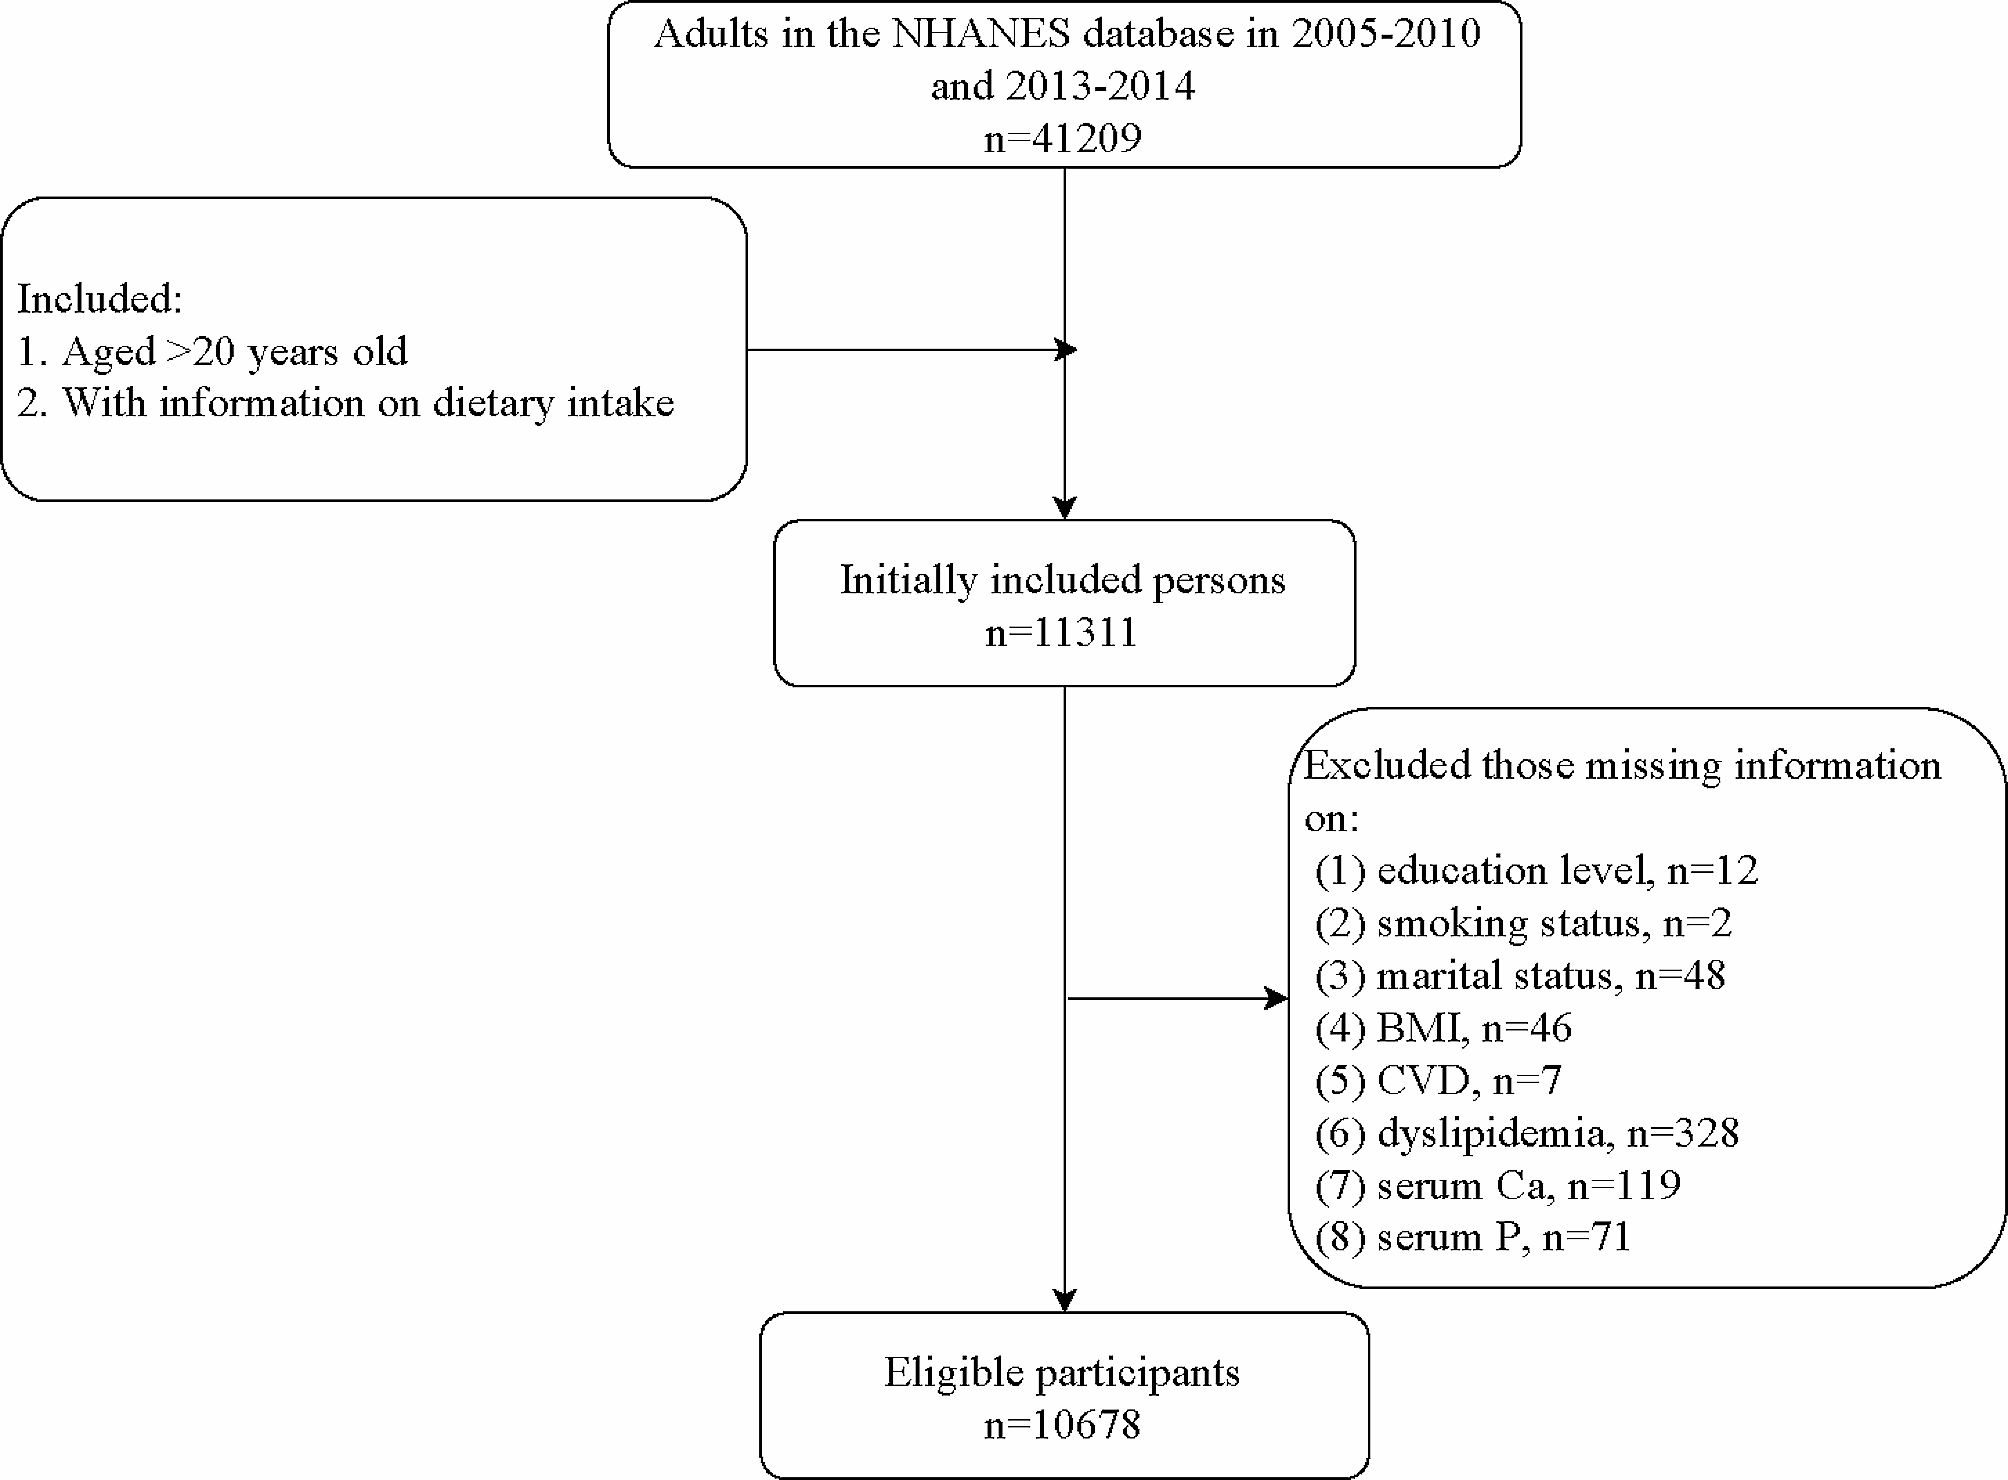
As shown in the flowchart (Fig. 1), 1493 studies were initially identified through screening. After removing duplicates, 1291 articles were retained. Further, we excluded 1175 studies based on titles and abstracts. 116 studies with potentially relevant content were left. Among these, 51 studies were excluded due to unclear diagnoses, 43 for lacking valid outcomes and 9 for incomplete data. Ultimately, 13 studies [13,14,15,16,17,18,19,20,21,22,23,24,25] involving 35,373 patients with SO from diverse countries were included. Among studies reporting gender data, 28% of participants were male and 72% female. Detailed characteristics of the included studies are presented in Table 1. The meta-analysis included five case-control, three cohort and five cross-sectional studies. Data sources primarily included medical institutions and public databases. Geographically, four studies were from China, four from South Korea, two from the United States, and one each from Japan, Greece, and Turkey. All studies were rated as moderate quality, with scores ranging from 5 to 6.
Fig. 1
Flow chart of literature search and inclusion in this meta-analysis
Table 1 Characteristics of studies included in this meta-analysisNext, we conducted a risk of bias (ROB) assessment. According to the 13 studies included in this meta-analysis, all exhibited a high risk of bias concerning both random and blinding (random sequence generation, blinding of participants and individuals). Uncertainty regarding other bias was present in all studies. However, outcome data were complete without selective reporting for all studies except Lee’s. As per the methodological quality assessment presented in Figure S1A-B, the included literature was predominantly of moderate to high quality.
Prevalence of MASLD in patients with SONine studies provided data on MASLD prevalence [13,14,15,– [16, 18, 21, 22, 24, 25]. The pooled results showed that the prevalence of MASLD was 61.0% in 4629 patients with SO (Fig. 2). Notably, higher MASLD rates (63.0%) were observed in Asian SO populations (Fig. 3A), while other ethnic groups (including two from the United States and one from Greece) exhibited a lower prevalence of 58.0%. We then observed the prevalence of MASLD in different groups. The results showed that South Korea had the highest MASLD prevalence (73.0%) in SO patients, followed by China (59.0%) and Greece (60.5%), with the lowest rate in America (57.0%) (Fig. 3B).
Fig. 2
Forest plot of prevalence of MASLD among SO patients. A random effect model was used to evaluate the prevalence of MASLD
Fig. 3
Prevalence of MASLD among SO patients in different regions (A and B)
Effect of SO on the occurrence of MASLDTwelve studies evaluated the association between SO and MASLD using logistic regression (OR and 95% CI) [13,14,15, 17,18,19,20,21,22,23,24,25]. Three of these studies analyzed male and female populations separately. Due to significant heterogeneity (I² = 97.8%, P < 0.001), a random-effects model was applied to pooled log-transformed data. Meta-analysis demonstrated that SO patients had a 4.45-fold higher risk of MASLD compared to non-SO individuals (OR = 4.45, 95% CI: 2.57–7.72, P < 0.001) (Fig. 4). Next, we investigated the effect of SO on the risk of MASLD in different gender populations. Three studies analyzed male populations and four studies analyzed female populations. Gender-specific analysis revealed elevated MASLD risks in both males (OR = 4.22, 95% CI: 2.10–8.50, P < 0.001) (Fig. 5A) and females (OR = 7.56, 95% CI: 2.39–23.92, P < 0.001) (Fig. 5B), with random-effects models applied due to high heterogeneity.
Fig. 4
Forest plot of the relationship between SO and MASLD. A random effect model was used to evaluate the impact of SO on MASLD. The pooled result indicated that SO was associated with the occurrence of MASLD
Fig. 5
Forest plot of the relationship between SO and MASLD based on different genders. A was in male and B was in female. A random effect model was used to evaluate the impact of SO on MASLD
Subgroup analysisSubgroup analyses were conducted to explore heterogeneity sources (Table S1 and Table 2). In terms of prevalence, we found high heterogeneity in Asia (I² = 95.79%, P < 0.001) and other groups (I² = 95.23%, P < 0.001). When we grouped by different countries, there was no heterogeneity among the Chinese population (I² = 0.00%, P = 0.47), while there was still considerable heterogeneity among the Korean (I² = 96.78%, P < 0.001) and American (I² = 94.80%, P < 0.001) populations. For MASLD diagnostic methods, no heterogeneity was observed in studies using controlled attenuation parameter (CAP) (I² = 0.0%, P = 0.696), whereas high heterogeneity persisted in abdominal ultrasound (I² = 91.2%, P < 0.001) and other diagnostic groups (I² = 98.0%, P < 0.001). Despite heterogeneity, SO remained significantly associated with MASLD in all subgroups. When stratified by SO diagnostic criteria, studies using skeletal muscle mass to visceral fat ratio (SVR) showed low heterogeneity (I² = 25.2%, P = 0.237), while others exhibited high heterogeneity (I² = 98.6%, P < 0.001). Both subgroups confirmed SO as a MASLD risk factor (OR = 3.21, 95% CI: 2.57–4.00; OR = 5.49, 95% CI: 2.29–13.15; P < 0.001). Geographic analysis revealed no heterogeneity in North American studies (I² = 0.0%, P = 0.502), but significant heterogeneity persisted in Asian and European studies (P < 0.001). Notably, SO was not significantly linked to MASLD in European populations (P = 0.097). Regardless of diabetes status, SO remained a significant MASLD risk factor (P < 0.001).
Table 2 Subgroup analysisAssociation between SO and MASLD-associated fibrosisFour studies assessed the relationship between SO and liver fibrosis. Pooled results (Fig. 6) indicated a 2.34-fold increased risk of fibrosis in SO patients (OR = 2.34, 95% CI: 1.78–3.08, P < 0.001). Subgroup analyses were not performed because of the minimal heterogeneity of the included studies (I2 = 1.1%, P = 0.400).
Fig. 6
Forest plot of the relationship between SO and fibrosis. A random effect model was used to evaluate the impact of SO on fibrosis
Sensitivity analysis and publication biasSensitivity analyses were performed to assess whether the results were affected by a single study (Figure S2A-C). Based on the leave-one-out method, we observed the effects of individual studies on prevalence, correlation and fibrosis outcomes, respectively. The results showed that no matter which study is excluded, the remaining combined results will not be changed. Funnel plots and Egger’s test indicated no publication bias among the 12 studies evaluating MASLD risk (Fig. 7A). Then, we used the trim and fill method to analyze fibrosis outcome. The results confirmed that there was no bias and the results were robust (p > 0.05) (Figure S3).
Fig. 7
Funnel plot for assessing publication bias in rate MASLD (A)
Comments (0)