
Remember me


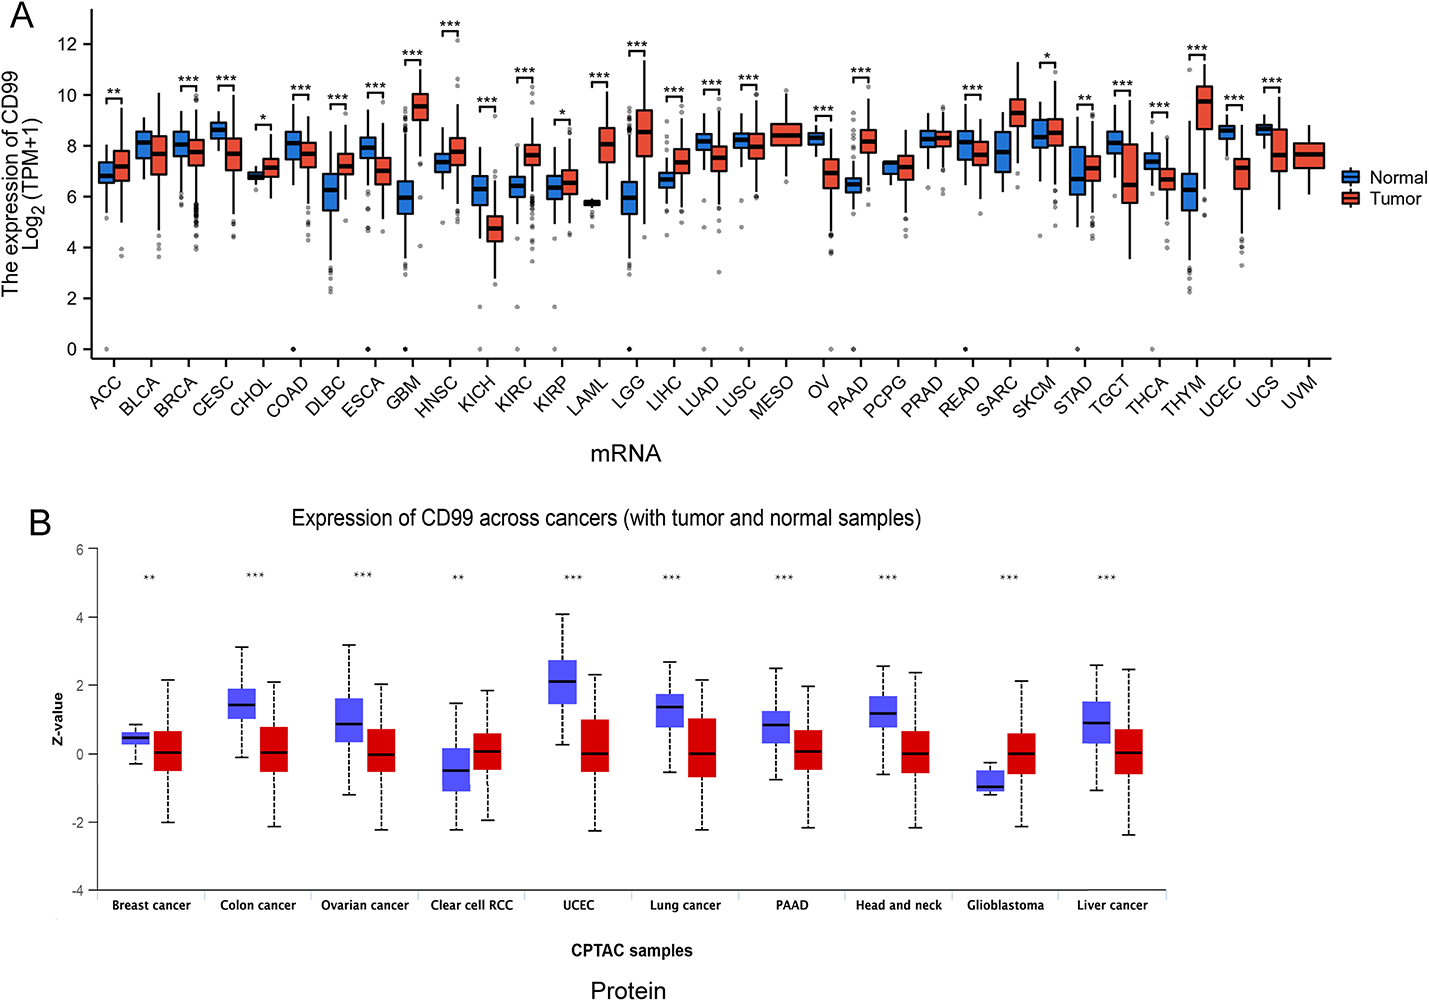
Figure 1A: The heatmap illustrates gene expression profiles across two distinct sample categories: normal and tumor tissues. Sample clustering is performed based on transcriptomic expression similarities. A color spectrum from red to yellow represents differential gene expression intensities, where red indicates elevated expression levels and yellow denotes reduced expression. The visualization separates samples into two distinct clusters, positioning normal specimens on one side and malignant specimens on the opposite side. Figure 1B: The volcano plot demonstrates differential gene expression analysis comparing normal versus tumor specimens. The horizontal axis depicts log fold change (logFC) values representing expression alterations, while the vertical axis shows the negative logarithm base 10 of the false discovery rate (FDR), reflecting statistical significance levels. Significantly upregulated genes in tumor samples are marked in red, significantly downregulated genes are indicated in yellow, and statistically non-significant genes appear in black. This visualization facilitates identification of the most substantially altered genes between sample categories.
Fig. 1
The differences in gene expression between normal and tumor tissues. A Heatmap displays the differential gene expression between normal and tumor samples. B Volcano plot visualizes the statistical significance and magnitude of differential gene expression between normal and tumor samples. B Volcano Plot
The volcano plot highlights genes that are significantly differentially expressed between tumor and normal samples
3.2 Different types of data related to gene expression and prognostic analysisFigure 2A displays a forest plot illustrating hazard ratios for multiple genes. Each gene entry includes associated p-values, hazard ratios, and confidence intervals. Genes demonstrating significant associations are emphasized, revealing their potential influence on patient survival outcomes. Figure 2B presents a coefficient heatmap for various prognostic model features. Features are color-coded according to their coefficient values, with distinct colors representing the magnitude and directional influence. This visualization identifies features with the greatest model contribution. Figure 2C depicts hazard ratios for clinical parameters including age, grade, and stage. Each parameter displays corresponding p-values and hazard ratios, demonstrating their prognostic significance. Figure 2D incorporates identical clinical variables while additionally including a risk score component. The risk score’s hazard ratio demonstrates its predictive capacity relative to other clinical parameters.
Fig. 2
Different types of data related to gene expression and prognostic analysis. A Forest plot of hazard ratios for genes shows the hazard ratios (HR) and confidence intervals (CI) for various genes, indicating their impact on survival. B Model performance table compares the performance of different predictive models. C Forest plot for clinical factors shows the impact of clinical factors (age, grade, stage, risk score) on survival in the training cohort. D Forest plot for clinical factors shows the impact of clinical factors (age, grade, stage, risk score) on survival in the test cohort
3.3 Survival analysis and prognostic model assessmentKaplan-Meier survival curves demonstrate overall survival comparisons between high-risk and low-risk cohorts. Both panels reveal significant survival differences (p < 0.001), with high-risk cohorts exhibiting inferior outcomes (Fig. 3A and B). Time-dependent ROC analysis illustrates the model’s predictive accuracy across 1, 3, and 5-year intervals. AUC values demonstrate robust predictive performance at 0.737, 0.754, and 0.757, respectively (Fig. 3C). ROC curve comparison evaluates risk score predictive power against clinical factors including age, gender, and stage. The risk score achieves the highest AUC (0.737), indicating superior predictive capacity (Fig. 3D). Calibration plots demonstrate concordance between observed and predicted overall survival at 1, 3, and 5-year timepoints. The C-index of 0.705 indicates satisfactory model calibration (Fig. 3E). Time-dependent concordance index analysis for risk score and clinical variables across 10 years demonstrates consistent predictive performance over time (Fig. 3F). The nomogram integrates clinical parameters including grade, age, stage, and risk score for overall survival probability prediction. This visualization provides a practical tool for patient-specific survival estimation based on cumulative factor points (Fig. 3G).
Fig. 3
Survival analysis and model evaluation for a prognostic study. A and B Kaplan-Meier survival curves compare overall survival between high-risk and low-risk groups. C and D ROC curves evaluate the performance of the risk model in predicting survival at different time points. C ROC curves for the risk model at 1, 3, and 5 years. D Comparison of ROC curves for risk score, age, gender, and stage. E Calibration plot assess the agreement between predicted and observed survival probabilities. F Time-Dependent C-index shows the model’s predictive accuracy over time. G Nomogram provides a visual tool to predict individual patient survival probabilities based on multiple factors
3.4 Immune cell infiltration and risk group associationsBubble plot visualization shows correlations between immune cell populations and risk scores. Individual bubbles represent specific immune cells, with bubble size indicating correlation strength and color denoting significance levels (Fig. 4A). Bar chart presentation displays estimated immune cell proportions across low-risk and high-risk cohorts. Immune infiltration differences between groups are highlighted, with significant variations marked by asterisks (Fig. 4B). Box plot comparisons illustrate immune-related gene expression levels between risk cohorts. Asterisks indicate significant differences, suggesting distinct immune profiles for each risk category (Fig. 4C). Violin plot distributions show tumor microenvironment scores, including stromal, immune, and ESTIMATE scores, across risk groups. Significant TME compositional differences between groups are demonstrated (Fig. 4D).
Fig. 4
Immune cell infiltration and its correlation with risk groups. A Bubble plot of immune cell infiltration shows the correlation between immune cell infiltration and risk scores using different software tools. B Box plot of immune cell scores compares the scores of various immune cells between low-risk and high-risk groups. C Box plot of gene expression compares the expression levels of specific genes between low-risk and high-risk groups. D Violin plot of tumor microenvironment scores compares tumor microenvironment (TME) scores between low-risk and high-risk groups
3.5 Biological pathways and processes in risk groupsFigure 5A presents dual GSEA plots for genes enriched in high-risk and low-risk cohorts. High-risk group enrichment displays enrichment scores for significantly upregulated gene sets. Enrichment scores (y-axis) indicate gene set overrepresentation in ranked gene lists. Gene rank order appears on the x-axis. Colored lines represent different gene sets, with peaks showing maximum enrichment points. Low-risk group enrichment shows similar information for enriched gene sets. Layout and interpretation mirror the high-risk plot, emphasizing distinct biological processes active in low-risk cohorts. Figure 5B summarizes pathway analysis results, displaying significantly enriched biological processes (BP), cellular components (CC), molecular functions (MF), and KEGG pathways. RNA splicing via transesterification reactions with bulged adenosine, pigment granule and melanosome encompassing focal adhesion, ubiquitin-like protein ligase binding including cadherin binding and double-stranded RNA binding, Parkinson’s disease, prion disease, and proteasome pathways (Fig. 5B).
Fig. 5
Biological processes and pathways associated with different risk groups. A Gene Set Enrichment Analysis (GSEA) plots identify pathways and biological processes that are significantly enriched in high-risk and low-risk groups. B Bar plots of functional enrichment analysis summarize the results of functional enrichment analysis, highlighting key biological processes, cellular components, molecular functions, and pathways
3.6 Gene expression comparative analysis and network interactionsPaired box plots compare gene expression levels between normal (yellow) and tumor (red) tissues. Connected dots represent individual sample comparisons. Asterisks mark significant expression differences, with “***” indicating high statistical significance. Genes including PTK6, GAL, and FAM107A demonstrate notable normal-tumor expression differences (Fig. 6A). Correlation heatmap illustrates relationships between analyzed gene expression levels. Color gradients represent correlation strength, with red indicating strong positive correlations and green showing negative correlations. Correlation significance is marked by asterisks (Fig. 6B). Network diagram visualizes gene interactions based on correlation coefficients. Nodes represent individual genes, while edges indicate significant correlations. Edge color and thickness reflect correlation strength, with darker, thicker lines representing stronger correlations (Fig. 6C).
Fig. 6
Analyze gene expression differences between normal and tumor tissues, along with correlation and network analyses. A Differential gene expression analysis compare the expression levels of specific genes between normal and tumor samples. B Correlation heatmap show the correlation between the expression levels of the selected genes. C Gene co-expression network visualize the co-expression relationships among the selected genes
3.7 PTK6/GAL gene expression in cell linesQuantitative RT-qPCR analysis examined PTK6/GAL gene expression in H8 and HeLa cell lines. Compared to H8 cells, PTK6/GAL expression levels were significantly elevated in HeLa cells, suggesting involvement in cervical cancer development regulation (Figs. 7A, D). siRNA design targeted each gene for mRNA knockdown in HeLa cells (Figs. 7B, E). Proliferation assays demonstrated that PTK6/GAL mRNA knockdown effectively reduced HeLa cell proliferation compared to controls (Figs. 7C, F).
Fig. 7
The expression of PTK6/GAL gene in the H8 and HeLa cell lines. A, D, Relative human PTK6/GAL mRNA expression measured by RT-qPCR in the H8 and HeLa cell lines (n = 3 biological replicates). B, E, Relative human PTK6/GAL mRNA expression measured by RT-qPCR in the HeLa cell line after specified treatments (n = 3 biological replicates). C, F, Quantification of cell proliferative capacity in the HeLa cell line after specified treatments (n = 3 biological replicates)
3.8 Drug sensitivity and mRNA expression correlationsFigure 8A presents bubble plots showing correlations between gene mRNA expression and drug sensitivity from CTRP database. The x-axis displays various drugs, while the y-axis lists genes including S100A9, PTK6, and CDH3. Bubble colors represent correlation coefficients, with red indicating positive correlations and blue showing negative correlations. Bubble size reflects -log10 FDR values, indicating correlation significance. Larger bubbles represent more significant correlations. Black-outlined bubbles denote FDR ≤ 0.05 correlations, highlighting significant interactions. Figure 8B displays similar bubble plots from GDSC database. Layout and interpretation parallel Panel A, with drugs on x-axis and genes on y-axis. Correlation and significance follow identical color-coding and sizing, providing insights into gene expression-based drug sensitivity prediction.
Fig. 8
Explore the correlation between drug sensitivity and mRNA expression. A and B panels provide a comprehensive analysis of the relationship between gene expression and drug sensitivity in cancer cells. By comparing data from two different drug sensitivity datasets (CTRP and GDSC)
3.9 Genomic and epigenomic factors in cancer prognosisFigure 9A illustrates correlations between copy number variations and mRNA expression across genes. Figure 9B demonstrates survival differences between differentially methylated region groups. Figure 9C provides mutation classification and frequency overview across cancer types. The chart displays mutation distributions, highlighting common mutations per cancer type. Figure 9D presents bubble plots illustrating survival differences between mutant and wild-type groups across cancer types and genes. Figure 9E shows bubble plots displaying methylation differences for specific genes across cancers. Figure 9F examines survival differences between high and low methylation groups within cancer types.
Fig. 9
Various genomic and epigenomic factors in relation to cancer prognosis and gene expression. A shows how CNVs correlate with gene expression. B highlights the impact of CNVs on survival outcomes. C provides a mutation overview. D compares survival between mutant and WT groups. E analyzes methylation differences. F evaluates the impact of methylation on survival
3.10 Gene expression and immune cell infiltration correlationsFigure 10A displays correlations between gene expression and immune cell infiltration levels. The x-axis lists immune cell types including B cells, T cells, macrophages, and NK cells. The y-axis presents genes such as TPCN1, VTCN1, and S100A9. Color gradients represent correlation coefficients, with red indicating positive correlations and yellow showing negative correlations. Figure 10B presents correlations between gene expression and StromalScore, ImmuneScore, and ESTIMATEScore. Figure 10C provides similar heatmap analysis focusing on different immune cell types and additional genes. The x-axis includes various immune cell types and T cell subsets, dendritic cells, and neutrophils. The y-axis lists genes including TPCN1, VTCN1, and S100A9. Color gradients represent correlation coefficients with identical color schemes.
Fig. 10
The correlation between gene expression and immune cell infiltration. A Highlights correlations with various immune cells, suggesting potential roles in immune modulation. B Shows how gene expression correlates with stromal and immune components, indicating their influence on the tumor microenvironment. C Offers a detailed view of correlations with specific immune cell subtypes, providing deeper insights into immune interactions
3.11 Single-cell RNA sequencing cell clustering and compositionFigure 11A shows cell clustering based on gene expression profiles. Individual points represent single cells, with colors indicating distinct clusters. Numerical cluster labels identify distinct cell populations within the dataset. Figure 11B presents UMAP plots with cell type annotations. Colors represent different cell types including CD8T cells, CD4Tconv cells, fibroblasts, and others. This visualization provides tumor microenvironment cellular composition insights. Figure 11C displays bar plots showing major cell lineage proportions across patients. The x-axis lists patient samples, while the y-axis indicates cell type proportions. Colors correspond to major lineages including CD8T cells, CD4Tconv cells, fibroblasts, and Tregs. Figure 11D presents pie charts illustrating overall cell type distribution. Each slice represents individual cell types, with size indicating proportional representation. Major cell types include CD4Tconv, CD8T, Tregs, and fibroblasts.
Fig. 11
Cell clustering and composition by single-cell RNA sequencing. A Shows the clustering of cells based on gene expression, indicating diversity in cell populations. B Annotates clusters with specific cell types, providing insights into the functional roles of these cells. C Highlights the variability in cell type proportions across different patients, indicating patient-specific immune landscapes. D Summarizes the overall distribution of cell types, showing the predominance of certain immune cells
3.12 Single-cell gene expression analysisThese visualizations illustrate spatial gene expression distribution, providing insights into functional roles and potential cellular subpopulations. This information proves crucial for understanding gene-specific contributions to cellular behavior and disease processes. Analysis includes genes CDH3, COL9A2, DCXR, GAL, FAM107A, DOK5, LRRC26, OCIAD2, S100A9, SOX17, TFCP2L1, and VTCN1. Each UMAP plot represents individual cells as dots, with gene expression levels indicated by color intensity (Fig. 12).
Fig. 12
The expression of specific genes across cells in a single-cell RNA sequencing dataset. These UMAP plots provide a visual representation of the expression patterns of various genes across a dataset of cells. By examining these plots, one can identify which genes are highly expressed in specific cell clusters, which can provide insights into the roles of these genes in different cell types
Comments (0)