2.1 Study design and rationale
This study employed a bidirectional two-sample Mendelian randomization approach to investigate causal relationships between hepatocellular carcinoma (HCC) and non-alcoholic fatty liver disease (NAFLD). The bidirectional design allowed examination of causality in both directions: whether genetic predisposition to HCC causally influences NAFLD risk, and whether genetic predisposition to NAFLD causally influences HCC risk. This approach leverages genetic variants as instrumental variables to overcome confounding and reverse causation inherent in observational studies, providing more robust evidence for causal inference than traditional epidemiological methods.
2.2 Data sources and study populations
HCC genetic data were obtained from the largest available genome-wide association study meta-analysis, comprising 775 HCC cases and 1,332 controls of European ancestry, with 7,800,543 single nucleotide polymorphisms and comprehensive quality control. NAFLD genetic data were derived from the UK Biobank and additional European cohorts, including approximately 8,434 NAFLD cases and 770,180 controls. NAFLD was defined using validated imaging-based criteria, specifically hepatic steatosis detected by ultrasound, CT, or MRI, combined with alcohol consumption exclusion criteria of ≤ 20 g/day for women and ≤ 30 g/day for men. All datasets underwent rigorous population stratification correction and quality control procedures to ensure analytical validity.
2.3 Instrumental variable selection and quality control
Genetic instrumental variables were selected according to established criteria, including genome-wide significance threshold of P < 5 × 10⁻⁸, linkage disequilibrium clumping with r² < 0.001 within 10,000 kb window, minor allele frequency ≥ 0.01, and availability in both exposure and outcome datasets. Quality control procedures included removal of palindromic SNPs with intermediate allele frequencies, exclusion of SNPs with heterogeneous effects across populations, and F-statistics calculation to assess instrument strength using a threshold of F > 10. These stringent criteria ensured that selected genetic variants served as valid and strong instrumental variables for the MR analysis.
2.4 Statistical analysis methods
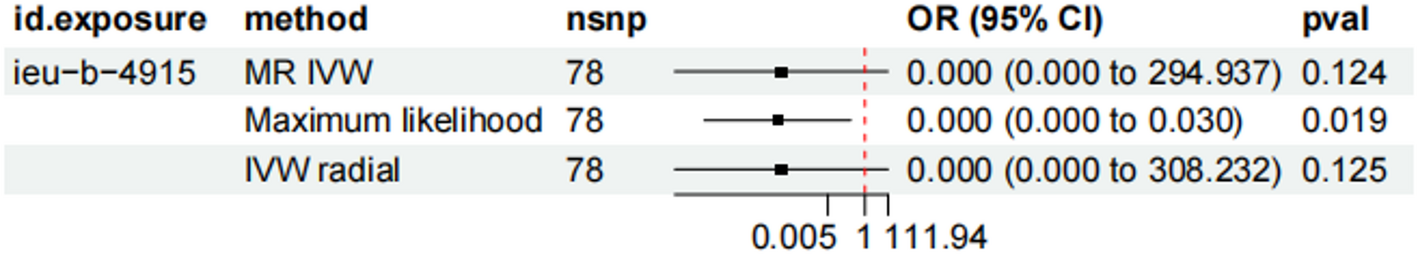
Statistical analysis was conducted using multiple complementary methods to ensure robust causal inference. The primary analysis employed the inverse variance weighted method, which provides the most precise estimates when all genetic variants are valid instruments by performing a meta-analysis of ratio estimates from each SNP, weighted by the inverse variance of outcome associations. Complementary methods included MR-Egger regression for directional pleiotropy testing and bias correction, weighted median analysis providing consistent estimates when ≥ 50% of instruments are valid, MR-PRESSO for horizontal pleiotropy detection and correction, and simple mode and weighted mode methods as alternative robust approaches. This multi-method strategy allowed comprehensive assessment of causal relationships while testing key MR assumptions.
2.5 Sensitivity analysis and assumption testing
Extensive sensitivity analyses were performed to validate results and test methodological assumptions. Heterogeneity assessment used Cochran’s Q statistic and I² statistics to identify potential violations of the exclusion restriction assumption. Pleiotropy testing included MR-Egger intercept tests for directional pleiotropy, MR-PRESSO global tests for horizontal pleiotropy, and funnel plot visualization for asymmetry detection. Leave-one-out analysis systematically excluded each SNP to identify influential outliers affecting overall causal estimates, while power calculations determined minimum detectable effect sizes given available sample sizes and instrument strengths.
2.6 Search strategy
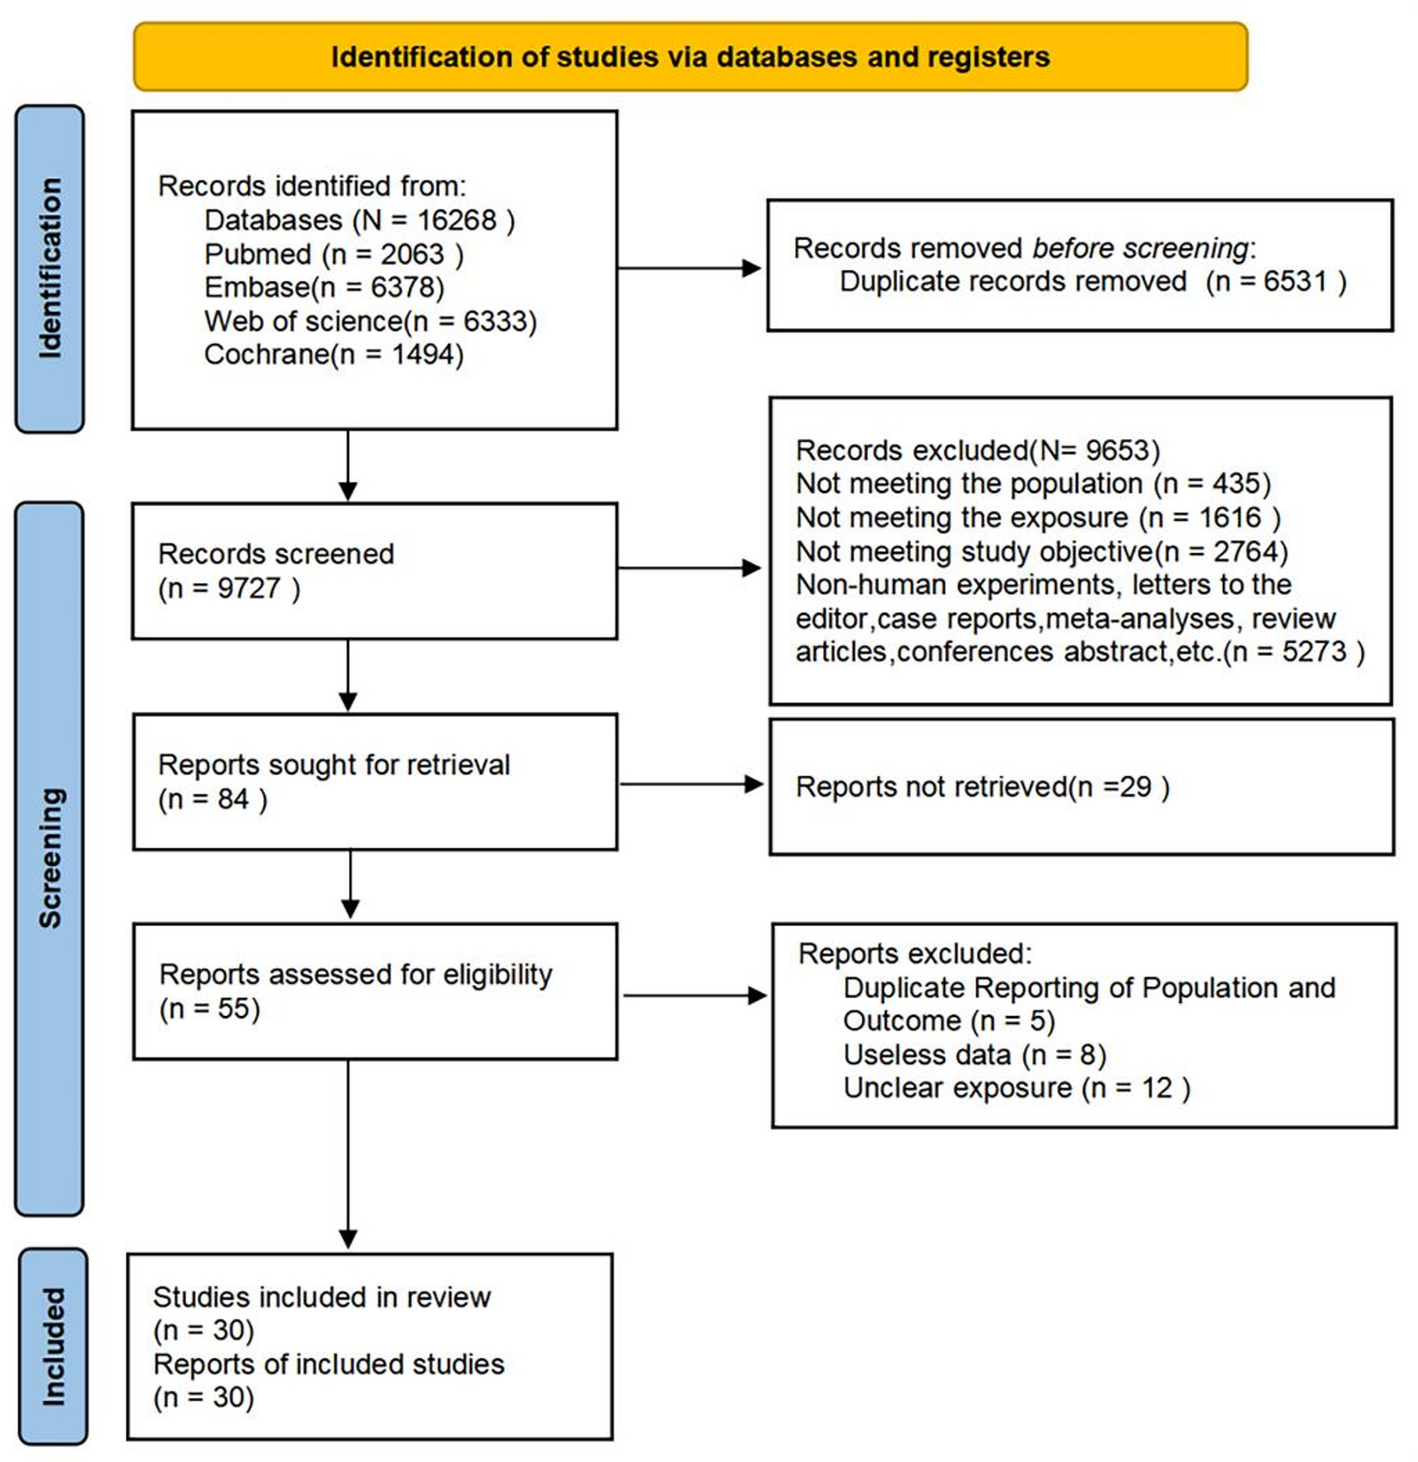
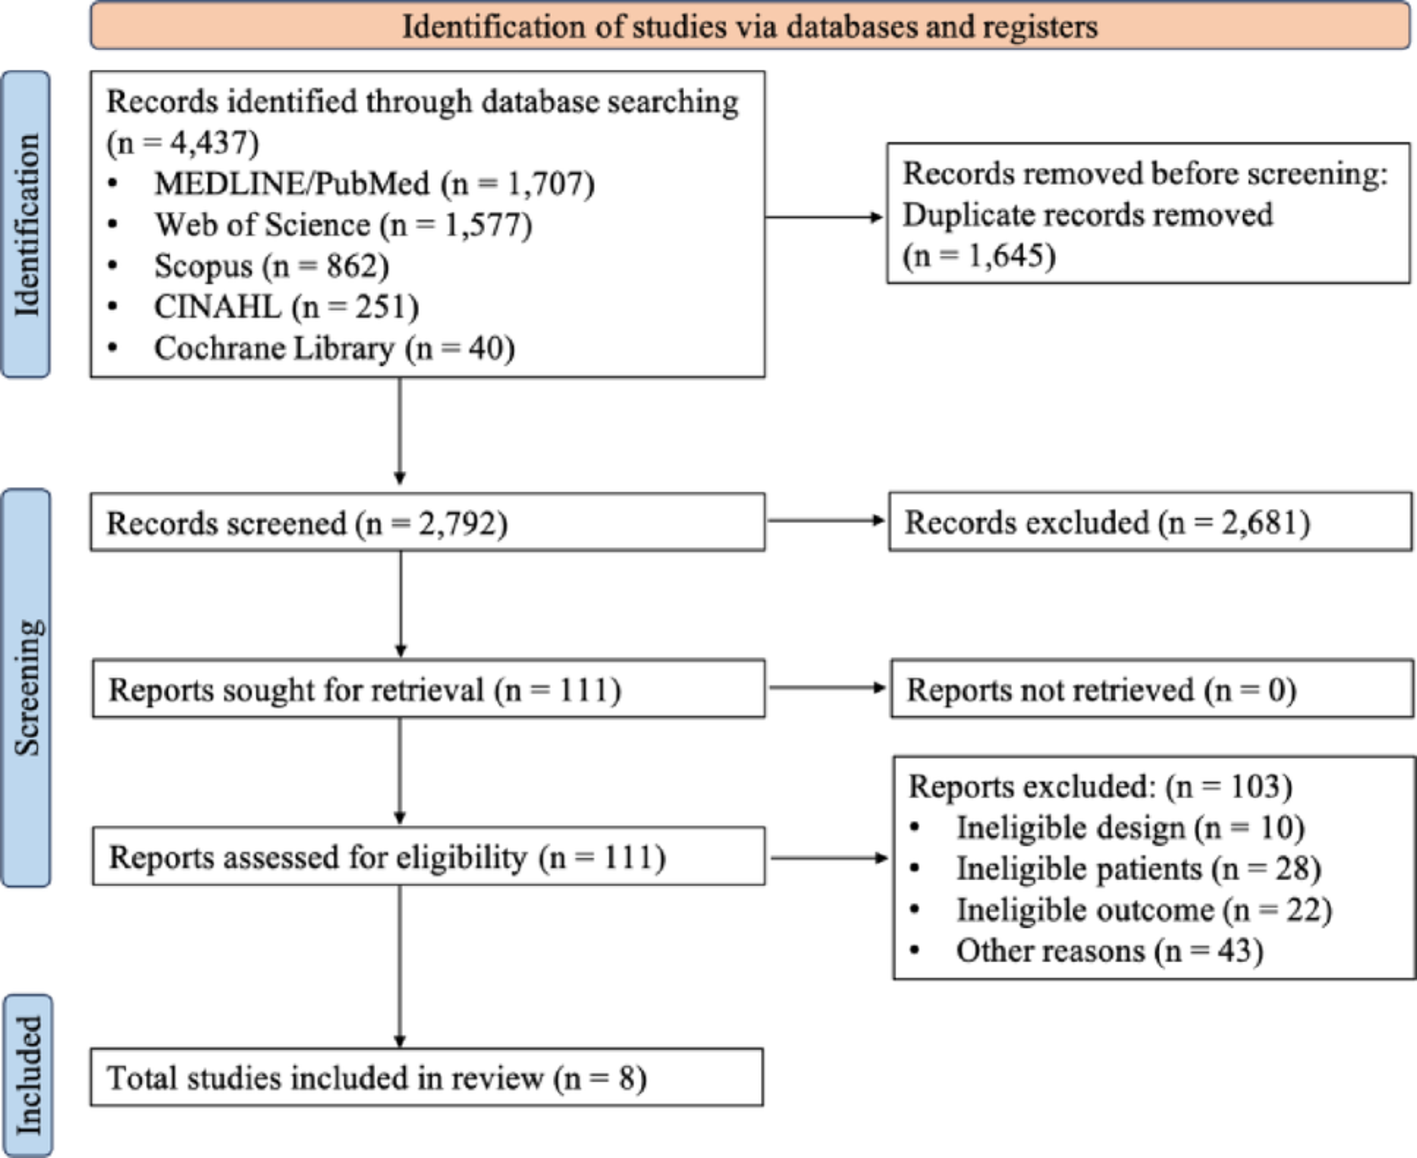
This meta-analysis adhered to PRISMA guidelines and MOOSE standards [20, 21].A comprehensive literature search was performed across multiple electronic databases including Cochrane Library, EMBASE, Global Health, MEDLINE, and PubMed from database inception through July 2024.
Search terminology included, but was not limited to, variants of “nonalcoholic fatty liver,” “steatohepatitis,” “mortality,” and “liver-related death,” alongside other relevant keywords identified from titles and abstracts. The detailed search methodology is provided. Reference lists of included studies were manually reviewed to identify additional relevant publications. Authors were contacted directly when articles were not accessible through standard search engines.
2.7 Study identification with inclusion and exclusion criteria study criteria
Inclusion criteria required: (a) Peer-reviewed original research articles, encompassing both prospective and retrospective matched cohort designs; (b) Utilization of hazard ratios (HRs) for statistical analysis; (c) Incorporation of the most comprehensively adjusted HR from original datasets; (d) Publication in English language only. Studies were excluded if they: (a) Represented duplicate publications; (b) Utilized alternative statistical measures (such as odds or risk ratios) for NAFLD versus non-NAFLD comparisons [22], (c) Consisted of systematic reviews, meta-analyses, editorial comments, retrospective analyses, case reports, cross-sectional designs, or animal experiments.
2.8 Data extraction and definition
Two independent reviewers (H. and D.) conducted blinded study identification. Disagreements were resolved through consultation with a senior clinician (H.C.) and team consensus discussion. The primary endpoint was overall liver-related mortality rates comparing NAFLD patients to non-NAFLD controls. Hazard ratios with corresponding 95% confidence intervals for liver-related mortality were extracted for NAFLD versus non-NAFLD populations. Given the absence of standardized definitions, NAFLD was defined as moderate to severe hepatic steatosis with normal liver enzyme levels [23]. Covariates used in multivariable modeling or propensity-score matching were systematically collected across studies.
2.9 Statistical analysis and quality assessment
Statistical significance was set at P < 0.05 unless otherwise specified. Analyses were conducted using R software, specifically rStudio (version 4.1.2) and STATA (17.1 STATACorp) with the meta package, maintaining significance threshold at P ≤ 0.05. Both fixed-effects and random-effects models were implemented to address potential heterogeneity. Heterogeneity sources were investigated through subgroup analyses followed by sensitivity testing. Hazard ratios were utilized to evaluate liver-related mortality associations between NAFLD and non-NAFLD groups. Missing data were excluded from synthesis procedures. Forest plots visualized individual study effect sizes, with diamonds representing pooled estimates. Publication bias was assessed using funnel plots with Begg’s and Egger’s tests. Sensitivity analyses evaluated result robustness and identified heterogeneity sources. Study heterogeneity was quantified using Cochrane Q statistics (significance at P < 0.10) and I² statistics (values > 0.50 indicating high heterogeneity) [24].


Comments (0)