
Remember me


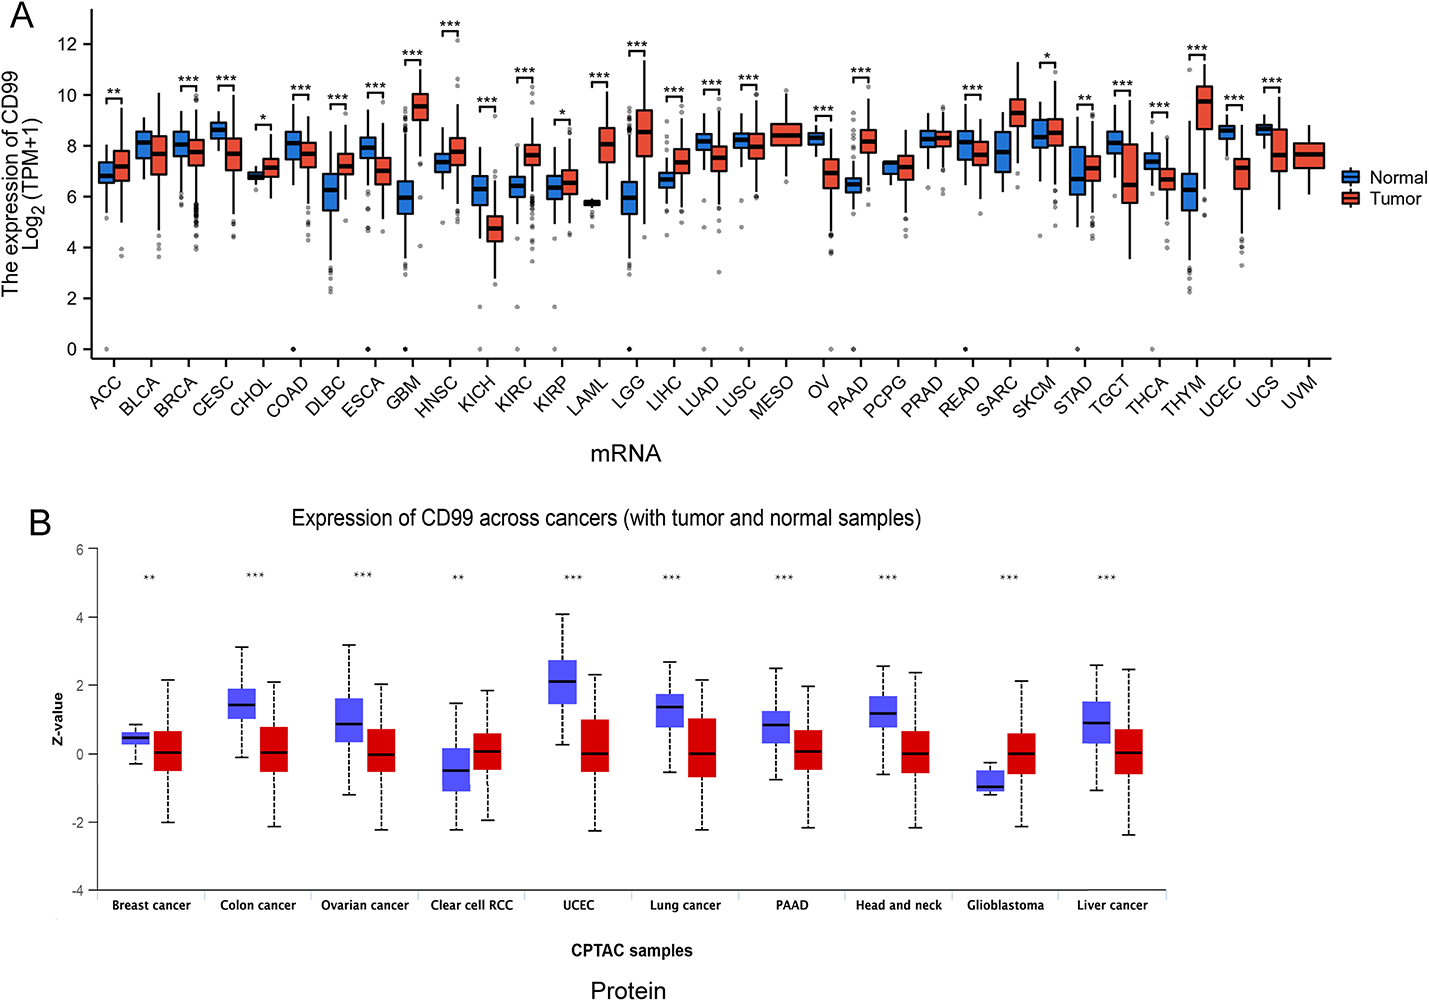
We undertook a comprehensive analysis of data from the TCGA and GTEx databases to elucidate the expression profile of CD99 across diverse cancer types. The results indicated that CD99 exhibits elevated expression in 13 specific cancers: ACC, DLBC, GBM, HNSC, KIRC, KIRP, LAML, LGG, LIHC, PAAD, SKCM, STAD, and THYM. In contrast, a diminished expression of CD99 was observed in another 13 cancers: BRCA, CESC, COAD, ESCA, KICH, LUAD, LUSC, OV, READ, TGCT, THCA, UCEC, and UCS (Fig. 1A). At the protein level, CD99 demonstrated a significant upregulation in RCC and glioblastoma, while its expression was markedly reduced in breast cancer, colon cancer, ovarian cancer, UCEC, lung cancer, PAAD, head and neck cancer, and liver cancer. Our research indicated that CD99 had varying functions across different cancer types. These findings highlight CD99’s variable expression patterns across malignancies, prompting further investigation into its genetic alterations and functional implications.
Fig. 1
The analysis of CD99 expression. A The differences in CD99 mRNA expression between normal tissue data in the GTEx database and tumor tissue data in the TCGA database. B The differences in CD99 protein expression were based on the UALCAN database using CPTAC data. *, P < 0.05; **, P < 0.01; ***, P < 0.001, ns, no significance
3.2 Analysis of genetic alterations in CD99The altered expression of CD99 in various tumors may be attributed to genetic mutations. This study further investigated the genetic mutation profile of CD99 across pan-cancer types. The mutation of the CD99 gene across all tumor tissues was evaluated using the cBioPortal platform. The findings revealed that esophageal adenocarcinoma exhibited the highest frequency of CD99 mutations at 6.04%, predominantly characterized by “deep deletion (homozygous deletion across the targeted genomic locus).” Moreover, notable frequencies of CD99 mutations were identified in Sarcoma (3.14%) in the “Amplified” form and Diffuse Large B-Cell Lymphoma (4.17%) in the “deep deletion” form (Fig. 2A). A detailed analysis of the CD99 mutation landscape indicated a distribution throughout the entire gene region, encompassing 31 specific point mutations. Notably, missense mutations were predominant, with 22 cases, followed by 4 truncating mutations, 4 splicing mutations, and 1 fusion mutation (Fig. 2B). Given CD99’s mutational landscape, we next evaluated its diagnostic and prognostic relevance across cancers.
Fig. 2
Genetic mutations of CD99 analyzed using the cBioPortal tool. A Frequency of CD99 mutations in different tumor types. B Types, sites and number of cases with CD99 genetic alterations in pan-cancer from cBioPortal. CD99, cluster of differentiation 99; TCGA, The Cancer Genome Atlas
3.3 The role of CD99 in the diagnosis of patientsThe ROC curve was employed to assess the diagnostic value of CD99 across various cancers. CD99 demonstrated substantial diagnostic utility (0.7 < AUC < 0.9) in CHOL, DLBC, ESCA, KICH, KIRC, LIHC, LUAD, OSCC, and UCEC. In contrast, it exhibited an exceptionally high diagnostic value (AUC > 0.9) in GBM, LAML, LGG, OV, PAAD, and THYM (Fig. 3). These findings suggested that CD99 possessed significant diagnostic potential in oncology. Beyond diagnosis, CD99’s prognostic impact was assessed to determine its clinical utility in survival prediction.
Fig. 3
The ROC curve about the diagnostic value of CD99. The association between CD99 expression and prognostic value was evaluated using R software
3.4 The impact of CD99 on patient prognosisWe employed Kaplan-Meier analysis to explore the relationship between CD99 expression and cancer prognosis. Our findings revealed a negative correlation between CD99 expression and OS in patients with BLCA, BRCA, KIRC, KIRP, LIHC, LUAD, pheochromocytoma, and PCPG, and STAD, whereas a positive correlation is observed in HNSC, PAAD, THYM, and UCEC (Fig. 4A). Furthermore, CD99 expression was negatively correlated with RFS in KIRC, LIHC, and LUAD, but exhibited a positive correlation in PAAD, PCPG, and UCEC (Fig. 4B).
Fig. 4
The relationship between prognosis and CD99 expression. The patients’ overall survival (OS) (A) and recurrence-free survival (RFS) (B) in a high or low CD99 level across diverse tumor types were demonstrated by Kaplan–Meier plotter
3.5 The association between CD99 and tumor-infiltrating immune cells and immune checkpointThe extent of immune infiltration within the tumor microenvironment (TME) is intricately linked to the onset, progression, and dissemination of cancer. Tumor-infiltrating immune cells and immune checkpoints play pivotal roles in cancer therapy [21]. To investigate this relationship, we extracted data from the TCGA database and analyzed the correlation between CD99 expression and tumor immune infiltrating cells. Our findings reveal that, across various cancer types, CD99 exhibits a positive correlation with nearly all immune cells, with the exceptions of THYM, LAML, and ACC (Fig. 5A). Furthermore, to validate the robustness of our findings, we employed six complementary computational algorithms (TIMER, CIBERSORT, EPIC, quanTIseq, MCP-counter, and xCell) for comprehensive immune infiltration analysis. These results were consistent with the data presented in Fig. 5A (Supplementary Fig. 2–7), demonstrating a pan-cancer association between CD99 expression and tumor microenvironment. Of particular clinical significance, LAML specimens with elevated CD99 levels showed statistically significant reductions in tumor-suppressive immune cell populations (CD8⁺ T cells and NK cells). This suggests that CD99 may serve as a molecular orchestrator of immune evasion mechanisms in hematological malignancies.
Immune checkpoints are essential in tumor immunotherapy and frequently serve as targets in cancer treatment. To elucidate the potential role of CD99 in immunotherapy, we assessed its impact on the expression of immune checkpoint-related genes. The results demonstrated that in STAD, READ, prostate adenocarcinoma (PRAD), OV, LUSC, LUAD, LIHC, LGG, KIRP, KIRC, KICH, HNSC, GBM, ESCA, COAD, CESC, BRCA, and BLCA, CD99 expression is predominantly positively correlated with immune checkpoint-related genes, whereas in THYM, TGCT, SKCM, SARC, and LAML, this correlation is primarily negative (Fig. 5B). This indicated that CD99 is significantly associated with tumor-related immune cell infiltration and the expression of immune checkpoints, underscoring its critical importance in immunotherapy across various cancer types.
Fig. 5
The relationship between CD99 expression and tumor-infiltrating immune cells, and immune checkpoints in pan-cancer. Analyzed the correlation between CD99 expression and the infiltration degrees of immune cells (A), and immune checkpoint molecules (B) in tumors by the R software. *, P < 0.05; **, P < 0.01
3.6 Analysis of CD99 with TMB, MSI, and RNA methylationWe further investigated CD99’s association with genomic instability markers (TMB/MSI) and RNA methylation regulation. CD99 exhibited a positive correlation with TMB in ACC (P < 0.001), whereas it manifested a negative correlation in HNSC (P < 0.001), STAD (P = 0.003), PRAD (P = 0.009), and ESCA (P = 0.01) (Fig. 6A). Additionally, CD99 was positively correlated with MSI in sarcoma (SARC) (P = 0.005) and READ (P = 0.03), but negatively correlated in STAD (P = 0.007) and LUAD (P = 0.02) (Fig. 6B). RNA methylation modifications have been recognized as critical determinants in the progression of various malignancies. We investigated the association between CD99 and RNA methylation, focusing on m6A, m1A, and m5C linked to writer, eraser, and reader proteins. The results implied that across all cancer types, CD99 was predominantly positively correlated with m6A, m1A, and m5C RNA methylation-associated proteins (all P < 0.05) (Fig. 6C).
Fig. 6
The relationship between CD99 expression and TMB, MSI, and RNA methylation modifications. The correlation between CD99 expression and TMB (A) or MSI (B) according to the TCGA database. The correlation between mRNA expression of CD99 and RNA modification (m1A, m5C, m6A) using Sangerbox (A). *, P < 0.05
3.7 Enrichment analysis related to CD99Utilizing the GSCA database, we examined which pathways are primarily influenced by CD99 expression across 32 cancer types. Our analysis revealed that changes in CD99 expression predominantly suppressed the DNA damage pathway (in 25 cancer types) and the hormone pathway (in 22 cancer types), while significantly activating the EMT pathway (in 25 cancer types) (all P < 0.05) (Fig. 7A). To gain further insight into CD99’s role in protein pathways, we constructed a PPI network of 50 genes linked to CD99 using the STRING database (Fig. 7B) and identified the 100 most similar genes to CD99 in the TCGA through the GEPIA2 database. We then conducted KEGG and GO analyses on these CD99-related genes (Fig. 7C). KEGG analysis revealed that pathways such as hematopoietic cell lineage, cell adhesion molecules, and tight junctions are associated with CD99’s role in tumors. Meanwhile, GO analysis indicated that CD99 was primarily associated with leukocyte migration in biological processes (BP), the external side of the plasma membrane in cellular components (CC), and integrin binding in molecular functions (MF).
Fig. 7
Enrichment analysis of CD99. A The associated pathway analysis of CD99 in the GSCA database. B The CD99-associated protein-protein interaction networks were obtained from the STRING online database. C The GO and KEGG enrichment analysis of CD99-related genes by the “clusterProfiler” of R software
3.8 Drug sensitivity analysis of CD99 in pan-cancerChemosensitivity testing of tumors involves the in vitro culture of viable cancer cells derived from surgically resected tumor specimens, followed by exposure to a panel of anticancer agents to identify chemotherapeutic drugs with optimal efficacy [22]. The resulting drug sensitivity profile guides clinicians in formulating personalized chemotherapy regimens, thereby enhancing treatment outcomes and survival rates while minimizing unnecessary toxicities in cancer patients [23]. Using the GSCA database, we analyzed the relationship between CD99 expression and chemotherapy drug sensitivity. Based on data from the GDSC database, we identified the 30 drugs most closely associated with CD99 expression across pan-cancer. Our findings revealed a positive correlation with 12 drugs, including 5-Fluorouracil, AR-42, and AT-7519 (Fig. 8A), suggesting that increased CD99 expression may contribute to drug resistance. Conversely, CD99 expression showed a negative correlation with 18 drugs, such as 17-AAG, AG-014699, and Cytarabine, indicating that higher CD99 levels could enhance drug sensitivity. Additionally, we analyzed the top 30 drugs that correlated positively with CD99 expression in the CTRP database and found a positive correlation with drugs like afatinib, apicidin, and belinostat (Fig. 8B), further suggesting that increased CD99 expression may lead to resistance to these treatments.
Fig. 8
Drug sensitivity analysis of CD99 in pan-cancer. A The drug sensitivity analysis of CD99 in GDSC. B The drug sensitivity analysis of CD99 in CTRP. GSCA, Gene Set Cancer Analysis
3.9 CD99 enhances malignant behaviors in melanoma and glioma cells in vitroDrawing from the bioinformatics analysis in this study, we hypothesized that CD99 could play a pivotal role in the biology of melanoma and glioma cells. To explore this, we evaluated CD99 protein expression in B16-F10, A375, and U251 cell lines. Our results demonstrated significant downregulation of CD99 protein in B16-F10 cells following CD99 knockdown with siRNA (siRNA-CD99) (Supplementary Fig. 1A), accompanied by reduced CD99 mRNA and protein levels in A375 (Fig. 9A, Supplementary Fig. 8A) and U251 cells (Fig. 9D, Supplementary Fig. 8B). To further investigate, we conducted proliferation assays comparing siRNA scramble control (siRNA-scr) and CD99 knockdown (siRNA-CD99) conditions across these cell lines. The findings revealed that CD99 silencing significantly suppressed proliferation in B16-F10 cells (Supplementary Fig. 1B) as well as in A375 (Fig. 9B) and U251 (Fig. 9E) cells. Moreover, we assessed CD99’s influence on cell migration using a Transwell assay, which showed that CD99 knockdown substantially impaired the migratory capacity of B16-F10 (Supplementary Fig. 1C), A375 (Fig. 9C), and U251 (Fig. 9F) cells through the membrane. Collectively, these results indicate that CD99 enhances the proliferation and migration of melanoma and glioma cells.
Fig. 9
The role of CD99 in A375 and U251 cells. A RT-qPCR analysis of CD99 expression in A375 cells after they were transfected with siRNA-CD99. B Proliferation assay to evaluate the cell count of A375 cells following siRNA-CD99 transfection. C Transwell assay to assess the migration capacity of A375 cells after they were transfected with siRNA-CD99. D RT-qPCR analysis of CD99 expression in U251 cells after they were transfected with siRNA-CD99. E Proliferation assay to evaluate the cell count of U251 cells following siRNA-CD99 transfection. F Transwell assay to assess the migration capacity of U251 cells after they were transfected with siRNA-CD99. **, P < 0.01; ***, P < 0.001
Comments (0)