2.1 Data collection and preprocessing
First of all, we obtained the mRNA expression profiles and clinical data of 499 PCa samples and 52 normal samples from the Cancer Genome Atlas (TCGA) database (https://portal.gdc.cancer.gov/) [16]. The clinical features of PCa patients included age, T-stage, N-stage, biochemical recurrence (BCR) status, and BCR-free time. In TCGA database, there was a total of 405 PCa cases with unabridged data of transcriptome data, BCR status, and BCR-free time. All these data were processed using Perl language and R language. The Ensemble database (http://asia.ensembl.org/signature.html) was utilized to convert Ensemble IDs into gene symbols. The TCGA cohort (405 PCa cases) was randomly divided into the training cohort (204 PCa cases) and testing cohort (201 PCa cases) [17].
Additionally, datasets of GSE70770 were obtained from Gene Expression Omnibus (GEO) database (https://www.ncbi.nlm.nih.gov/geo/). There was a total of 203 PCa cases with unabridged data of transcriptome, BCR status, and BCR-free time in the GSE70770 dataset. All PCa cases in GSE70770 dataset were used as validating cohort. The docetaxel resistance related genes (DRGs) were obtained from Patricia M. Schnepp’s study [18] by comparing the transcriptome data between docetaxel sensitive and resistant DU145 or PC-3 cells.
2.2 Bioinformatics analysis
We then utilized “limma” R package to filter DRGs between docetaxel sensitive and resistant DU145 or PC3 cells, respectively. The cut-off value was set as false discovery rate (FDR) < 0.05 and log2 |fold change (FC)| >1 [19].
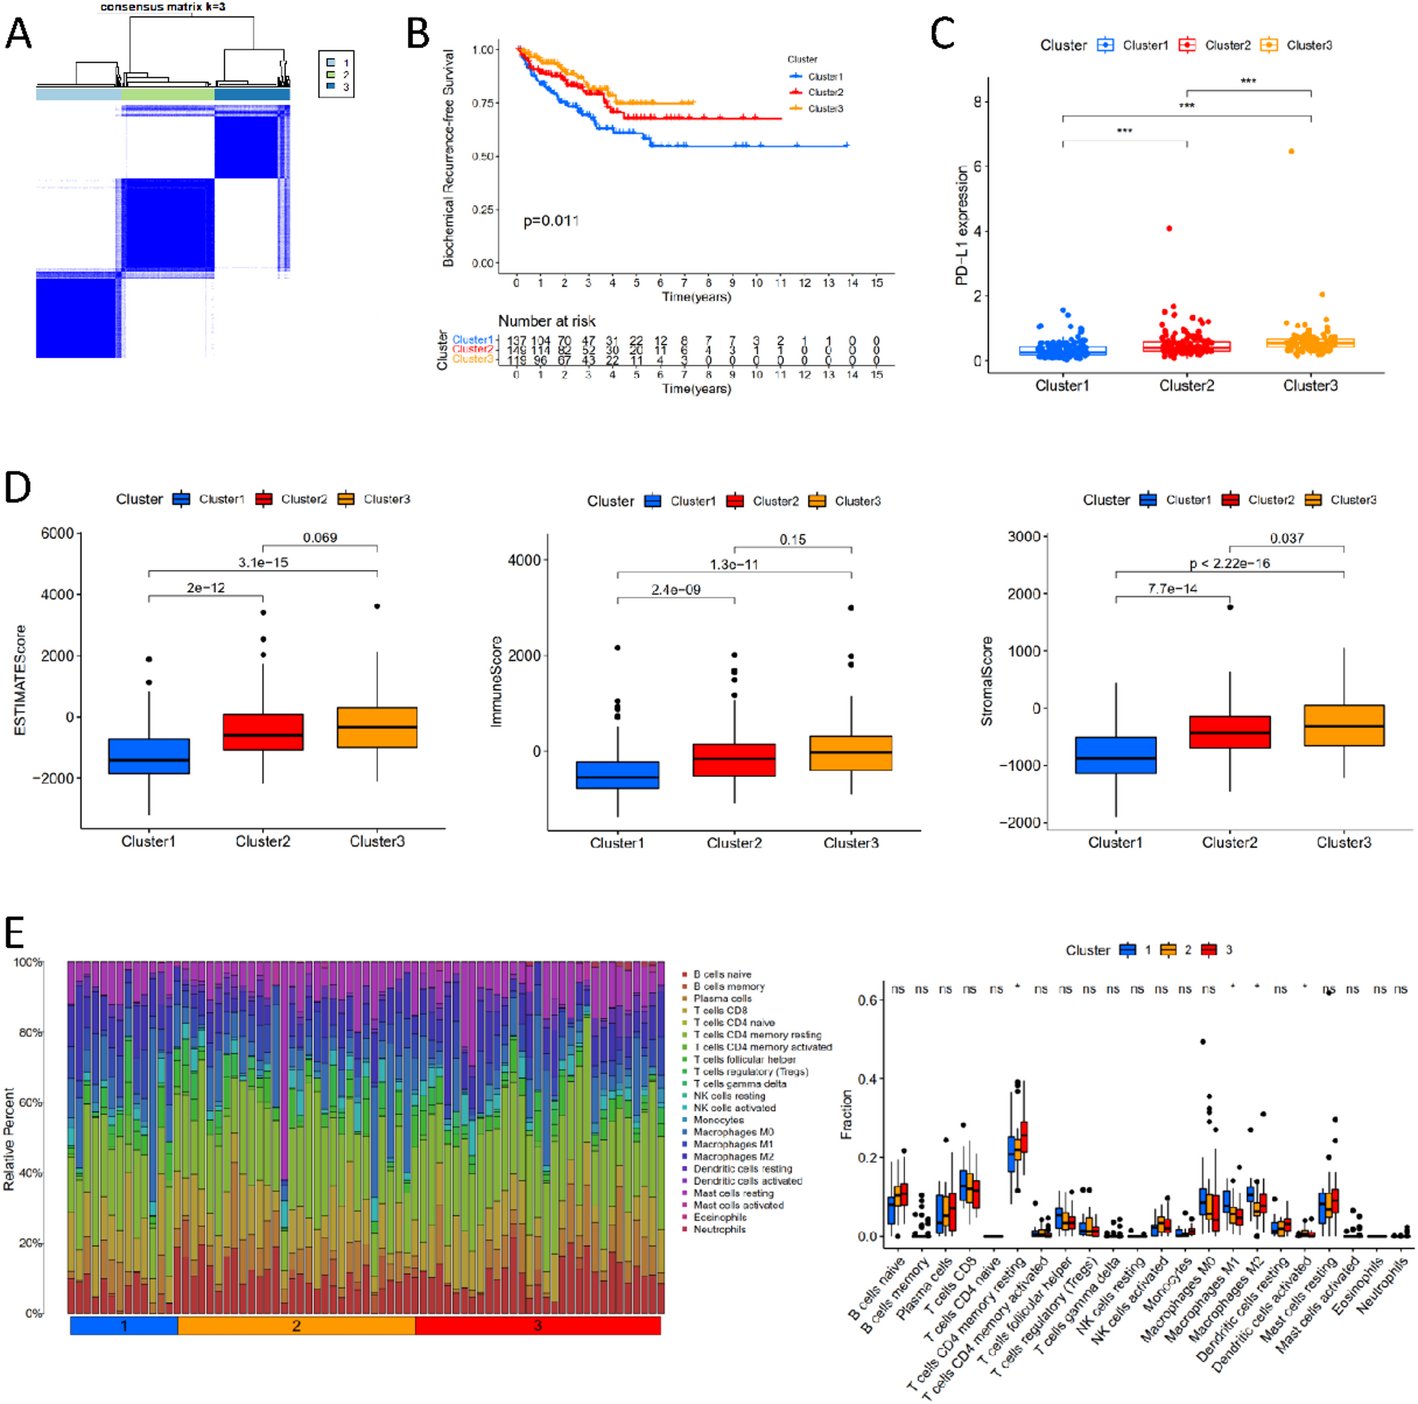
“ConsensusClusterPlus” R package was used for conducting consensus clustering analysis to identify PCa molecular clusters related to resistance to docetaxel chemotherapy. R packages “survival”, “survminer”, “ggplot2” and “pheatmap” were utilized to investigate the correlation of docetaxel resistance related molecular clusters with clinicopathologic characteristics (including BCRFS, age, T stage, N stage, PD-L1 expression level). The ESTIMATE algorithm was used to access tumor immune microenvironment scores [20] while the CIBERSORT method was utilized to calculate the score of 22 types of immune infiltrating cells [21]. The correlations of docetaxel resistance related molecular clusters with PCa tumor immune microenvironment and immune cells infiltration were especially investigated.
In addition, R package “survival” and “survminer” were used for performing Cox regression analysis in the training cohort to develop a novel docetaxel resistance related prognostic molecular risk score for predicting BCRFS of PCa. Most importantly, internal and external verification was performed in testing cohort and validating cohort, respectively. The risk distribution of TCGA cohort, training cohort, testing cohort, and validating cohort was presented using “pheatmap” R package. According to the median risk score derived from the docetaxel resistance related risk score, we divided PCa patients into high-risk and low-risk subgroups in training cohort, testing cohort, and validating cohort. Particularly, subgroup survival analysis was conducted in older and younger patients, stage T I-II and stage T III-IV patients, stage N0 and stage N1 patients, and different molecular clusters.
The scores of 13 immune function activity in TCGA cohort were calculated by single-sample gene set enrichment analysis (ssGSEA) using R package “gsva”. Then, the correlations of docetaxel resistance related risk score with immune cells infiltration, immune functions, tumor mutation burden, m6A genes expression levels, clinical features, and checkpoint genes expression levels were especially investigated. Moreover, gene set enrichment analysis (GSEA) was performed to investigate the underlying mechanisms related to this docetaxel resistance related risk score, as the previous described [22]. The TIMER 2.0 database (http://timer.cistrome.org/) was used for calculating the score of immune infiltrating cells via seven methods.
2.3 Cell culture
Human PCa cell lines, DU145 and PC-3, were purchased from Procell Life Science&Technology Co.,Ltd. The following culture media were used: DU145 cells were maintained in MEM medium and PC-3 cells were maintained in Hams F-12 K medium. Cells were cultured in their preferred medium supplemented with 10% fetal bovine serum and 1% penicillin-streptomycin at 37 °C and 5% CO2.
2.4 RNA-Interference and overexpression
Small-interfering RNAs (siRNAs) and overexpressed plasmids constructed with pcDNA3.1(+) were purchased from Shanghai GenePharma Co., Ltd. DU145 cells and PC-3 cells were plated into 6-well plate separately. When cells were grown to approximately 80% confluence, transfections of siRNAs or overexpressed plasmids were performed using lipofectamine 2000 reagent (Thermo Fisher Scientific) according to the manufacturer’s instructions. Transfected cells were harvested after 48 h of the transfection and the efficiency of knockdown or overexpression was verified. The two siRNAs with the highest knockdown efficiency were used for subsequent experiments.
siRNA#1: Sense (5’-3’) GAACACCCAGACCCUAUCUTT.
Antisense (5’-3’) GGCAGCUGCUUCAGUAAGCTT.
siRNA#2: Sense (5’-3’) AGAUAGGGUCUGGGUGUUCTT.
Antisense (5’-3’) GCUUACUGAAGCAGCUGCCTT.
2.5 RT-qPCR
We used TRIzol reagent to extract the total RNA and then used the TransScript® Green One-Step qRT-PCR SuperMix to generate cDNA. Next, we used Taq Pro Universal SYBR qPCR Master Mix to detect the expression levels of RNA. The expression levels were normalized based on the expression of GAPDH.
GAPDH: forward 5-GGTGTGAACCATGAGAAGTATGA-3,
reverse 5-GAGTCCTTCCACGATACCAAAG-3.
NOG: forward 5-ATCTGAACGAGACGCTGCTG-3,
reverse 5-TTTGATCTCGCTCGGCATGG-3.
2.6 Western blot
We used RIPA buffer to lyse cell samples and then used BCA assay kit to quantify the proteins. Proteins were separated based on their own molecular weight by 10% SDS-PAGE and transferred to PVDF membranes. Specific primary antibodies and HRP-conjugated goat anti rabbit IgG were used for incubation. ECL reagent was used to develop the bands. The following is the information about antibodies used in immunoblot: anti-NOG (1:1000; proteintech; 30023-1-AP), anti-β-actin (1:2000; proteintech; 20536-1-AP).
2.7 Cell counting Kit-8 (CCK-8) assay
IC50 values of transfected DU145/PC-3 cells or DU145R/PC-3R cells were determined using CCK-8 assays to evaluate resistance to docetaxel of cells. DU145/PC-3 cells or DU145R/PC-3R cells after transient transfection were plated at 1.0 × 10⁴ cells per 100 µl in each well of 96-well plate. After 24 h of incubation, cells were incubated with docetaxel drugs for 24 h according to following concentration gradients: 0nM, 1nM, 2.5nM, 5nM, 10nM, 20nM, 40nM. 10% CCK-8 reagent and 90% complete medium and the plates were incubated at 37 °C. Finally, the SpectraMax M5 microplate reader (Molecular Devices, Sunnyvale, CA, USA) was used to read absorbances at 450 nm.
2.8 Construction of DU145R and PC-3R
PC-3R and DU145R cells were generated using an intermittent, stepwise doseescalation strategy [23, 24]. When the DU145 and PC-3 cells density reaches 85–95% (preferably 90%), 0.1 nM docetaxel is added for induction for 24 h. Next, drug-free medium was used for continued culture until the cells resume the normal growth, and then cells were cultured at the same concentration of docetaxel to confirm their adaptability. Gradually increase the concentration of docetaxel in a gradient: 0.2 nM, 0.5 nM, 0.75 nM, 1 nM, 1.5 nM, 2 nM, 5 nM, 7.5 nM, 10 nM, 15 nM. This process continued until the proliferation rate of PC-3 or DU145 cells cultured in docetaxel was comparable to that of untreated control cells. After 6 months of continuous exposure, DU145 and PC-3 cells developed resistance to docetaxel, and these cells were designated as PC-3R and DU145R. We measured the docetaxel IC50 of PC-3R and DU145R to confirm the ability of resistance to docetaxel.
2.9 Colony formation assays
Cells were plated into six-well plates (1 × 10³ cells per well) and further incubated in docetaxel-containing medium for 2 weeks. Then, the cells were fixed with 4% formaldehyde and stained with 0.5% crystal violet. The number of colonies was then counted under a microscope.
2.10 In vivo tumorigenesis assay
We purchased four weeks-old male BALB/c nude mice from Shanghai SLAC Laboratory Animal Co., Ltd (Shanghai, China). A subcutaneous model was established by subcutaneously implanting stable DU145 cells (5 × 10⁶ cells/mouse) into the flanks of nude mice (n = 5 mice per group). Docetaxel was injected into subcutaneous tumors (5 µg/g) every 3 days from day 9 onwards. The tumors were observed and measured every three days. TumoCentral Hospital.
2.11 Statistical methods
Statistical analysis was conducted using R x64 4.1.0 software and SPSS software version 19.0 (SPSS, Inc., Chicago, IL, USA). Univariate and multivariate Cox regression analysis were performed to establish a docetaxel resistance related prognostic risk score for predicting BCRFS of PCa. Survival analysis, time-dependent the receiver operating characteristic (ROC) curve analysis, and independent prognostic analysis were performed to validate the performance of this docetaxel resistance related risk score. The student’s t-test, chi-squared test, Mann-Whitney U test, Kruskal-Wallis test, and one-way ANOVA test were performed for comparison. Survival curves were prepared using the Kaplan-Meier method (log-rank t-test was used for the comparison). The independent prognostic factors were analyzed by Cox’s proportional hazard regression model. P < 0.05 was considered statistically significant.


Comments (0)