
Remember me

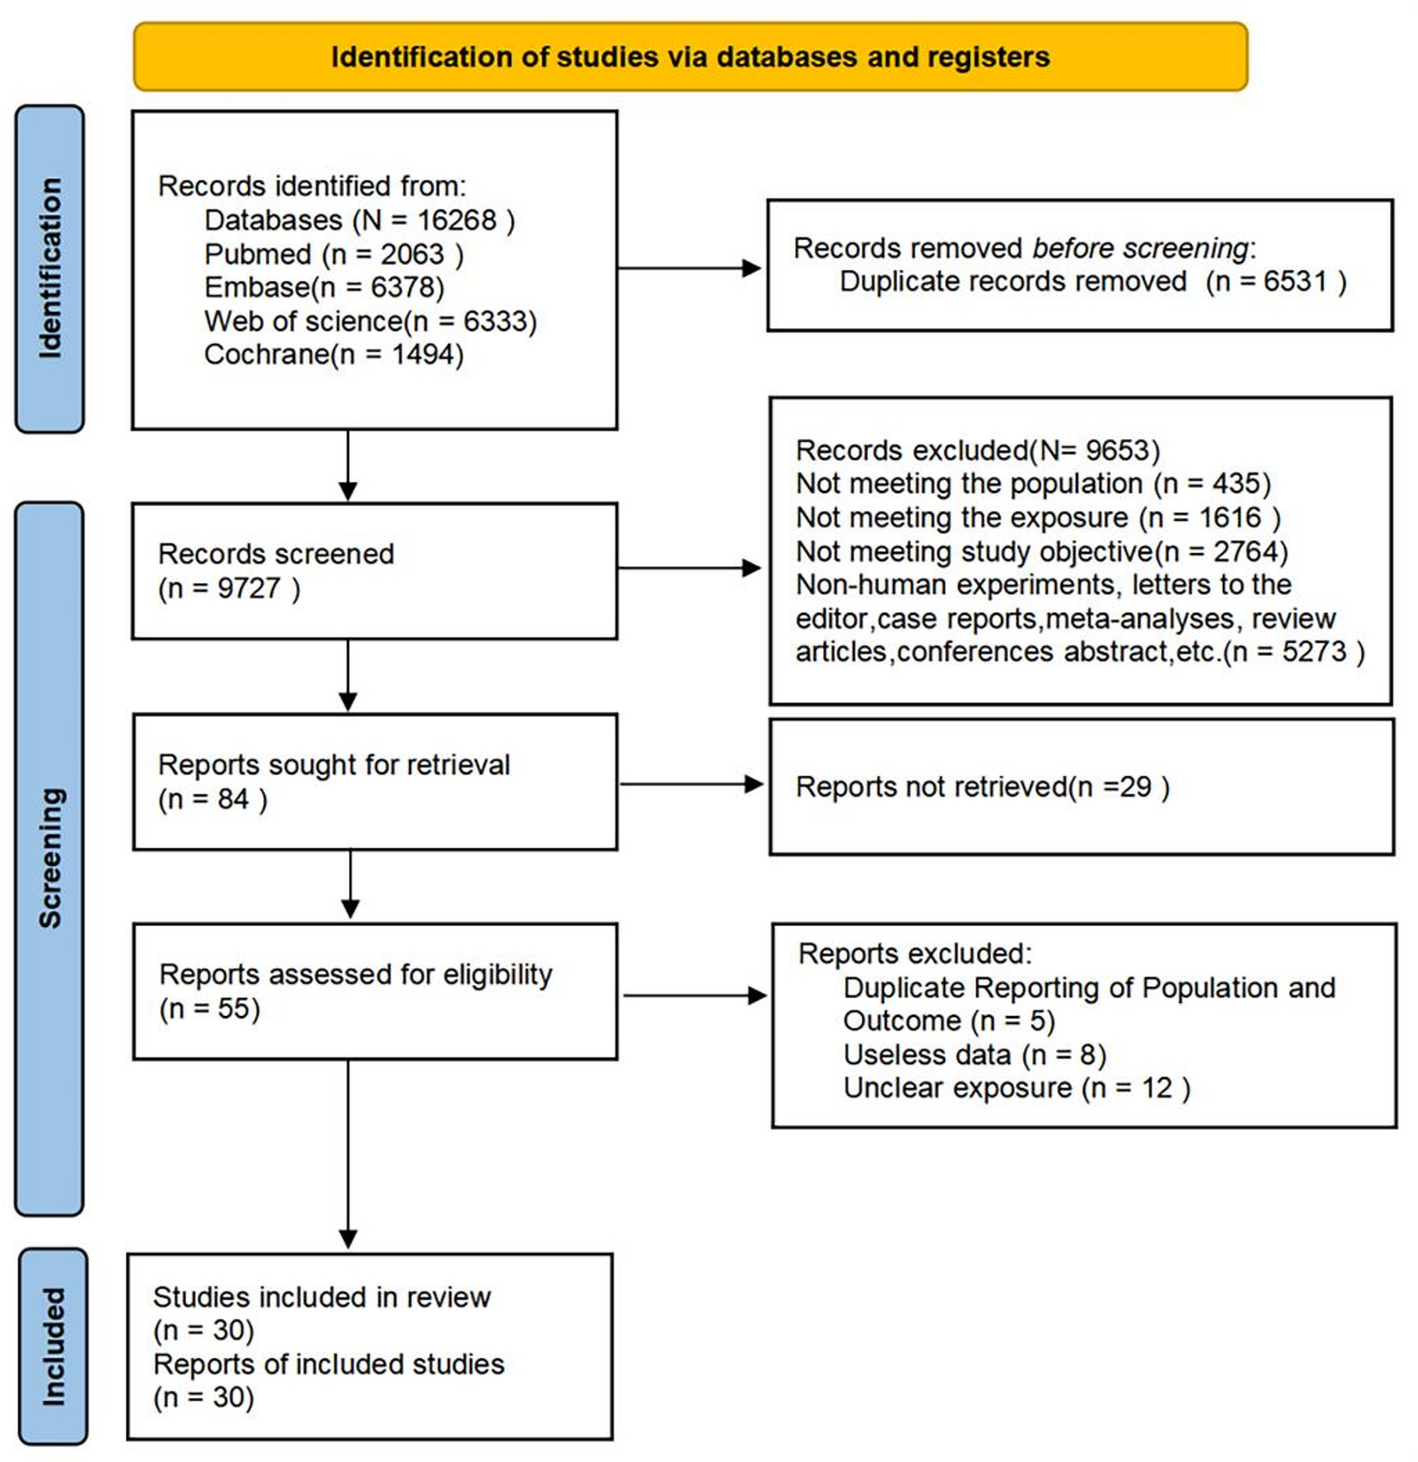

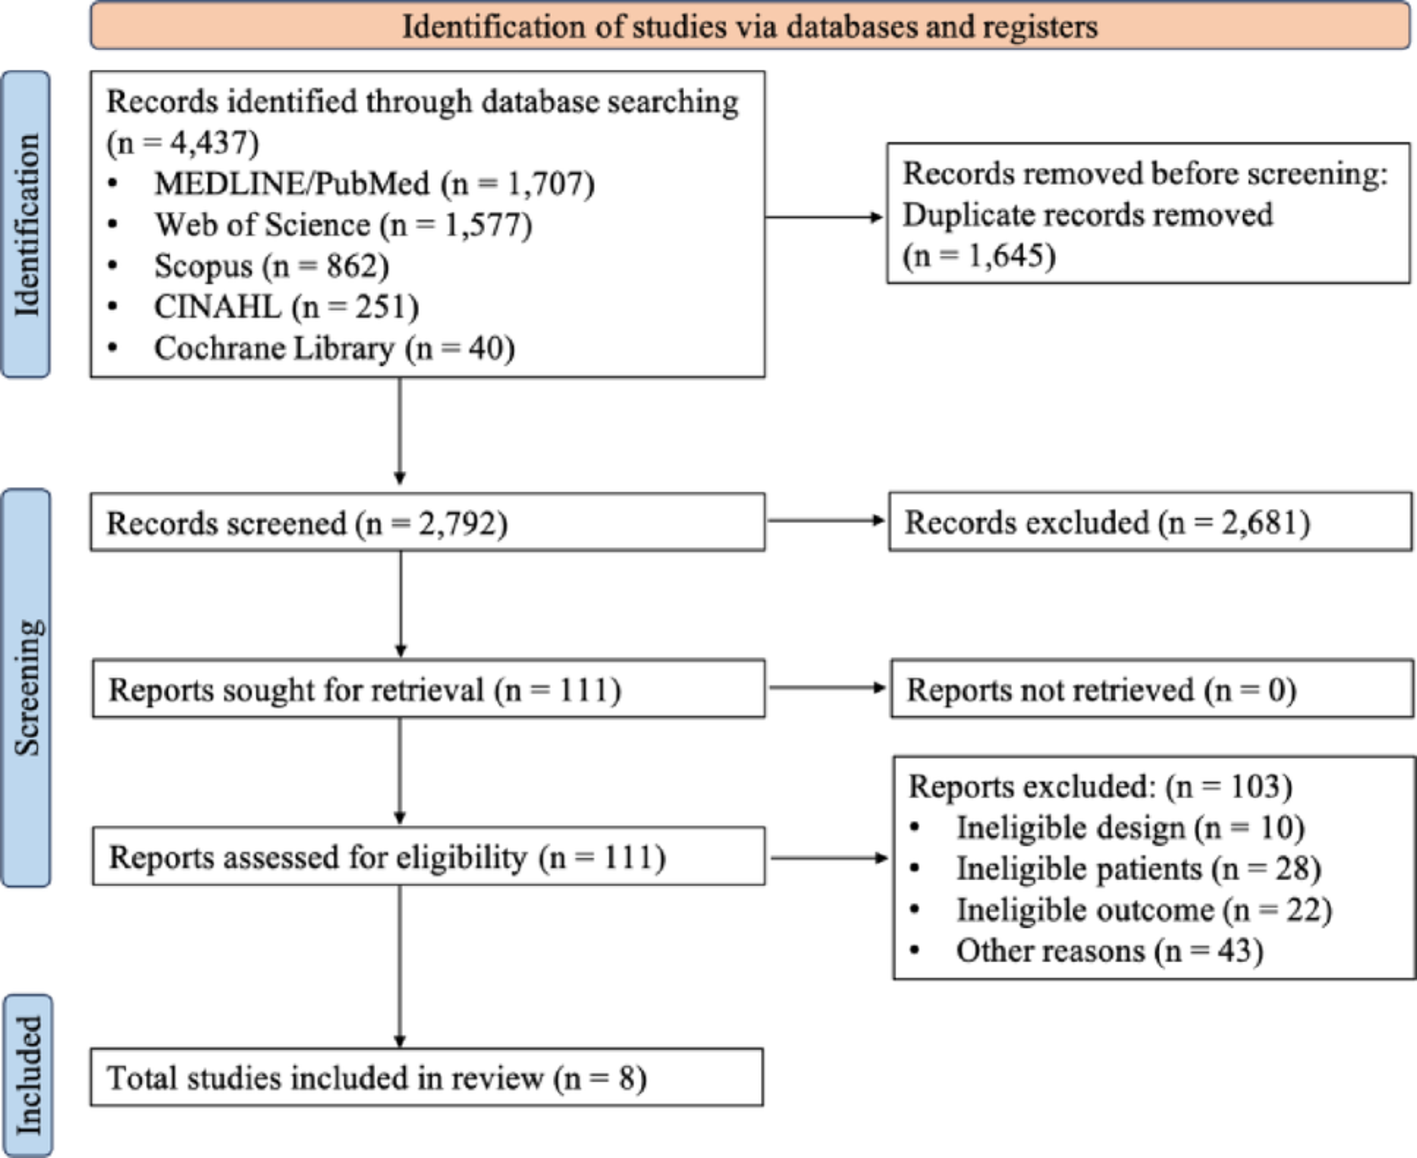
Initially, topic searches in the Web of Science Core Collection (WoSCC) and Scopus database, employing the keywords (“Colorectal Neoplasm*” OR “Colorectal Tumor*” OR “Colorectal Cancer*” OR “Colorectal Carcinoma*”) AND (“ctDNA” OR “circulating tumor DNA” OR “cell free tumor DNA”), yielded 1,536 and 1,730 results respectively. Following the exclusion of non-articles and reviews, non-English full texts, studies published in 2025, those without a DOI number, and duplicates, a total of 1,106 articles from WoSCC and 1,420 from Scopus were obtained. After removing 781 duplicates between the two databases, we were decided to exclude articles published before 2011 from the analysis, as the number of articles prior to 2011 was low (n = 15). A total of 1,730 publications were included in the bibliometric analysis. Of these, 325 were unique to WOS and 639 were unique to SCOPUS. These publications had a total of 37,113 citations, with an average of 46.16 citations per document. The flowchart of data collection and filtering is shown n Fig. 1.
Fig. 1
Flowchart of data collection and analysis
Figure 2 depicts the annual publication trends concerning ctDNA and CRC over the past thirteen years. The number of publications exhibited a substantial increase, rising from a mere 2 in 2011 to 261 in 2024. This upward trajectory was marked by a pronounced escalation, with an average annual growth rate of 42.05%. The statistical analysis further consolidated this trend, revealing a strong correlation (R² = 0.95, p < 0.001). During the initial four years, research in this field garnered relatively scant attention, as evidenced by a modest output of 15 articles and reviews. Nevertheless, from 2015 to 2019, the annual research output experienced a remarkable upsurge, with the number of publications increasing significantly. This surge undoubtedly reflected a growing academic interest and intensified research activities within this domain. Despite a slight deceleration in the growth rate in 2021, there was a swift rebound in 2023 and 2024, culminating in a peak of 261 publications in 2024. Although the number of publications in 2023 registered a slight dip, it still remained at a relatively high level when compared to previous years.
Fig. 2
Trends in annual publications of cDNA in the field of CRC
Contribution of countries.
All publications covered 62 countries and regions. The United States had the highest number of publications, with 555 documents, accounting for 32.1% of the total, followed by China (306, 17.7%), Italy (218, 12.6%), Japan (129, 7.5%), and France (110, 6.4%). Figure 3a depict the annual and cumulative production changes for the top 5 countries in publication, respectively. From 2011 to 2023, publications from these five countries showed a steady increase. Before 2015, there was no significant difference in production among these countries. However, the USA showed a dramatic increase since 2015, maintaining its position at the top. Before 2020, Italy held the second position, but China caught up and claimed second place in 2022. Figure 3b presents a global map illustrating the distribution of publications related to circulating tumor DNA (ctDNA) associated with colorectal cancer (CRC). The map uses varying shades of blue to represent the number of publications per country, with darker shades indicating higher output. The USA appears in the darkest shade, signifying its leading position with the highest number of publications in this field. Other countries such as China, Japan, Italy, and France are also visible in darker shades, reflecting their significant contributions. Figure 3c displays the top 15 most productive countries based on the affiliation of the corresponding authors. The UK exhibited the highest ratio of multiple-country publications to total publications (57.1%), indicating extensive inter-country collaboration. Canada (50%), Spain (40%), Australia (34.1%), and Germany (30.6%) ranked second to fifth, respectively. China had the lowest ratio among the top 15 countries at 9.1%. Notably, the USA, China, and Italy exhibited the largest nodes and were positioned centrally on the map, clustered together in green. The United States demonstrated the highest total link strength (441), followed by Italy as shown in Supplementary Table 1.Furthermore, Fig. 3d illustrates the global prevalence trend of colorectal cancer (CRC) from 1990 to 2024, based on 5-year intervals. The historical data from 1980 to 2021 shows a general upward trend in the mean prevalence of CRC worldwide, increasing from approximately 700,000 cases per 100,000 population in 1990–1994 to around 1,200,000 cases per 100,000 population in 2015–2019. The predicted data for 2022–2025 indicates a continued rise, with the mean prevalence reaching nearly 1,500,000 cases per 100,000 population by 2024.
Fig. 3
(a) The accumulate numbers of publications in the 5 most productive countries. (b) Presents a global map illustrating the distribution of publications related to ctDNA associated with CRC. (c) The collaboration rate of the top 15 most productive countries based on the affiliation of the corresponding author. SCP, single-country publications. MCP, multi-country publications. (d) Global Colorectal Cancer Prevalence Trend, Historical Data (1980 − 2021) and Predicted Data (2022 − 2025)
Comparing this trend with the annual publication volume in the field of CRC and ctDNA (Fig. 2), there is a notable correlation. The increase in research output, especially from 2015 onwards, coincides with the growing prevalence of CRC globally. This suggests that as the disease burden of CRC rises, there is a corresponding increase in research efforts to address the challenges posed by this cancer. The surge in publications may reflect the urgent need for better diagnostic tools, treatment strategies, and preventive measures to combat the rising incidence of CRC.
2.2 Contribution of institutionsThe contribution of institutions was analyzed, and the major organizations in this field were shown in Fig. 4a. Among them, the top 5 for publications were University of Texas Md Anderson Cancer Centre (n = 51) from USA, National Cancer Center Hospital East (n = 37) from Japan, IRCCS (n = 32) from Italy, Aarhus University Hospital (n = 31) from Denmark and University of Turin (n = 26) from Italy. However, the one with the most citations was University of Turin (9220 citations), and the top institution in total link strength was National Cancer Center Hospital East (Supplementary Table 2). Notably, of the top 10 most productive organizations, half of them are from Australia or Italy. Figure 4b displays the institution co-authorship network map created by VOSviewer. It includes 119 prominent institutions with at least 5 publications each. The University of Texas MD Anderson Cancer Center are positioned at the center of the map, suggesting their significant role among the institutions.
Fig. 4
(a) Publication and citation quantity for the top 10 institutions. The length of each bar represents the number of publications, while the number beside the bar indicates the total citation count of the institution. (b) Co-authorships analysis of institutions in network visualization map
2.3 Journals and co-cited journalsThere are 248 active journals in the field of circulating tumor DNA (ctDNA) associated with colorectal cancer (CRC). Figure 5a presents the top 10 most prolific journals. Leading the list is Cancers, with 122 publications accounting for 7.05% of the total, followed by Frontiers in Oncology with 72 publications (4.16%), Clinical Cancer Research with 53 publications (3.06%), International Journal Of Molecular Sciences with 39 publications (2.25%), and JCO Precision Oncology with 30 publications (1.73%). Among these top 10 journals, 4 are classified as Q1 and 5 as Q2 according to the Journal Citation Reports (JCR). Annals of Oncology has the highest Impact Factor (IF) at 56.7. Figure 5b depicts the annual production changes for the top 5 journals. Cancers has outpaced other journals by publishing a significant volume of articles in this particular field, establishing itself as the leading journal with the highest number of publications. Additionally, a co-citation map of journals, generated by VOSviewer, is illustrated in Fig. 5c. The most frequently co-cited journal was Journal of Annals Of Oncology (5858 local citations), followed by Clinical Cancer Research and Cancers. The co-citation map also shows a dense network of journals, indicating extensive connections and collaborations within the field. Journals such as Oncotarget, Molecular Oncology, and Cancer Discovery are also notable for their contributions and co-citation frequencies. The data highlights the dynamic and interconnected nature of research publication in the area of ctDNA and CRC, with a few key journals dominating the landscape in terms of volume and impact.
Fig. 5
(a) The quantity of publications and citations for the top 10 journals. The length of each bar represents the number of publications, while the number beside the bar indicates the total citation number of the journal. (b) Annual numbers of publications in the 5 major journals. c) Journal co-citation analysis by VOSviewer
2.4 Contribution of authorsThrough statistical analysis, it was found that a total of 9619 authors contributed to all 1730 documents, with 10 of them being single-authored documents. Among these authors, Bardelli A from Italy emerged as the most prolific author with 44 publications, followed by Yoshino T from Japan with 43 publications, Nakamura Y from Japan with 37 publications, and Kopetz S from the USA with 35 publications. Siena S from Italy and Sartore-Bianchi A from Italy also made significant contributions with 32 and 31 papers each, respectively. Siravegna G from Italy had 29 publications, Di Nicolantonio F from Italy had 26 publications, and Taly V from France and Mussolin B from Italy had 21 and 17 publications, respectively.
Ranked by h-index, the top three authors were Bardelli A (h-index = 32), followed by Siravegna G (h-index = 26), and Siena S (h-index = 23). The m-index, which corrects for the time of scientific activity and serves as an indicator for “scientific quality,” yielded the same top three authors as the h-index. Regarding citations, Bardelli A (13,685 citations), Siravegna G (9,158 citations), and Siena S (8,163 citations) remained in the top three positions, followed by Sartore-Bianchi A (6,807 citations) and Yoshino T (4,175 citations) (Supplementary Table 4). Notably, the top 10 authors in this field have a high level of productivity and impact, with their publications and citations reflecting significant contributions to the research on circulating tumor DNA associated with colorectal cancer.
A visualization of the number of publications per year for the top 10 authors is presented in Fig. 6a, with the size of the dot representing the number of articles per year. It was observed that Bardelli A and Siravegna G from Italy published most of their work between 2016 and 2019, while Yoshino T and Nakamura Y from Japan had a higher publication rate in the past three years. Additionally, co-authorship analysis between authors was performed using VOSviewer (Fig. 6b). Among the 117 authors included (with more than 5 papers), three Italian authors, Bardelli A, Siravegna G, and Siena S, demonstrate close collaboration. Similarly, Yoshino T and Nakamura Y exhibit strong collaboration in Japan. In terms of author co-citation analysis, a total of 104 authors with at least 50 citations were included (Fig. 6c). The top 3 authors identified were Tie J, Diehl F, and Siravegna G. The visualization also reveals a complex network of collaborations and citations among authors, indicating a highly interconnected research community. The temporal distribution of publications and citations shows that the field has evolved significantly over the years, with emerging trends and shifting research focus. The data highlights the dynamic nature of research in this field and the important contributions of these leading authors.
Fig. 6
(a) Plot of the top 10 prolific authors in this field from 2013–2024. (b) Author co-authorship analysis by VOSviewer. (c) Author co-citation analysis by VOSviewer. (d) The annual number of local citations of the top 15 most cited references. The size and colors of the circle present the cited times. (e) Co-citation of cited reference analysis by VOSviewer
2.5 References and co-cited referencesWe used bibliometrix to analyze the specific information of the top cited references in this field. Supplementary Table 5 listed the top 15 most co-cited references of ctDNA; they merely determined its detectability. However, this study successfully applied a highly sensitive approach to quantify ctDNA levels precisely [6]. Consequently, it became feasible to detect and quantify them with the necessary sensitivity for meaningful clinical application. The article by Bettegowda et al. (2014), published in Science Translational Medicine, stands out as the most frequently cited. The top five cited references were Bettegowda et al. (2014; 327 citations) [5], Diehl et al. (2008; 235 citations) [6], Tie et al. (2016; 219 citations) [12], Misale et al. (2012; 185 citations) [19], and Siravegna et al. (2015; 185 citations) [20]. The numbers of local citations per year for the top 15 references were further presented in Fig. 6d. 14 out of the 15 top references were published between 2012 and 2019, with the exception of one that was published in 2008. The pioneering research conducted in 2008 was carried out by Diehl F and his colleagues, and it was published in Nature Medicine. Prior to this study, most of the earlier research had not utilized techniques sensitive enough to detect the low levels paper. This paper was one of the foundational works within the ctDNA field, validating the feasibility of ctDNA detection across various types of tumors [5]. The third most locally cited paper was “Circulating tumor DNA analysis detects minimal residual disease and predicts recurrence in patients with stage II colon cancer” by Tie et al. (2016), also published in Science Translational Medicine. This study demonstrated that ctDNA detection post-resection of stage II colon cancer provides direct evidence of residual disease and identifies patients at high risk of recurrence [12]. The fourth most locally cited paper was “Emergence of KRAS mutations and acquired resistance to anti-EGFR therapy in colorectal cancer” by Misale et al. (2012), published in Nature. The findings revealed KRAS mutations as common catalysts for acquired resistance to cetuximab in colorectal cancers. They suggested that the detection of KRAS mutant clones non-invasively through ctDNA in the plasma could occur months prior to radiographic progression. The fifth most locally cited paper was “Clonal evolution and resistance to EGFR blockade in the blood of CRC patients” by Siravegna et al. (2015), published in Nature Medicine, with 185 local citations and 652 global citations. This paper utilized ctDNA to genotype colorectal tumors and track clonal evolution during treatment with cetuximab or panitumumab [20].
Subsequently, we performed reference co-citation analysis using VOSviewer, focusing on 261 references with a minimum citation threshold of 20. As illustrated in Fig. 6e, the network grouped all included references into three clusters, with larger node sizes indicating higher citation rates. Notably, Bettegowda et al. (2014) was once again central in the map, underscoring its significance. Prospective cohort studies examining the association of ctDNA with recurrence by Tie J or Reinert T were categorized in the blue group, indicating their strong correlation. Meanwhile, studies investigating the detection of acquired resistance to anti-EGFR therapy by Siravegna or Misale were classified in the green group.
2.6 Analysis of keywordsTo analyze the focal points in this field, a keyword co-occurrence network map was generated using VOSviewer. Out of a total of 2045 keywords, 85 were selected based on an occurrence frequency threshold of more than 20. Among these, the top 5 most frequently occurring keywords, excluding the search terms, were “liquid biopsy” (n = 255), “acquired-resistance” (n = 162), “plasma” (n = 136), “mutations” (n = 109), and “kras” (n = 92). Using VOSviewer’s clustering function, all keywords were categorized into 5 clusters represented by different colors. In Fig. 7a, the three main clusters of keywords in this field were highlighted.
Fig. 7
(a) The network visualization of co-occurrence analysis of keywords. (b) The overlay visualization of co-occurrence analysis of keywords. (c) Top 40 keywords ith the strongest citation bursts by CiteSpace
Cluster 1 comprised 33 keywords, including “liquid biopsy”, “circulating tumor cells”, “plasma DNA”, “droplet digital PCR”, “DNA methylation” and “diagnosis” among others. Cluster 1 mainly focused on ctDNA as a method of liquid biopsy, which can diagnose through DNA in plasma, and some research also compared it with similar methods such as CTCs (circulating tumor cells) [5, 21]. With the advancement of technology, new techniques were used for ctDNA detection. On one hand, the new PCR technique, ddPCR (droplet digital PCR), enabled absolute quantification of targets, thereby significantly enhancing the sensitivity and accuracy of detection [22, 23]. On the other hand, ctDNA methylation modification, rather than the sequence of ctDNA itself, has been proposed as an alternative biomarker due to its reliability and effectiveness in detecting molecular residual disease and recurrence [24].
Cluster 2 contained 20 keywords, such as “metastatic colorectal cancer”, “acquired-resistance”, “heterogeneity”, “mutations”, “ras”, “braf” and “egfr blockade”. Cluster 2 primarily focused on identifying resistance mutations that emerged when patients with CRC initially responded to therapy and then showed progression. These patients had metastatic CRC resistant to EGFR blockade due to acquired mutations in KRAS, NRAS, and BRAF [5]. In contrast to the analysis of tumor biopsy samples, which were invasive to obtain and often did not fully capture tumor heterogeneity and evolution, the analysis of ctDNA provided a non-invasive method to the need for molecular diagnosis at baseline, particularly in patients who lacked obtainable tumor tissue [25, 26].
Cluster 3 consisted of 29 items, such as “minimal residual disease”, “adjuvant chemotherapy”, “surgery”, “recurrence”, “early detection”, “survival”, and “prognosis”. Cluster 3 focused on the role of ctDNA in indicating the presence of micro-metastases after definitive surgical resection, which could act as an early warning for persistent and or recurrent malignancy before it became clinically apparent. MRD, minimal residual disease, persisted after primary malignant tumor treatment and was considered the origin of tumor recurrence. Due to the small number of tumor cells, these minute lesions were difficult to detect through traditional imaging and laboratory methods. With a short half-life and high detection sensitivity, ctDNA may indicate micro-metastases undetectable by imaging. The postsurgical status of ctDNA emerged as a highly significant prognostic biomarker compared to the high-risk clinicopathological features commonly utilized. It had the potential to predict the benefit of adjuvant chemotherapy, thus avoiding unnecessary chemotherapy exposure for patients. Studies indicate that ALU-based cell-free DNA (cfDNA) is a promising non-invasive tool for colorectal cancer (CRC) diagnosis and prognosis [27]. Moreover, ctDNA detection can be linked to surrogate endpoints such as Overall Survival (OS), Disease-Free Survival (DFS), Cancer-Specific Survival (CSS), and Recurrence-Free Survival (RFS) outlined in the DATECAN initiative’s standardized definitions for time-to-event (TTE) endpoints in colorectal cancer (CRC). By incorporating these endpoints, the role of ctDNA in the context of CRC treatment and prognosis can be better understood and evaluated. Given the critical importance of survival and prognosis in CRC patient management, the focus on metrics like OS, DFS, CSS, and RFS is essential for improving patient outcomes.
Furthermore, an overlay visualization map illustrated the years in which each keyword appeared. Figure 7b revealed that Cluster 3 encompassed the most recent keywords, notably “adjuvant chemotherapy” and “recurrence”. Despite the unequivocal establishment of the benefit of adjuvant chemotherapy for patients with stage III colon cancer, its efficacy for patients with stage II disease remained a subject of debate. Recent studies revealed that a ctDNA-guided approach to treating stage II colon cancer reduced the utilization of adjuvant chemotherapy without compromising recurrence-free survival [10, 28]. Additionally, 40 keywords with significant citation bursts were identified using CiteSpace in Fig. 7c. Keywords related to acquired resistance and heterogeneity analysis, such as “kras mutations” and “egfr blockade,” were prominently featured at the outset of this field and were the focal points from 2013 to 2018. However, after 2020, attention shifted towards ctDNA as a significant risk factor for recurrence. The field has transitioned from exploratory studies to clinical practice, where ctDNA guides decision-making.
2.7 Summarize Sankey diagram analysisFigure 8 displays a Sankey diagram-based three-field plot illustrating the connections between countries, institutions, and journals. The height of the rectangle nodes corresponds to the frequency of occurrence of a particular country, institution, or journal within the collaboration network, while the width of the lines between nodes reflects the number of connections. Upon considering only the top 10 institutions and top 20 journals, the USA emerges as the country with the most connections, linked to all of the top 10 institutions. Following the USA are Italy, Japan and Denmark. The University of Texas MD Anderson Cancer Center stands out as the sole institution in the USA within the top 10 rankings, yet it actively collaborates with nearly all of the top 10 countries, positioning it as a central hub in this field. Researchers from the USA, Italy, and Japan have published a substantial portion of their work in the top 20 journals. In contrast, France, Germany, and China have fewer publications in these top journals.
Fig. 8
Sankey diagram shows the network between Institutions (left), Countries (middle), Journals (right) of the publications in this field
Comments (0)