
Remember me


In order to identify potential immunotherapy targets against MM, we used a large dataset of RNA-sequencing from CD138+ sorted patient samples comprising of 837 newly diagnosed (ND) and relapsed/refractory (RR) samples from the MMRF CoMMpass dataset (MMRF) and 94 samples from the Indiana Myeloma Registry (IU dataset), plus eight normal bone marrow plasma cell samples (normal dataset) (Table 1). After data pre-processing, 19,892 protein-coding genes were annotated using five databases for cell surface potential. Those genes that encode proteins annotated with cell surface potential in \(\ge\) three of those databases were taken further (n = 845). Another 88 protein coding genes were added from proteomic studies where they were detected on the surface of MM cells [36], resulting in a total of 933 genes (Fig. 1A).
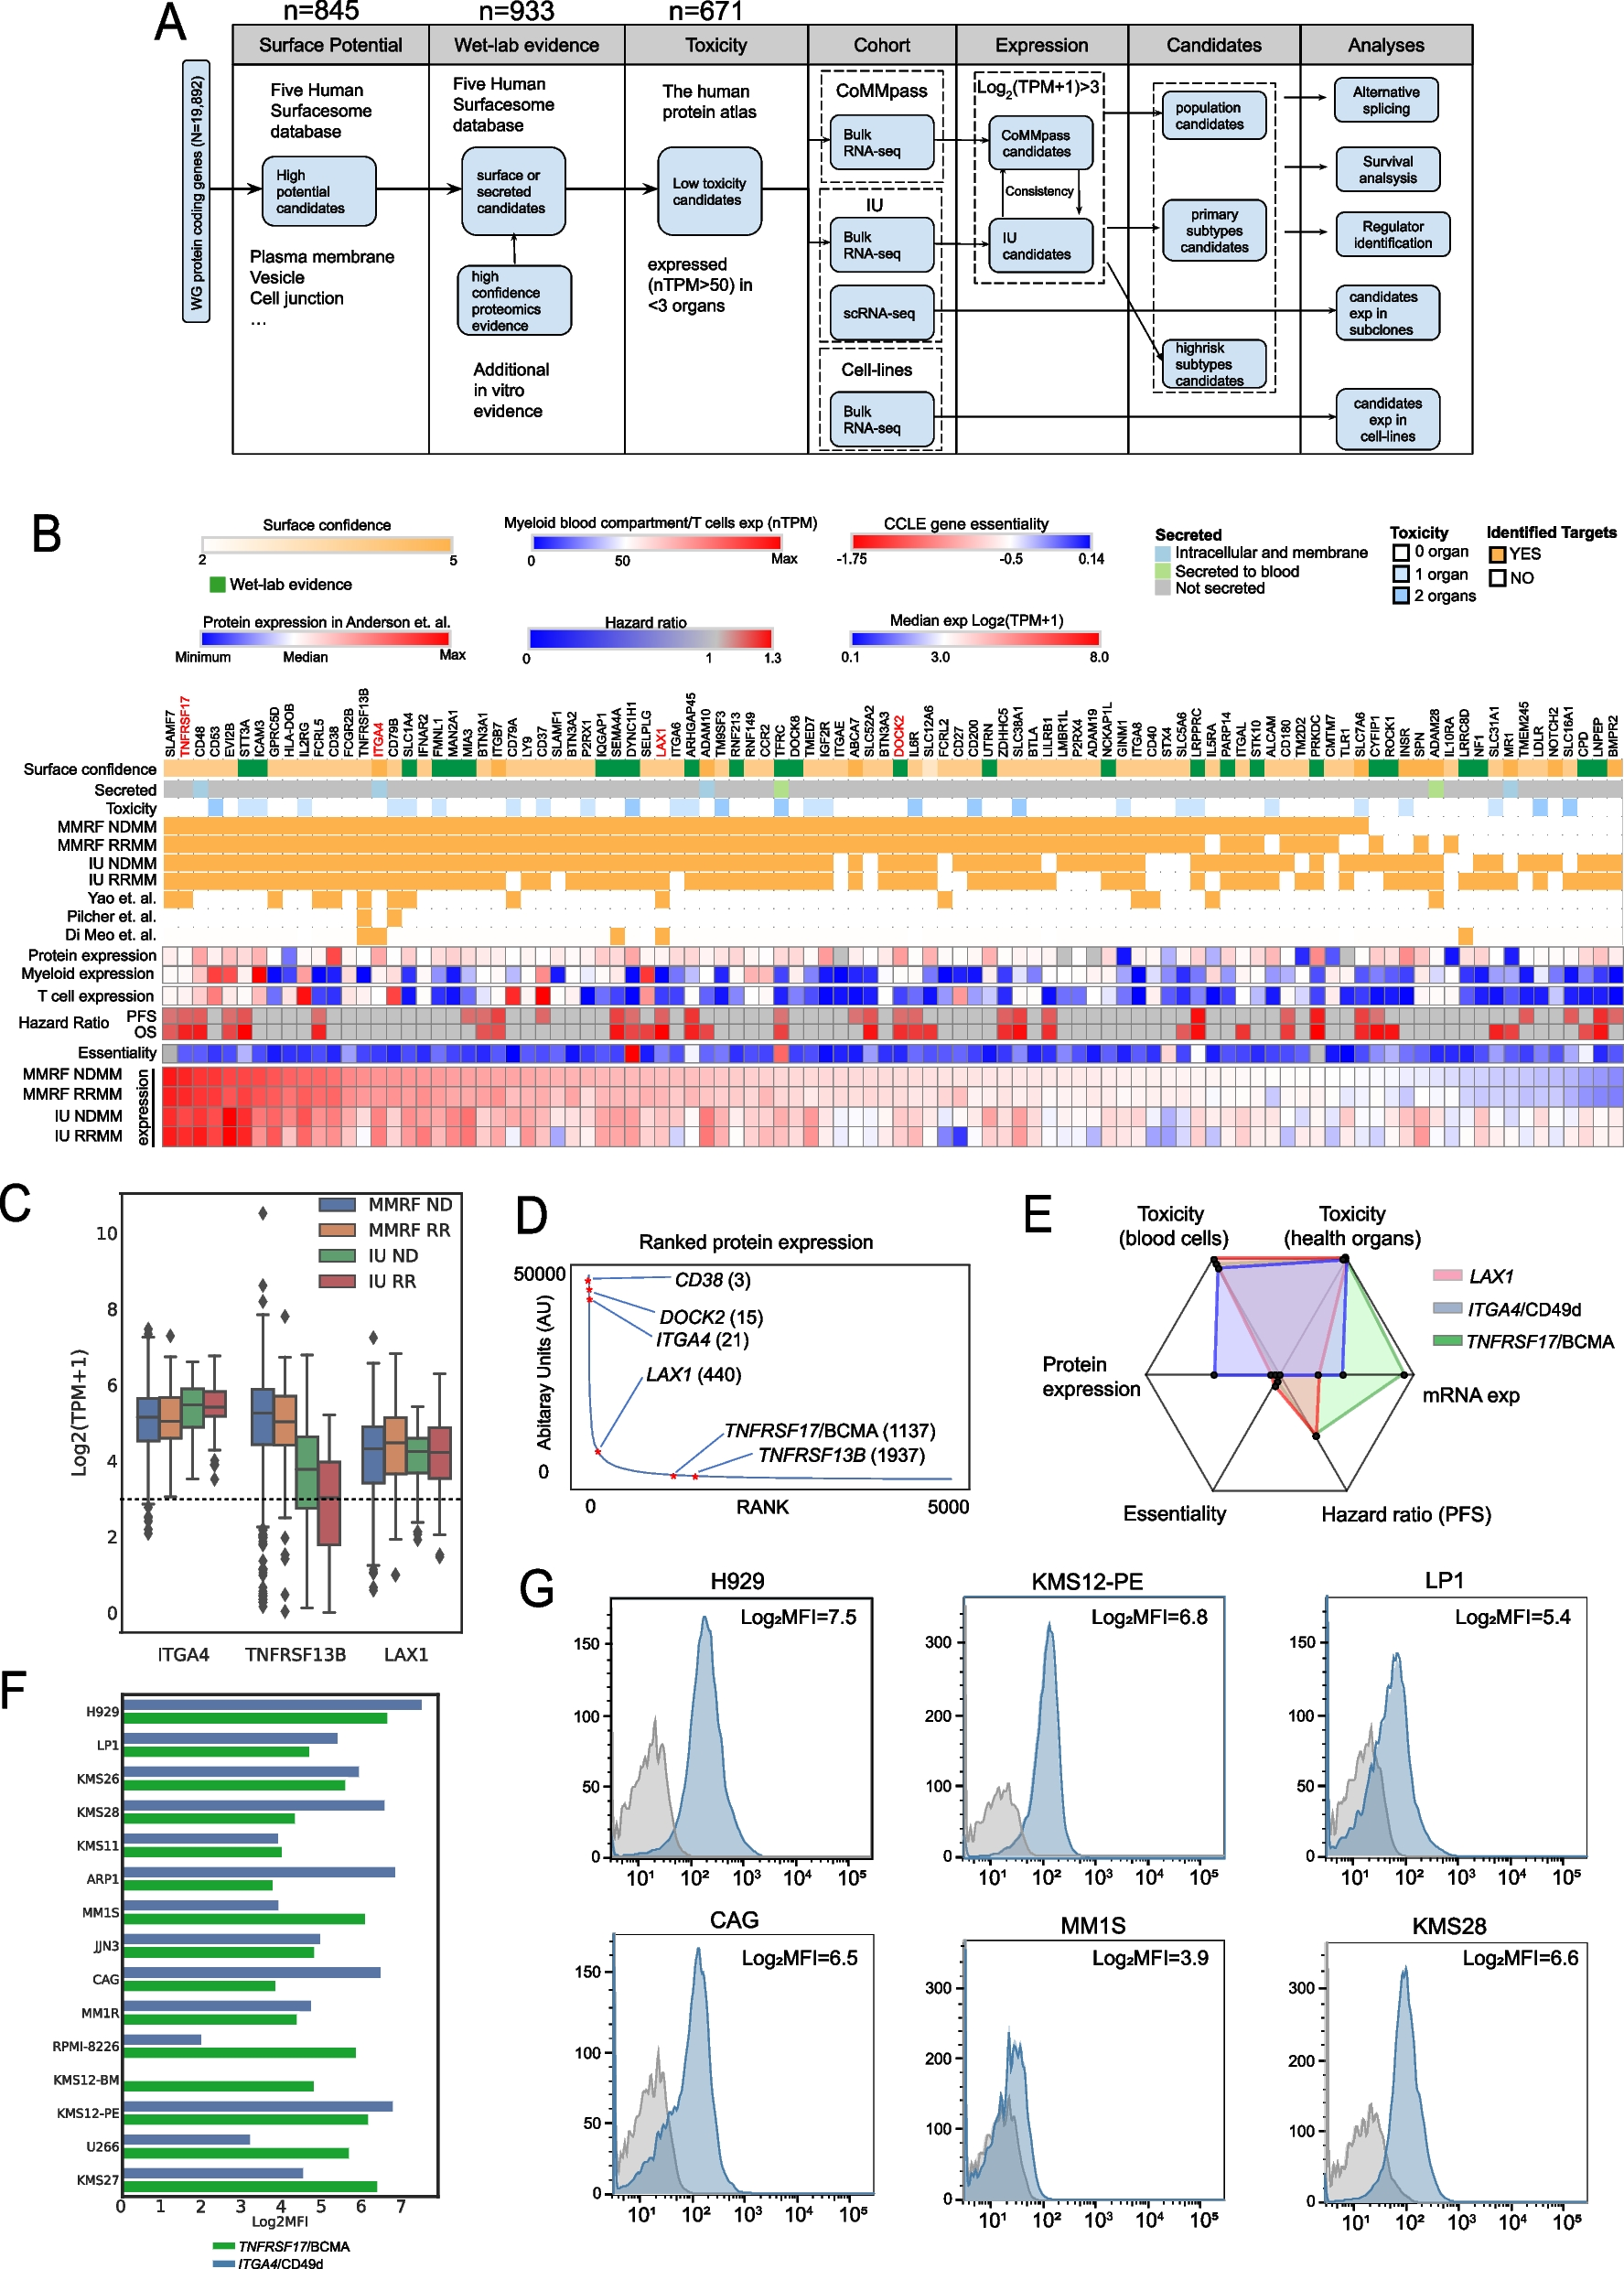
Fig. 1
Characteristics of candidate targets identified in ND and RR populations from two independent datasets. A General workflow of the target identification process. B A heatmap demonstrating all identified candidate genes in ND and RR population from MMRF and IU datasets with various annotations. C Expression level of selected genes. D Ranked expression of 5,092 proteins documented in Anderson et al. [36]. Numbers after gene names: rank. E A radar plot summarizing key characteristics among LAX1, ITGA4, and TNFRSF17/BCMA. Range (from center to edge): toxicity (healthy organs): 2~0; toxicity (blood cells): 0~1845; protein exp: 24.8~37221.6; essentiality: 0~ −1.75; hazard ratio (PFS): 1~1.28; mRNA exp: 3~7.6. Range in toxicity, protein expression, essentiality, hazard ratio, and mRNA exp indicated lowest to highest among 98 candidate genes. F Log2-scaled median fluorescence intensity (MFI) of TNFRSF17/BCMA and ITGA4/CD49d detected by flow cytometry in 15 MM cell lines. G Density plots indicating MFI (blue peaks) of ITGA4/CD49d compared to the isotype control (grey peaks) across 6 MM cell lines. Log2MFI: Log2-scaled MFI. Highlighted genes in B: well-established targets or novel targets found in this study and validated by flow cytometry
To reduce potential toxicities from off-target effects, these 933 genes were further filtered based on their expression in normal organs from the Human Protein Atlas. After examining the expression of several existing CAR-T/immunotherapy targets in MM and other blood cancers (Additional file 1: Fig. S1), we established a threshold of nTPM > 50 in no more than two essential organs. Such criterion effectively encompassed all known targets while maintaining specificity to reduce off-target risks. The last filter applied was based on gene expression in patient MM cells (log2(TPM + 1) > 3). This threshold was integrated into the selection process, which resulted in 98 candidate genes (Additional file 1:Fig. S1).
Of those 98 candidate genes, 74 were expressed at log2(TPM + 1) > 3 in both datasets (Fig. 1B) and 88 (91.7%) were consistently expressed in both newly diagnosed and relapsed samples. Approved immunotherapy targets ranked highly by their RNA expression level including SLAMF7 (rank 1 in MMRF newly diagnosed MM), TNFRSF17/BCMA (rank 2), GPRC5D (rank 8), FCRL5 (rank 11), and CD38 (rank 12), and were identified in all datasets and disease stages. Recently reported novel targets [8] such as CD48 [37] (rank 3), CD53 [38] (rank 4), EVI2B/CD361 [38] (rank 5), CD79A/B [39] (rank 16 & 24), SEMA4A [8] (rank 31), and LILRB4/ILT3 [9] (rank 60) were also identified using this methodology. Other previously identified targets such as STT3A [40] (rank 6) and ICAM3 [41] (rank 7) were not annotated as membrane proteins in public databases but were rescued by our methodology as they had been detected as cell surface proteins in proteomic experiments [8]. An additional level of complexity is reflected in the differences between RNA and protein expression levels (r < 0.3, Spearman correlation) (Additional file 2: Table S2), showing the need for matched RNA and protein level data in the same samples to utilize existing genomic data more effectively.
Clinical evidence suggests that maintaining a basic level of immunity may reduce infection-induced mortality in myeloma patients [41, 42]. To this end, we further examined the expression of targets in myeloid cells and found that their expression level varied (Fig. 1B and Additional file 1:Fig. S1). GPRC5D and FCRL5 had minimal expression in myeloid cells, SLAMF7/CD319 and TNFRSF17/BCMA had moderate expression, whereas CD53, CD48, and EVI2B exhibited the highest expression.
Forty candidate genes were found to have significant associations with either progression-free survival (PFS) or overall survival (OS) in the MMRF newly diagnosed dataset (Fig. 1B), including 25 genes that were associated with both (Additional file 2: Table S2). This included established targets such as TNFRSF17/BCMA as well as novel targets such as LAX1, ITGA4, DOCK2, and TNFRSF13B/TACI (Fig. 1C, D, Additional file 1: Fig. S2). CD27 has also been targeted together with CD70 in bispecific therapies in solid tumors and AML [43,44,45].
LAX1 encodes a lymphocyte transmembrane adaptor protein involved in B cell activation, which had high mRNA (Fig. 1C) and protein expression (440th, Fig. 1D) across samples. Its expression showed significant association with both PFS and OS (Hazard ratio (HR) = 1.2 and 1.3, p = 0.01 and p < 0.005, Fig. 1B and Additional file 1: Fig. S2). DOCK2 encodes the dedicator of cytokinesis 2 protein and was previously detected as one of the top-ranked expression proteins (15th, Fig. 1D). Expression of both proteins was observed in flow cytometry experiments with permeabilization but not in experiments without permeabilization, indicating potential reagent or accessibility problems. To corroborate these findings, immunoblotting was performed, which demonstrated expression in most of the cell lines (Additional file 1: Fig. S2). ITGA4 encodes a subunit of integrin alpha 4 chain found at the surface of immune cells and plays a crucial role in cell adhesion and migration. Several FDA-approved immunotherapies target it in autoimmune diseases such as ulcerative colitis [46], showing its accessibility as a target. Compared to BCMA, ITGA4 had higher expression at the proteomic level, low toxicity, and low off-target effect (Fig. 1E). Moreover, flow cytometry experiments suggested that ITGA4/CD49d was accessible and highly expressed across most of the MM cell lines, even compared to TNFRSF17/BCMA (Fig. 1F, G).
Identifying targets essential for MM cell survivalDespite the effectiveness of immunotherapy in treating MM patients, eventually tumor cells can mutate or delete the epitopes in the targets, resulting in relapse. Current immunotherapy targets are not essential for MM cell growth, but it may be possible to identify targets that are essential for growth, thereby limiting tumor intrinsic resistance mechanisms. Six of the 98 identified genes (DYNC1H1, ARHGAP45, TFRC, STX4, LRPPRC, and CPD) demonstrated significant essentiality (median CERES [47] gene effect score \(\le\)−0.5) in 18 MM cell lines, of which three (DYNC1H1, TFRC and LRPPRC) were significantly associated with patient survival (Fig. 1B). Many of the encoded proteins are likely to only be associated with the cell membrane, or not have domains that extend into the extracellular space. The exception was TFRC, the transferrin receptor, which had high essentiality (median CERES < −1), is involved with iron intake, its expression was previously reported to be associated with disease progression in MM [48], and it has been reported as a potential target in hematological malignancies [49]. TFRC expression was significantly associated with patient survival (Additional file 1: Fig. S3), was expressed (nTPM > 50) in one off-target organ (ovary) and was not expressed in myeloid cells (Additional file 1: Fig. S3) suggesting its potential as a candidate with low side-effects. However, others have reported that TFRC expression is not specific to plasma cells [50]. Our findings suggest that, besides their oncogenic roles in MM cells, these essential genes encoding cell surface proteins could be targeted by immunotherapies, but largely cell surface proteins are not essential for survival of MM cells.
Heterogeneity of immunotherapy target expression in MM subgroupsGiven that we know MM is a heterogeneous disease driven by primary genomic abnormalities, we utilized expression of the 98 genes as features and conducted clustering analysis for all samples in the two datasets (Fig. 2A). A clear segregation among t(11;14), t(4;14), t(14;16), t(14;20), and non-translocated subgroups was observed, indicating heterogeneity of candidate target gene expression. However, no clear segregation was observed between ND and RR timepoints, and so these were merged in subsequent analyses.
Fig. 2
Characteristics of genes identified from primary subtypes. A UMAP plot indicating the expression heterogeneity of 98 population-based candidate targets among five primary subtypes. B A heatmap demonstrating all identified candidate genes from primary subtypes. C A Venn diagram indicating the common/unique candidate targets among primary subtypes. D Expression level of selected candidate targets uniquely/highly expressed in certain subtypes. E Protein expression of CD109 was detected in RPMI-8226 (t(14;16)) but not in KMS27 (t(11;14)) cell line. F Protein expression of ROBO3 and TNFRSF17/BCMA in t(4;14) (orange), t(14;16) (green), and t(11;14) (blue) cell lines. Statistical tests in D: Mann-Whitney U test; Significance level: *p < 0.05; **p < 0.01, ***p < 0.001
Samples were annotated with their primary genomic events, and the same target selection process was performed on each subgroup, including subgroup specific expression, dependency, and outcome (Fig. 1A). The subgroup analysis identified 120 candidate target genes (Fig. 2B, C, Additional file 1: Fig. S4 and Additional file 2: Table S3). Among them, 22 genes were only identified in the subgroup analysis, indicating the advantage of using a subgroup approach. Over half (67/120) of the candidate target genes were expressed across all subgroups and included the established pan-MM candidates such as TNFRSF17/BCMA, SLAMF7, GPRC5D, CD38, and FCRL5, as well as novel targets such as LAX1, ITGA4, and TNFRSF13B (TACI) (Fig. 2B, C).
A total of 21 candidate targets were only expressed above the cut-off within a subtype. Most unique candidates were found in the t(MAF) (t(14;16) or t(14;20)) subgroups (N = 13) followed by the t(11;14) subgroup (N = 4) (Fig. 2B, C). Although ITGB7 was identified as a pan-myeloma candidate, as previously noted [51], it was expressed at much higher levels in the t(MAF) subgroups (Fig. 2B) and has been identified as a CAR-T cell target [52]. Similarly, CD79A and CD20/MS4A1 had higher expression in the t(11;14) subgroup and have been used as immunotherapeutic targets in other hematological malignancies [53, 54]. Other subgroup-specific genes have also been identified as encoding immunotherapy targets in other diseases, including LILRB4 (t(MAF)-specific) which was recently established as a novel CAR-T target in AML [55]. CLEC7A (MAF-specific) [56], CD86 (t(14;16)-specific) [57], and CD28 (t(MAF)-specific) [58] have been applied as CAR-T targets in solid tumors.
Heterogeneity of expression between patient samples and cell lines was also observed, even for established targets (Additional file 1: Fig. S4). For instance, FCRL5, EVI2B, and CD27 had significantly higher RNA expression (Log2FC = 4.3, 3.9, 2.5, p = 3 × 10⁻¹², 2 × 10⁻¹², 4 × 10⁻⁸, respectively) in patient samples than in cell lines, while CD70, which was a partner of CD27 in bispecific therapies [43,44,45], showed a significantly higher expression in cell lines (Log2FC = 3.7, p = 3 × 10⁻¹¹). Meanwhile, genes such as ARHGAP45 and TNFRSF17 showed no significant difference in expression, suggesting a more uniform expression of these genes in different models.
Of the 120 candidate targets identified at the subgroup level, 23 demonstrated significant associations between expression and both PFS and OS (Additional file 2: Table S3). High expression of one (LAIR1 in the MAF subgroup) was associated with a good prognosis, and the others were associated with a poor prognosis. 19 candidate targets showed an association with outcome in only one subtype, indicating their subtype specificity. For example, CD180 was significantly associated with inferior PFS and OS only in the hyperdiploid subtype (HR = 1.2 and 1.3, p = 0.01 and p = 0.02, respectively, Additional file 1: Fig. S5), indicating its potential specificity in maintaining hyperdiploid cell proliferation. This gene encodes a component of the cell surface receptor complex RP105/MD-1 [59], which is associated with hematological malignancies [60]. It has low expression in normal tissues and blood cells (Additional file 1: Fig. S5) suggesting its validity as a candidate.
We speculated that t(14;16)/t(14;20)-specific genes were uniquely regulated by their master regulator MAF/MAFB and therefore analyzed existing ChIP-seq data of MAF/MAFB binding sites [32]. Four of the t(MAF)-specific candidate targets were found to have MAF binding sites (Additional file 1: Fig. S5), including at the promoter region of ITGB7 and CD109 (Additional file 1: Fig. S5). The former has been well-documented as over-expressed in the t(MAF) subgroup and as a target of MAF transcription families [61], while the latter was found to be expressed in solid tumors [62]. Moreover, CD109 encodes a glycoprotein on the surface of platelets and was solely expressed in the t(14;16) subgroup (Fig. 2D), and its expression in healthy organs and blood cells was minimal (Additional file 1: Fig. S5). We utilized flow cytometry to test if CD109 was dominantly expressed in t(14;16) and/or t(11;14) cell lines and found that it showed expression in t(14;16) and t(4;14) cell lines (especially in RPMI-8226), but not in t(11;14) cell lines (Log2FC = 3.8, p = 0.03, one-sided Mann–Whitney U test, Fig. 2E, F, Additional file 1: Fig. S5).
Other notable subtype-specific candidate targets included ROBO3. This gene was selected due to its specific expression in t(4;14) subgroups (Log2FC > 2, p < 1 × 10⁻⁸, MMRF dataset, Fig. 2D) and its minimal expression in healthy organs and blood cells (Additional file 1: Fig. S5). Flow cytometry validated the expression of ROBO3 in several t(4;14) and t(14;16) cell lines and lack of expression in other cell lines (Log2FC = 1.3, p = 0.17, one-sided Mann–Whitney U test, Fig. 2F). Additionally, CD48 had been identified as a common candidate across all cytogenetic groups, but its expression was significantly higher in the t(4;14) subtype (Log2FC > 0.3, p < 0.0009, MMRF dataset, Fig. 2D). Higher expression plus low toxicity (Additional file 1: Fig. S5) makes CD48 a valid candidate for further exploration.
High-risk subtypes are associated with higher expression of specific targets, including GPRC5DHigh-risk secondary events such as 1q gain/amplification and biallelic TP53 inactivation have been highly associated with inferior survival [63], disease progression/relapse [63], and therapy resistance [64]. To evaluate novel targets in these high-risk subgroups, we identified candidate genes in samples with 1q gain or amplification, TP53 abnormalities, and established high-risk expression subgroups (PR/MF/MS) [48]. In total, 125 candidate targets were identified (Fig. 3A and Additional file 2:Table S4), most of which overlapped with the previously identified genes.
Fig. 3
Characteristics of candidate targets identified from high-risk subtypes. A Identified candidate targets for high-risk subtypes. B Four candidate genes demonstrating significantly elevated expression levels along with 1q copy number gain in the MMRF dataset. C A network plot indicating potential regulators of SELPLG, SPN, and GPRC5D found on 1q. D Three candidate genes demonstrating heterogenous expression among biallelic (-/-), monoallelic (+/-) and wild type (WT) TP53 subgroups in the MMRF dataset. E Three candidate genes exhibiting heterogenous expression in TP53 knock-out and WT triplicates of the AMO1 cell line. Protein expression of ADAM28 detected in TP53 wild-type (F) and knockout (G) AMO1 cell line measured by flow cytometry. Statistical test in boxplots: Mann-Whitney U test in B and D, T-test in E. Significance level: *p < 0.05, **p < 0.01, ***p < 0.001. PR/MF/MS: three of the seven expression subgroups defined as high-risk [26]
Since high-risk patients have been shown to develop a PR expression signature over time, they are an interesting group to identify therapeutic targets [12, 65]. Three unique genes were found in the PR subgroup: CD300A, F2R, and PTPRG. CD300A was identified in the MMRF dataset, while the other two were identified in the IU dataset. The three candidates showed minimal expression in healthy organs, and PTPRG and F2R also had minimal expression in all blood cells (Additional file 1: Fig. S6).
Several candidate targets had higher expression in samples with gain/amp1q (Fig. 3B) including GPRC5D, SELPLG, SPN, and IL6R. GPRC5D, an established target in CAR-T therapy against MM [66], showed increased expression along with 1q gain in both the MMRF (1q WT vs. 1q gain, Log2FC = 0.7, p = 7 × 10⁻⁸; 1q gain vs. 1q amp, Log2FC = 0.8, p = 1 × 10⁻³, Fig. 3B) and the IU datasets (Additional file 1: Fig. S7). SELPLG (1q WT vs. 1q gain, Log2FC = 0.6, p = 7 × 10⁻⁸; 1q gain vs. 1q amp, Log2FC = 0.6, p = 6 × 10⁻⁴) and SPN (1q WT vs. 1q gain, Log2FC = 1.2, p = 4 × 10⁻³; 1q gain vs. 1q amp, Log2FC = 1.2, p = 2 × 10⁻⁵) encode glycoproteins that can lead to activation of T cells [67]. IL6R is located on 1q and encodes the receptor of interleukin 6, which is a growth factor of MM cells [68]. There was a step-wise increase in expression of IL6R with copy number gain (1q WT vs. 1q gain, Log2FC = 0.9, p = 2 × 10⁻¹⁹; 1q gain vs. 1q amp, Log2FC = 0.9, p = 5 × 10⁻⁶) indicating a gene dosage effect.
The other three genes upregulated with gain/amp1q were not located on 1q thus their elevated expression might be due to potential regulators present on 1q. Hence, we conducted a transcription factor-target analysis to infer the potential transcription factor(s) or epigenetic modifier(s) that could control expression of these genes. Among 1629 human transcription factors [59], 55 were located on 1q. Three transcription factors had a high correlation of expression with GPRC5D, SELPLG, and SPN which included ARNT (Spearman correlation \(\rho\) = 0.21, 0.25 and 0.33, rank: 9th, 10th and 4th, vs. GPRC5D, SELPLG and SPN, respectively), ATF6 (\(\rho\) = 0.25, 0.36, and 0.42, rank: 7th, 3rd and 1 st) and GLMP (\(\rho\) = 0.32, 0.45, and 0.25, rank: 1 st, 1 st, and 12th) (Fig. 3C, Additional file 1: Fig. S7). ARNT and ATF6 had documented binding sites on SELPLG and SPN [59]. Additionally, PBX1 was recently found to be associated with 1q gains and tumor progression [16], although its correlation was not among the highest (\(\rho\)=0.15, 0.20 and 0.24, rank: 18th, 13th, and 13th, Additional file 1: Fig. S7).
Biallelic TP53 is arguably the most important genomic risk factor in MM [63]. To test if any gene was significantly upregulated in biallelic TP53 compared to WT groups, we compared their expression and identified 12 genes, including ADAM28 (Log2FC = 0.5, p = 0.04, one-sided Mann–Whitney U test) and CD37 (Log2FC = 0.4, p = 0.05) in the MMRF dataset (Fig. 3D).
Using existing expression data from isogenic AMO1 MM cells, where TP53 had been knocked out (KO) by CRISPR/Cas9, ADAM28 and CD37 were expressed at significantly higher levels in TP53 KO compared to WT cells (Log2FC = 1.4 and 0.8, p = 0.006 and p = 0.004, one-sided T-test; expression values were not significantly different from a normal distribution, K-S test; Fig. 3E). To determine if this effect was recapitulated at the protein level, we generated a TP53 KO using the AMO1 cell line (absence of p53 confirmed by Western blotting, Additional file 1: Fig. S7) and measured protein expression by flow cytometry. We validated ADAM28 and confirmed its increased expression on the cell surface of TP53 KO AMO1 cells compared to WT AMO1 (Log2MFI = 6.0, Log2FC = 3.7) (Fig. 3F, G). ADAM28 is a member of the metalloproteinase-type A disintegrin and metalloproteinases (ADAMs) family and previously found to be upregulated in various cancers to promote cell proliferation, migration, and invasion [69]. This is a prime example of how integration of patient data with experimental models can be used to identify and validate potential future immunotherapy targets, especially in high-risk disease.
Heterogeneous expression of candidate targets among subclonesTo explore the expression of targets across all cells within a patient, we utilized scRNA-seq data to examine subclones within samples (Fig. 4A, Additional file 1: Fig. S8). Single-cell data was clustered, allowing the expression of targets to be measured as a proportion of each patient. Several population-level candidate genes were ubiquitously expressed, including TNFRSF17/BCMA (94% of patients) and SLAMF7 (93%, Additional file 1: Fig. S8) as well as novel candidate genes including ITGA4 (100%, Fig. 4B) and LAX1 (92%, Additional file 1: Fig. S8). Other genes such as CD79A were preferentially expressed in more B-cell-like subtypes, including t(11;14) and hyperdiploid samples with 11q gain (26%, p = 0.04, hypergeometric test, Fig. 4C), reflecting inter-patient and subtype-specific expression heterogeneity of the identified genes.
Fig. 4
Candidate targets were heterogeneously expressed among subclones identified from scRNA-seq data. A Transcriptomic landscapes of 49 IU patient samples with single-cell RNA-seq data. B Expression of ITGA4 among 49 samples. C Expression of CD79A is increased in t(11;14) and hyperdiploid 11q+ samples. D Fourteen subclones identified by scRNA-seq in a relapsed t(4;14) sample. E Uneven expression of CD38 among 14 subclones. F Expression of CD38 among 14 subclones. Statistical test: Mann Whitney U test in (F): Log2(CPM+1). Significance level: *p < 0.05, **p < 0.01, ***p < 0.001
Intra-patient expression heterogeneity was seen, including a t(4;14) patient sample which was obtained after the second relapse and had undergone MM immunotherapy treatment including anti-BCMA (belantamab mafadotin), anti-CD319/SLAMF7 (elotuzumab) and anti-CD38 (daratumumab) therapies (Additional file 1: Fig. S8). When checking the expression level of t(4;14) genes among subclones, we observed cells expressing targets such as TNFRSF17/BCMA and SLAMF7/CD319 (Additional file 1: Fig. S8) indicating gene expression was not responsible for relapse. Other potential new targets were also expressed evenly across all subclones. However, some existing targets did not show good coverage over all subclones. For instance, even though CD38 was ubiquitously expressed across 49 patient samples (96%), its expression was significantly depleted in several subclones in the anti-CD38 treated sample (p < 0.001, Fig. 4D–F). Taken together, this indicated a mechanism of antigen escape in some subclones which could result in immune-therapy resistance.
Alternative splicing as a mechanism of antigen escapeAberrant RNA splicing was previously found in patient samples following CD19 CAR-T cell therapy, where loss of the epitope through alternative splicing was identified in B-ALL [7]. To investigate the possibility of this in MM, we performed alternative splicing (AS) analysis on the identified candidate targets both at the population and subgroup levels (Fig. 5A, Band Additional file 1: Fig. S9, Additional file 2: Table S5).
Fig. 5
Impact of aberrant splicing towards candidate target gene expression. Summary of most significant alternative splicing events identified from MMRF (A) and IU (B) cohort, respectively. C Sashimi plots indicate inclusion levels of a cryptic exon in FCRL5 in different samples.
Comments (0)