
Remember me

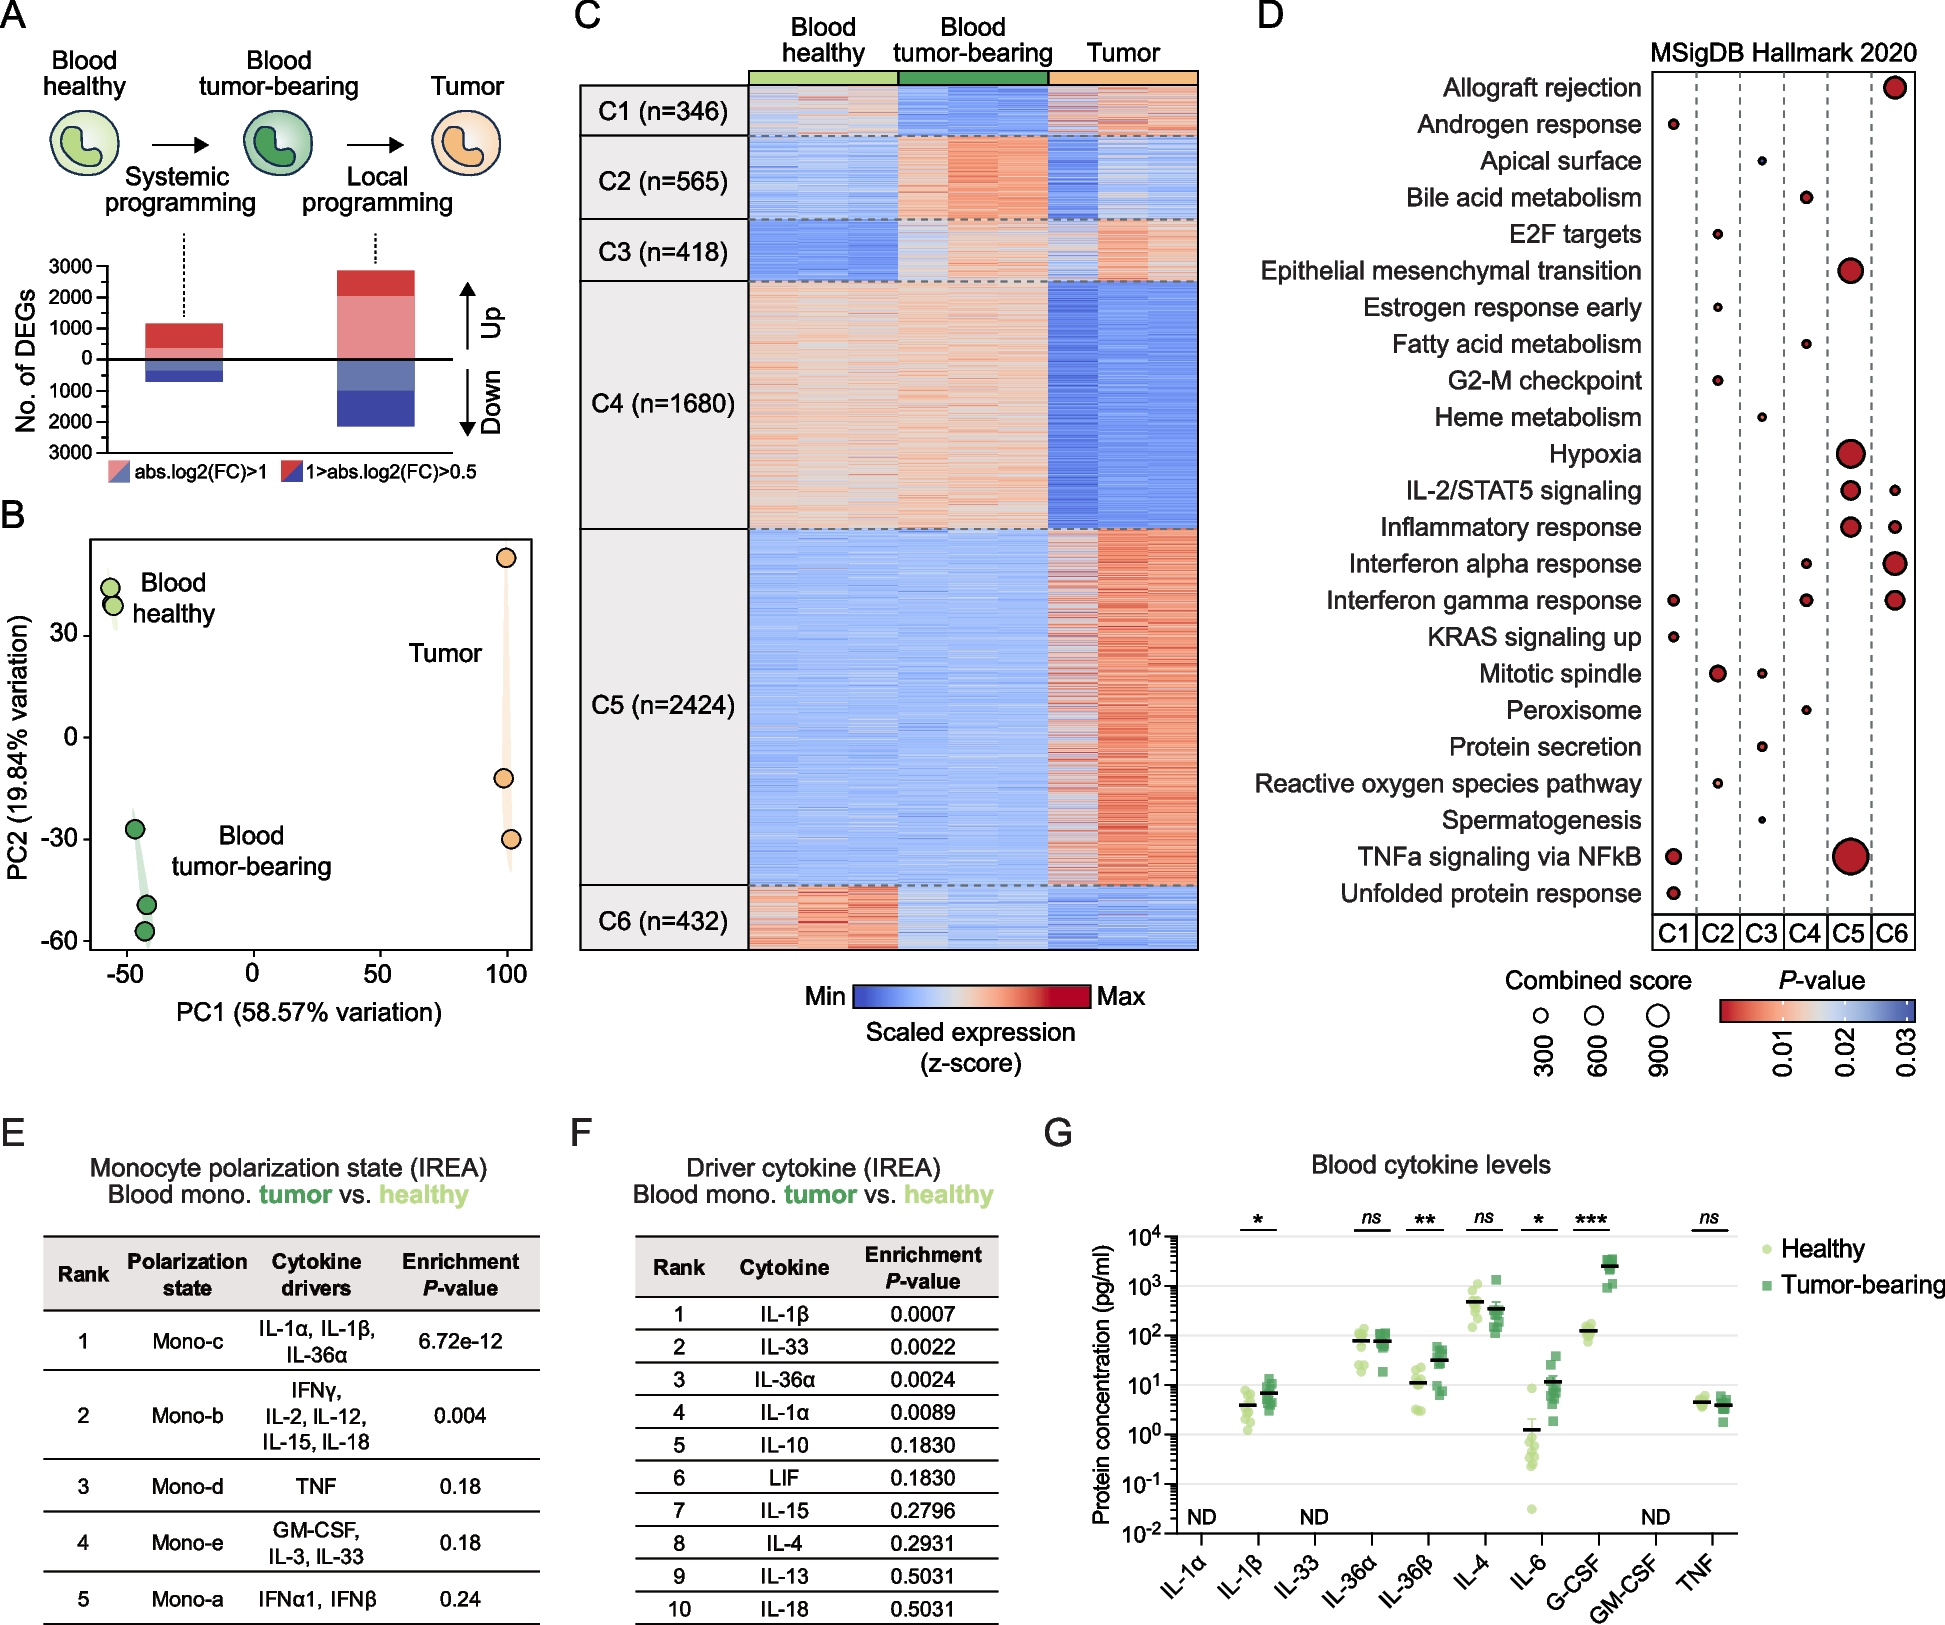


In order to determine potential links between peripheral alterations in monocytes and their local reprogramming in the tumor, we sought to identify genes whose expression was modulated by the tumor either in the periphery or upon tumor infiltration. To this end, we performed bulk RNA-sequencing on CD11bhi Ly6Chi Ly6G− MHC-II− classical monocytes isolated from the tumor and blood of Lewis lung carcinoma (LLC) tumor-bearing mice as well as from the blood of healthy syngeneic mice (Fig. 1A). The comparison between cells from genetically identical tumor-bearing and healthy mice allowed us to exclude the impact of genetic variation and precisely identify tumor-induced changes in the gene expression of peripheral monocytes (Fig. 1A). The LLC model was chosen as this tumor recruits a large number of monocytes which show immunosuppressive features [25]. Indeed, we observed that progressive LLC tumors increased systemic Ly6Chi monocyte levels and gradually accumulated large numbers of macrophages (Additional file 1: Fig. S1A, B).
Fig. 1
Tumor-induced systemic inflammation is associated with transcriptional preconditioning of peripheral monocytes. A Experimental scheme to examine peripheral and local programming of monocytes by the tumor and bar graphs showing the number of differentially expressed genes (DEGs) for the indicated comparisons, with different absolute log2(fold change) value thresholds. B Principal-component analysis of RNA-seq profiles of Ly6Chi monocytes sorted from the blood of healthy mice, blood of LLC tumor-bearing mice and LLC tumors (n = 3). C Heatmap showing genes that were differentially expressed in at least one comparison between different conditions (P < 0.05 and absolute log2[fold change] ≥ 0.5), and separated into six clusters by k-means clustering. D Enrichment of MSigDB Hallmark gene sets in the different gene expression clusters. Top 5 enriched gene sets are shown for each cluster based on combined score. E Table showing the enrichment of different monocyte polarization states when compared to the upregulated genes in peripheral monocytes from tumor-bearing mice (log2FC > 0.5, FDR < 0.05) we identified, determined by the Immune Response Enrichment Analysis (IREA) algorithm. F Table showing the enrichment of different cytokine-induced transcriptome profiles when compared to the upregulated genes in peripheral monocytes from tumor-bearing mice, determined by the Immune Response Enrichment Analysis (IREA) algorithm. G Plasma levels of different pro-inflammatory cytokines in LLC tumor-bearing and healthy mice (n = 9–10/group, unpaired t-test, *P < 0.05,**P < 0.01, ***P < 0.001; ns, not significant; ND, not detected)
We found that the transcriptome of tumor-infiltrating monocytes was very different from monocytes in the blood, while the tumor also induced distinct, albeit less pronounced, changes in the transcriptome of peripheral monocytes (Fig. 1A, B). A fraction of the differential genes in peripheral monocytes overlapped with differential transcripts previously identified in myeloid progenitors from tumor-bearing mice [37], suggesting that at least some of the transcriptomic changes in peripheral monocytes likely originated in monocyte precursors in the bone marrow (Additional file 1: Fig. S2, Additional file 2: Table S1).
Differentially expressed genes (P < 0.05 and absolute log2[fold change] ≥ 0.5) could be split into six major clusters with distinct gene expression patterns (Fig. 1C, Additional file 3: Table S2). This approach enabled us to identify two gene clusters (Clusters 3 and 6) whose expression was modulated in the periphery in tumor-bearing mice, and these alterations persisted following tumor infiltration. Cluster 3 included genes whose expression was induced by the tumor in peripheral monocytes, and their expression level remained elevated following tumor infiltration. Similarly, Cluster 6 included genes whose expression was repressed in blood monocytes of tumor-bearing mice and remained repressed following tumor infiltration. We also identified gene clusters (Clusters 1 and 2) whose expression was altered in peripheral monocytes in response to the distal tumor, but this was reversed upon tumor infiltration. Finally, we found two large gene clusters (Clusters 4 and 5) whose expression did not show major differences in the blood but showed marked down- or upregulation during blood-to-tumor transition.
In order to link functional gene programs to these gene expression clusters, we analyzed the enrichment of Hallmark gene sets (Fig. 1D). Genes induced in peripheral monocytes of tumor-bearing mice (Clusters 2 and 3) showed specific enrichment of proliferation-related gene sets (“G2-M checkpoint,” “Mitotic spindle,” “E2F targets”), suggesting enhanced monocyte production in response to the tumor, in line with the observed increase in systemic monocyte levels (Additional file 1: Fig. S1A). Cluster 3 genes, which were induced by the tumor in the periphery and remained induced within the tumor, also included genes related to protein secretion and heme metabolism, the latter being an important driver of macrophage reprogramming in tumors [38,39,40]. Genes that were only turned on upon tumor infiltration (Cluster 5) showed specific enrichment for gene sets related to inflammation and the hypoxia response, indicating local activation and adaptation to the tumor microenvironment. We found that the gene cluster repressed upon tumor infiltration (Cluster 4) was enriched for interferon response genes. Interestingly, however, interferon response-related genes showed the strongest enrichment in the gene cluster which was already repressed in the periphery and remained repressed following tumor infiltration (Cluster 6).
These transcriptomic changes in monocytes were associated with a gradual increase in their T-cell suppressive activity ranging from blood monocytes from healthy mice, through blood monocytes from tumor-bearing mice, to tumor-infiltrating monocytes (Additional file 1: Fig. S3A,B). In contrast, the ability of monocytes to support cancer cell proliferation was not altered appreciably by the tumor, neither systemically nor locally (Additional file 1: Fig. S3C).
By comparing our data to previously published monocyte polarization states [31], we found a highly significant enrichment of an IL-1-driven transcriptional program in peripheral monocytes from tumor-bearing hosts (Fig. 1E, F). Accordingly, analysis of pro-inflammatory cytokines in the blood of tumor-bearing mice revealed significantly higher levels of IL-1 family cytokines IL-1β and IL-36β, along with IL-6 and the IL-1β-dependent cytokine G-CSF (Fig. 1G) [41].
Overall, these results demonstrate that the transcriptome of Ly6Chi monocytes undergoes major changes upon tumor infiltration. However, peripheral monocytes in tumor-bearing mice already show transcriptomic alterations, which could be linked to systemic tumor-associated inflammation. Tumor-induced changes in the expression of specific gene sets in peripheral monocytes, including those related to interferon response, persist following tumor infiltration, suggesting a tumor-driven preconditioning of monocytes impacting their transcriptional program within the tumor.
Tumor-induced epigenetic alterations at promoters in peripheral monocytes lead to repression of interferon-responsive promoters and activation of pro-tumoral genesOur observation that some genes in peripheral blood monocytes showed durable expression changes in the tumor-bearing state suggested that some of these genes were programmed at the epigenetic level in the periphery, making their transcriptional induction or repression more stable in the tumor.
In order to detect potential tumor-induced epigenomic alterations in monocytes, we first assessed the genome-wide distribution of Histone H3 Lysine 4 trimethylation (H3K4me3), a key histone modification for transcriptional initiation characteristic of promoter regions [42], using the CUT&Run method. We detected H3K4me3 signal predominantly (88%) at or near promoter regions, as expected (Additional file 1: Fig. S4). Comparative analysis between blood monocytes from LLC tumor-bearing and healthy mice revealed a set of promoters with altered H3K4me3 signal (166 induced and 312 repressed sites with P < 0.05, absolute log2[fold change] ≥ 0.5) (Fig. 2A, B, Additional file 4: Table S3).
Fig. 2
Tumor-induced epigenetic alterations at promoters in peripheral monocytes lead to repression of interferon-responsive promoters and activation of pro-tumoral genes. A Volcano plot showing genomic sites with differential H3K4me3 signal between Ly6Chi monocytes from the blood of LLC tumor-bearing versus healthy mice (P < 0.05 and absolute log2[fold change] ≥ 0.5). Representative closest protein-coding genes are highlighted. B Read distribution plot showing H3K4me3 signal at genomic sites with differential H3K4me3 signal. C Enrichment of MSigDB Hallmark gene sets among genes annotated to genomic sites with differential H3K4me3 signal. Top 5 gene sets are shown by p-value. D Top 5 known transcription factor (TF) motifs enriched among genomic sites showing repressed H3K4me3 signal in Ly6Chi monocytes from the blood of LLC tumor-bearing mice versus healthy mice. E Chromatin accessibility (ATAC-seq) and H3K27ac signal in Ly6Chi monocytes from the blood of healthy and LLC tumor-bearing mice at genomic sites with repressed or induced H3K4me3 signal when comparing tumor-bearing vs. healthy. Boxes show the median and the interquartile range (IQR), whiskers show highest and lowest values within 1.5 × IQR. Wilcoxon test; ns: not significant, *P < 0.05, **P < 0.01, ***P < 0.001. F Frequency of genes with differential H3K4me3 signal that are among the differentially expressed genes identified in Fig. 1C (DEG) or not (non-DEG). G Frequency of different cluster identities (determined in Fig. 1C) among the genes with induced or repressed H3K4me3 signal. H–M Genome browser snapshots showing average H3K4me3 signal in Ly6Chi monocytes from the blood of healthy and LLC tumor-bearing mice at representative genes from different expression clusters. Bar plots show mRNA expression of the same genes determined by RNA-seq. Bar plots show mean + SEM
By linking the nearest gene to each changing promoter, we found that genes with induced promoters were related to cellular functions such as cell division (e.g., Cdk1, Cdkn1a, Plk1), cell adhesion and migration (e.g., Rhov, F11r), and immunosuppression (e.g., Socs3, Siglece, Cd38). Among the genes with repressed promoters, we found several genes linked to the interferon response (e.g., Ifit206, Rsad2, Mx2) (Fig. 2A). These observations were further supported by the significant enrichment of the corresponding Hallmark gene sets related to cell division and the interferon response among the genes with induced and repressed promoters, respectively (Fig. 2C).
While no known motifs were significantly enriched among induced promoters, we found significant enrichment of interferon-responsive IRF and ISRE motifs among repressed promoters (Fig. 2D). In line with these data, nearly all IRF transcription factor family members, except for Irf9, showed significantly reduced expression in peripheral monocytes of tumor-bearing mice, with Irf1 and Irf7 showing the greatest downregulation (Additional file 1: Fig. S5).
We then performed ATAC-seq to map chromatin accessibility across the genome of blood monocytes from healthy and LLC tumor-bearing mice and used these data to compare chromatin accessibility specifically at differential promoters. This analysis showed that average chromatin accessibility slightly decreased at repressed promoters in tumor-bearing mice (Fig. 2E). In addition, promoters that were induced by the tumor showed higher chromatin accessibility already at baseline in healthy mice, and accessibility at these sites did not increase further in response to the tumor (Fig. 2E).
In order to obtain information about promoter activity, we used CUT&Tag to analyze the genome-wide distribution of Histone H3 Lysine 27 acetylation (H3K27ac), a histone modification characteristic of promoters and enhancers with active transcription [43,44,45,46]. Similar to chromatin accessibility, promoters that were induced in tumor-bearing mice already showed higher average H3K27ac signal in healthy mice compared to repressed promoters, indicating higher baseline activity. In addition, the H3K27ac signal was further enhanced on this set of promoters in response to the distal tumor (Fig. 2E).
Next, we asked whether genes with differential promoters showed changes in their expression either in the blood or upon tumor infiltration and, if so, which previously identified gene expression cluster (shown in Fig. 1C) they can be linked to. Remarkably, less than half of the genes with altered promoters showed expression changes in the blood or upon tumor infiltration, indicating that promoter alterations were not necessarily associated with a direct change in transcription (Fig. 2F). Among the genes where promoter reprogramming could be linked to transcriptional change, we found that genes induced in the circulation (Clusters 2 and 3 in Fig. 1C) could be almost exclusively linked to induced promoters (Fig. 2G). Such epigenetically programmed genes included Cd38 and Trem2, which have well-established roles in driving immunosuppressive and pro-tumoral functions of monocytes/macrophages [47,48,49,50,51,52,53,54]. These genes showed increased H3K4me3 at their promoters in the circulating monocytes from tumor-bearing mice, and this was associated with a persistently enhanced transcription upon tumor infiltration (Fig. 2H, I). Similarly, repressed genes in the circulation (Clusters 1 and 6 in Fig. 1C) could only be linked to repressed promoters (Fig. 2G), further indicating a close correspondence between the direction of changes in promoter H3K4me3 levels and in gene expression. Such repressed genes included Slamf8, a negative regulator of ROS production, and Clec12a, an inhibitory receptor involved in cell death sensing (Fig. 2J, K) [55, 56].
Interestingly, genes that were upregulated only upon tumor infiltration (Cluster 5 in Fig. 1C) could be preferentially linked to promoters induced in the circulation (Fig. 2G). This raised the possibility that tumor-induced epigenetic changes at promoters could prime genes for activation upon tumor infiltration. This gene set included Socs3, Thbs1, and Myc, which have been previously linked to immunosuppressive and tumor-promoting functions in macrophages (Fig. 2L, M, Additional file 1: Fig. S6) [57,58,59,60].
Overall, these data indicate that a set of promoters exhibit tumor-induced alterations in monocytes prior to tumor infiltration. This involves the repression of interferon-responsive promoters and the potential priming of key pro-tumoral genes for expression in the tumor microenvironment.
The enhancer landscape in peripheral monocytes is remodeled in response to the tumor, affecting a distinct set of transcription factor binding motifsWe hypothesized that enhancers of peripheral monocytes may also show changes in response to the distal tumor. Hence, we used CUT&Tag to analyze the enhancer landscape of peripheral monocytes from healthy and LLC tumor-bearing mice by assaying the genome-wide distribution of histone H3 Lysine 4 monomethylation (H3K4me1), a histone modification which marks enhancers [61].
Differential analysis between peripheral monocytes from tumor-bearing and healthy mice revealed more than 3000 genomic regions with altered H3K4me1 signal, which represented approximately 10% of all detected H3K4me1+ enhancers (1757 induced and 1427 repressed sites at P < 0.05, absolute log2[fold change] ≥ 0.5 among 33,110 total detected H3K4me1+ regions) (Fig. 3A, B, Additional file 5: Table S4). Most of these tumor-modulated enhancers were located in distal intergenic regions or introns (Fig. 3C).
Fig. 3
The enhancer landscape in peripheral monocytes is remodeled in response to the tumor, affecting a distinct set of transcription factor binding motifs. A Volcano plot showing genomic sites with differential H3K4me1 signal between Ly6Chi monocytes from the blood of LLC tumor-bearing versus healthy mice (P < 0.05 and absolute log2[fold change] ≥ 0.5). B Read distribution plot showing H3K4me1 signal at genomic sites with differential H3K4me1 signal. C Genomic distribution of sites with differential and unaltered H3K4me1 signal. D Chromatin accessibility (ATAC-seq) and H3K27ac signal in Ly6Chi monocytes from the blood of healthy and LLC tumor-bearing mice at genomic sites with repressed or induced H3K4me1 signal when comparing tumor-bearing vs. healthy. Boxes show the median and the interquartile range (IQR), whiskers show highest and lowest values within 1.5 × IQR. Wilcoxon test; ns: not significant, ***P < 0.001. E Top 5 transcription factors (TF) matched to de novo motifs enriched among genomic sites showing repressed or induced H3K4me1 signal in Ly6Chi monocytes from the blood of LLC tumor-bearing mice vs. healthy mice. De novo motif sequences and similarity scores to matched known motifs are shown in Figure S7
Average chromatin accessibility significantly decreased at repressed enhancers, whereas it increased at induced enhancers, indicating chromatin remodeling at these sites (Fig. 3D). Average H3K27ac levels significantly increased at induced enhancers in tumor-bearing mice, indicating elevated enhancer activity, whereas H3K27ac levels remained unaltered at repressed enhancers (Fig. 3D).
Transcription factor motif enrichment analysis on differential enhancers revealed enrichment of the PU.1 motif both at repressed and induced sites (Fig. 3E, Additional file 1: Fig. S7). This was expected, as PU.1 is a myeloid lineage-determining factor which has an essential role in maintaining cell type-specific enhancers [21]. Among the repressed enhancers, we found strong enrichment of the PU.1-IRF composite motif, adding further support to the notion that IRF activity is suppressed in peripheral monocytes in response to the tumor (Fig. 3E). Among the induced enhancers, the most significantly enriched motifs could be linked to C/EBP, AP-1, RUNX, and STAT transcription factor families, all of which can mediate response to extracellular inflammatory signals and cytokines (Fig. 3E). Expression levels of transcription factors belonging to these families were largely unaltered in peripheral monocytes, but many of them showed marked upregulation following tumor infiltration (Additional file 1: Fig. S8A). In line with this, gene regulatory network inference based on transcriptomic data revealed high inferred activities in tumor-infiltrating monocytes for C/EBPβ, multiple AP-1 members (e.g., FOS, JUN) and STAT3, whereas no marked tumor-induced changes could be observed in peripheral monocytes in the activity of these transcription factors (Additional file 1: Fig. S8B, Additional file 6: Table S5).
Altogether these results indicate that a distal tumor is able to remodel the enhancer landscape in peripheral monocytes. Specifically, this involves repression of enhancers capable of binding interferon-responsive IRF transcription factors as well as the establishment of enhancers harboring motifs for transcription factor families that can be activated by inflammatory and cytokine signaling, including C/EBP, AP-1, and STAT.
Remodeled enhancers in peripheral monocytes are linked to lasting gene expression programs and to subsequent gene activation in the tumor microenvironmentFinally, we sought to link differential enhancers to genes modulated by the tumor either in the periphery or upon tumor infiltration. To this end, we analyzed the frequency of induced and repressed enhancers in a ± 100 kilobase (kb) window around the transcription start site of differentially expressed genes belonging to different clusters described in Fig. 1C (Fig. 4A). The observed enhancer frequencies were then compared to enhancer frequencies detected around random gene sets of the same size, in order to determine the enrichment or depletion of differential enhancers around distinct gene clusters (Fig. 4A). This analysis revealed the strongest enrichment of induced and repressed enhancers around the previously defined C3 and C6 gene expression clusters, respectively (Fig. 4B, Additional file 1: Fig. S9). These clusters comprised genes that showed induction or repression in the periphery, which persisted following tumor infiltration (e.g., Hebp1 and Soat2 from C3; Ifi27l2a and Tlr11 from C6, Fig. 4C–F). Interestingly, genes whose peripheral activation or inhibition could be reversed in the tumor (C2 and C1, respectively) did not show such a strong association with altered enhancers (Fig. 4B, Additional file 1: Fig. S9). Notably, genes that were only induced in the tumor microenvironment (C5) showed a marked enrichment of induced enhancers and a significant depletion of repressed enhancers in their vicinity (e.g., Nos2 and Rhov, Fig. 4B, G, H, Additional file 1: Fig. S9). In addition, we also found significant enrichment of repressed enhancers but no depletion of induced enhancers, around genes which were downregulated upon tumor infiltration (C4) (Fig. 4B, Additional file 1: Fig. S9).
Fig. 4
Remodeled enhancers in peripheral monocytes are linked to lasting gene expression programs and to subsequent gene activation in the tumor microenvironment. A Scheme summarizing the approach to determine enrichment of differential enhancers (increased or decreased H3K4me1 signal in tumor-bearing mice) ± 100 kilobase (kb) around the transcription start site of differentially expressed genes (DEGs) identified in Fig. 1C. B Fold change and z-test p-value of the comparison of the number of differential enhancers found ± 100 kb around genes belonging to the indicated expression clusters versus random gene sets of the same sizes. The number of differential enhancers found for each cluster and the corresponding random gene sets are shown in Fig. S9. C–H Genome browser snapshots showing average H3K4me1 signal in Ly6Chi monocytes from the blood of healthy and LLC tumor-bearing mice at representative genes from different expression clusters. Bar plots show mRNA expression of the same genes determined by RNA-seq. Bar plots show mean + SEM. I Cartoon showing analysis method for motif enrichment at enhancer sets linked to C3 and C5 gene clusters defined in Fig. 1C. J Heatmap showing transcription factor binding motifs with significant enrichment at induced enhancers linked to either Cluster 3 (C3) or Cluster 5 (C5) (n = 91 enhancers linked to C3, n = 431 enhancers linked to C5, HOMER known motifs, FDR < 0.05). K Heatmap showing enrichment of different STAT transcription factor motifs from the JASPAR motif collection to either C3 or C5 genes (n = 91 enhancers linked to C3, n = 431 enhancers linked to C5, motifs with FDR < 0.05 are shown in bold; monaLisa motif enrichment analysis)
The association of induced enhancers with C5 genes indicated that a large number of genes that are induced upon tumor infiltration show increased H3K4me1 in their vicinity in response to the tumor already in the circulation. To further examine these genes and their associated enhancers, we linked induced H3K4me1+ enhancers to nearby C5 genes (< 100 kb). We found that a subset of these genes showed slightly but significantly increased transcription already in the periphery (Additional file 1: Fig. S10), but the majority of them was not altered.
In order to determine whether C5-associated enhancers contain distinct transcription factor binding motifs compared to enhancers linked to C3 genes (induced already in periphery), we performed motif enrichment analysis on these two enhancer sets (Fig. 4I). We found that both C3- and C5-associated enhancers showed enrichment of C/EBP, AP-1, and ETS-related transcription factor motifs (Fig. 4J) with C3-linked enhancers exhibiting the strongest enrichment for C/EBP motifs. Notably, STAT motif enrichment could only be detected at enhancers associated with C5 genes. Specific enrichment of STAT motifs at C5-linked enhancers was further confirmed by an independent approach, using the monaLisa enrichment tool with the JASPAR motif database (Fig. 4K).
We also performed motif enrichment analysis on repressed H3K4me1+ enhancers which could be linked to Cluster 6 genes (genes with durable repression maintained in the tumor). This analysis revealed significant enrichment of SpiB, PU.1 and PU.1–IRF motifs (Additional file 1: Fig. S11), which corresponded to the three most significantly enriched motifs we previously found when considering all repressed H3K4me1+ enhancers (Fig. 3E).
Overall, these results indicate that altered enhancers are enriched primarily around genes with peripheral gene expression changes that persist throughout the blood-to-tumor transition of monocytes. This suggests that epigenomic alterations can instruct sustained gene expression changes that are less likely to be reversed in the tumor microenvironment. In addition, strong enrichment of enhancers induced in the periphery around genes activated upon tumor infiltration suggests an epigenetic priming effect at these loci.
Comments (0)