
Remember me
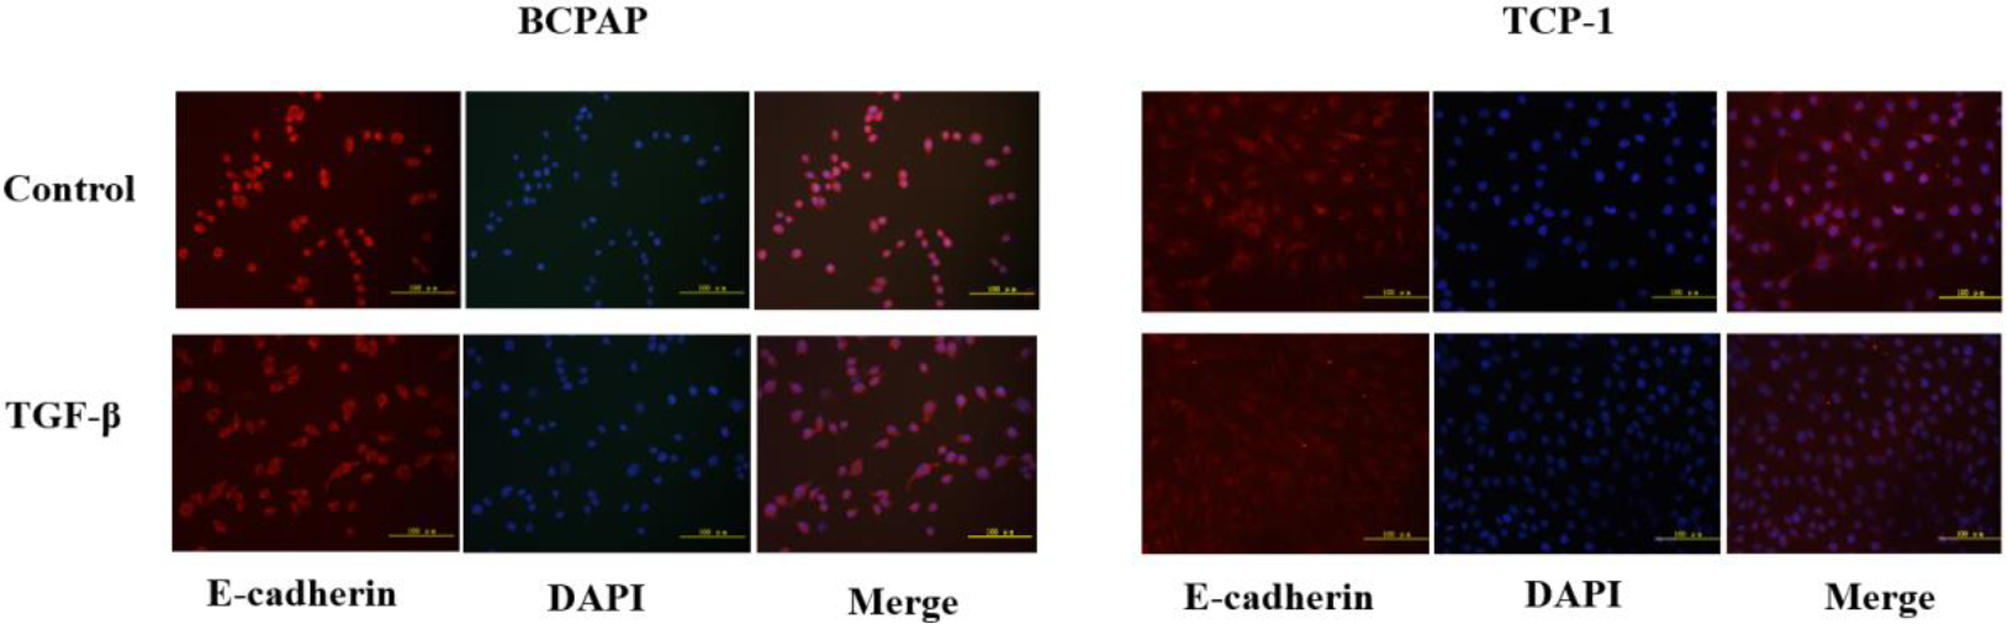
TGF-β treatment for 36 h led to a gradual change in TPC-1 morphology from a plump, round shape to a spindle shape, which allowed the cells to move more easily. Similar morphological changes were observed in BCPAP, suggesting that the cells were undergoing EMT. Immuno- fluorescence staining of cells revealed that E-cadherin in the three TC cell lines was primarily localized to the cell membrane before treatment. Following treatment with 10 ng/mL TGF-β for 36 h, E-cadherin in all cell lines became primarily localized to the cytoplasm, along with a decrease in expression (Figs. 1).
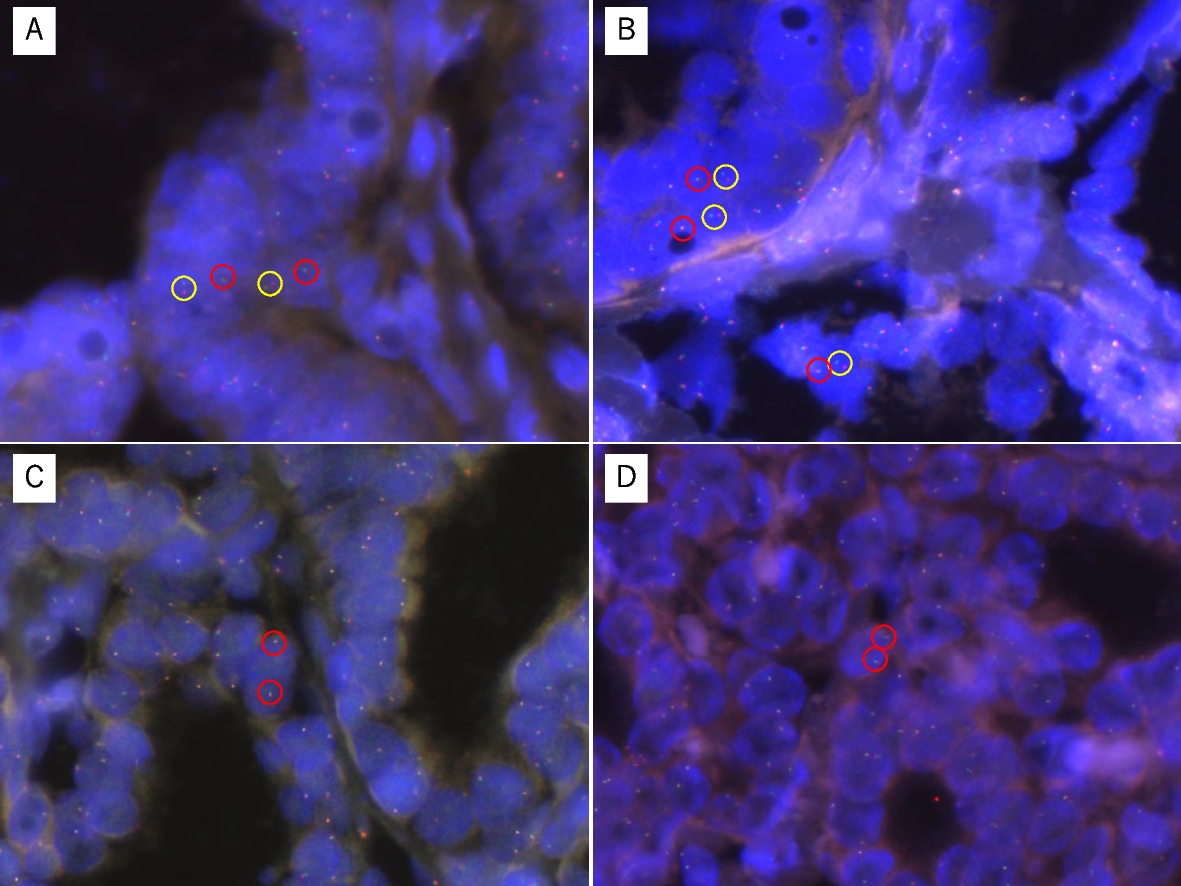
Fig. 1
Effects of TGF-β on the localization of the EMT marker protein E-cadherin in the BCPAP and TPC-1 cell lines. Cells were treated with TGF-β (10 ng/mL) for 36 h. Expression of E-cadherin (red) was analyzed by immunofluorescence staining. Nuclei were visualized with DAPI staining (blue). Magnification: × 200; scale bars: 100 μm
Changes in the migratory ability of TC cells after TGF-β treatmentA wound-healing assay was performed after treatment with TGF-β (5 ng/mL) for 36 h. After 24 h of migration, the BCPAP and TPC-1 cell lines in the treatment group exhibited higher rates of migration than those in the control group (P < 0.01), as shown in Figs. 2. Due to the classification of K1 cells (RAS-mutant) as a rare mutation subtype, the localization of EMT markers and migratory phenotypes were not analyzed.
Fig. 2
Effects of TGF-β on the migratory ability of BCPAP and TPC-1 cells. cells migration ability were detected using wound healing assays after pretreatment with TGF-β (5 ng/mL) for 36 h. The results are representative of at least three independent experiments. Error bars represent SEM. **P < 0.01
Changes in invasive and metastatic activities of TC cells after TGF-β treatmentAfter treatment with TGF-β for 36 h, cells were digested, suspended, transferred into a Transwell chamber, and cultured for 36 h. Cells that migrated through the Matrigel were counted (see the Experimental Methods section for the detailed experimental procedure). As shown in Fig. 3, the invasive and metastatic activities of BCPAP, TPC-1, and K1 cells treated with TGF-β were 7-, 10-, and 6-fold higher than those in the control group, and the differences were statistically significant.
Fig. 3
Effects of TGF-β on invasive and metastatic activities of cells. Invasion capacity of papillary thyroid cancer cell lines was detected using transwell assays after treatment with TGF-β (5 ng/mL) for 36 h. The results are representative of at least three independent experiments. Error bars represent SEM. **P < 0.01
Increased expression of transcription factors during TGF-β-induced EMTThe results described above clearly demonstrated that TGF-β can induce the EMT in TC cell lines. Our previous research has suggested that the NF-κB signaling pathway has a crucial role in TNF-α-induced EMT, invasion, and metastasis in TC via the regulation of TWIST1 expression [25]. To determine whether transcription factors play a critical role in the EMT of TC, we measured gene and protein expression levels of transcription factors in TC cells after treatment with TGF-β. We utilized three representative TC cell lines, namely TPC-1 (reported to harbor RET/PTC1 rearrangement), BCPA (reported to harbor BRAF V600E mutations), to evaluate the effect of different mutations on transcription factor expression. The results are summarized in Fig. 4. As determined by using polymerase chain reaction (PCR), after 12 h of TGF-β treatment, the mRNA level of SNAI1 was higher than that in the control for all three cell lines. The highest increases were approximately 2.5-fold in TPC-1 (Fig. 4), 9.0-fold in BCPAP, and these differences were statistically significant.
Fig. 4
Influence of TGF-β treatment on transcription factor expression in TCP-1 cells. Cancer cells were serum-starved for 24 h before treatments, then treated with different concentrations of TGF-β, TGF-β + TSH, and TGF-β + KI for 12 h. Total RNA was isolated and subjected to qRT-PCR and values were normalized with GAPDH used as an internal control. Results are reported as mean of three independent experiments. Columns, mean (n = 3); bars, SEM. *P < 0.05
As shown in Fig. 5, following stimulation with TGF-β, levels of SNAI2, ZEB1, and TWIST1 were also elevated in TPC-1.In the BCPAP cell line, there was an increase in the expression level of SNAI1 after TGF-β stimulation. ZEB1 expression also showed an increase; however, the difference was not statistically significant. These results suggest that the mechanisms underlying TGF-β-induced EMT may differ across TC cell lines with different mutations. However, further research is required to confirm this conjecture.
Fig. 5
Influence of TGF-β treatment on mRNA expression levels of EMT markers in TC cell lines. Cancer cells were serum-starved for 24 h before treatments, then treated with different concentrations of TGF-β, TGF-β + TSH, and TGF-β + KI for 12 h. Total RNA was isolated and subjected to qRT-PCR, values were normalized with GAPDH used as an internal control. Results are reported as mean ± SEM of three independent experiments; Columns, mean (n = 3); bars, SEM. *P < 0.05
Influence of TGF-β treatment on mRNA levels of EMT markers in TC cell linesThe TC cell lines BCPAP, TPC-1, and K1 were stimulated with different concentrations of TGF-β (0, 5, and 10 ng/mL combined with thyroid-stimulating hormone (TSH) (0.1 and 1 mU/mL) and potassium iodide (KI) (10− 3 and 10− 7 mol/L). After 12 h of treatment, cell precipitates were collected for RNA extraction and analyses of mRNA levels of the canonical EMT markers E-cadherin, N-cadherin, and vimentin.
As shown in Fig. 5, treatment with TGF-β alone and in combination with TSH and KI decreased the mRNA level of the epithelial marker E-cadherin and increased the mRNA levels of the mesenchymal markers N-cadherin and vimentin. In BCPAP, the mRNA level of E-cadherin was decreased by approximately 60–90% (P < 0.05). The mRNA level of N-cadherin increased by up to 14-fold in the treatment groups after 12 h (P < 0.05). However, the increase in vimentin mRNA levels was less substantial (i.e., 1.3- to 1.4-fold; P < 0.05).
In TPC-1 cells, E-cadherin levels were approximately 70–90% lower in the treatment groups than in the control group (P = 0.05). The mRNA level of N-cadherin was 3- to 6-fold higher in the treatment groups than in the control group (P < 0.05). Moreover, the addition of TSH enhanced these effects. Vimentin mRNA levels also increase, to a smaller extent, with the treatment groups showing increments of 1.4- to 2.6-fold (P < 0.05).
In the K1 cell line, the mRNA level of E-cadherin was approximately 30–60% lower in the treatment groups than in the control group (P < 0.05). The mRNA level of N-cadherin was 2- to 3-fold higher in the treatment groups (P < 0.05). The increase in vimentin mRNA levels was smaller with the various treatment groups exhibiting increases of 1.2- to 1.7-fold (P < 0.05).
Influence of TGF-β treatment on protein levels of EMT markers in TC cell linesThe TC cell lines BCPAP and TPC-1 were treated with different concentrations of TGF-β (0, 5, and 10 ng/mL) combined with tumor necrosis factor-alpha (TNF-α) (10 ng/mL), TSH (0.1 and 1 mU/mL), and KI (10− 3 and 10− 7 mol/L). After 36 h of treatment, the cell precipitates were collected for total protein extraction to measure the protein levels of canonical EMT markers.
As shown in Fig. 6, western blotting revealed that 36 h of treatment with different TGF-β concentrations led to the downregulation of E-cadherin and upregulation of N-cadherin and vimentin in the BCPAP cell line. E-cadherin protein levels were approximately 57–76% lower in the various TGF-β treatment groups than in the control group, while N-cadherin protein levels were 1.77- to 7.23-fold higher, with the greatest increase occurring in the TGF-β + TNF-α group. The protein levels of vimentin were 1.06- to 1.22-fold higher in the TGF-β treatment groups than in the control group and also showed the greatest increase in the TGF-β + TNF-α group. The differences described above were statistically significant.
Fig. 6
Influence of TGF-β treatment on protein levels of EMT markers in TC cell lines. Human thyroid carcinoma cell lines BCPAP and TPC-1 were used. Cancer cells were serum-starved for 24 h before treatments. EMT markers E-cadherin, N-cadherin and vimentin were detected. Total protein was isolated and subjected to Western blot, expression of β-action served as a loading control. Results are reported as mean of three independent experiments
In the TPC-1 cell line, decreases in E-cadherin protein levels and increases in N-cadherin and vimentin protein levels were also observed after TGF-β treatment. E-cadherin protein level decreased by approximately 8–85% in the TGF-β treatment groups. N-cadherin protein levels increased by 1.95- to 14.77-fold. Addition of TSH also enhanced these effects, similar to that in gene expression. Moreover, vimentin protein levels increased by 1.16- to 2.28-fold. The differences described above were statistically significant.
Comments (0)