Participants and preliminary assessments
Eight young physically active (Y), six older (O), and nine older physically active (OT) men volunteered to participate in the present study and provided written informed consent. To be eligible for the study, young and older physically active men took part in at least 3 × 30 min of structured exercise (e.g. running, swimming, cycling, team sports) every week. All participants were non-smokers, normotensive (< 140/90) and non-obese (BMI < 30 kg/m2), and had no history of cardiovascular, metabolic, or haematological disorders or previous adverse responses to local anaesthetic. Participants had no disorders of blood coagulation and were not currently taking anti-inflammatory drugs or supplements. Ethical approval was granted from the Loughborough University research ethics committee (R17-P177), and the study conformed to the Declaration of Helsinki.
Participants visited the laboratory on three separate occasions separated by at least 48 h. During the first visit, blood pressure of the brachial artery was measured using an automated sphygmomanometer (Omron Healthcare, Milton Keynes, UK) with the subjects in a seated position, before height was measured using a stadiometer and measurements of body fat and body mass were assessed using bioelectrical impedance analysis (Seca, Hamburg, Germany). Thereafter, maximal handgrip strength was assessed using a handheld dynamometer (A5401 Digital Hand Grip Dynamometer, Takei, Japan), and maximal isometric quadriceps torque was assessed using isokinetic dynamometry (Cybex isokinetic dynamometer, HUMAC NORM, Stoughton, MA). For both handgrip strength and quadriceps torque, participants performed three maximal efforts on their dominant side and the average value was used for analysis. Lastly, participants completed an International Physical Activity Questionnaire (IPAQ) and were given a pedometer to wear for four consecutive days prior to their second laboratory visit. Participants returned to the laboratory on a second occasion for magnetic resonance imaging (MRI) of the dominant leg. The MRI was conducted by NHS radiographers based at the National Centre for Sport and Exercise Medicine at Loughborough University. MRI scans were performed and analysed as previously described (Balshaw et al. 2017).
Muscle biopsy and cell isolation
Participants reported to the laboratory for their final visit following an overnight fast (> 10 h) and having refrained from any strenuous activity for the previous 24 h. Upon arrival, a 10-mL fasted venous blood sample was obtained and collected into EDTA and serum separator tubes (Sarstedt, Numbrecht, Germany). Subsequently, muscle biopsies of the vastus lateralis muscle on the dominant leg were obtained using the Bergstrom needle biopsy technique modified for use with suction. Muscle samples were blotted dry, dissected free of any obvious adipose or connective tissue, and then divided into two discrete portions. One portion was embedded in OCT mounting medium (Tissue-Tek, Sakura Finetek Europe, Alphen aan den Rijin, Netherlands), frozen in liquid-cooled isopentane and stored at − 80 °C until immunohistochemical analysis. The second portion (~ 100 mg) was submerged in growth media (GM) consisting of high-glucose DMEM (Sigma Aldrich, Gillingham, UK) supplemented with 20% foetal bovine serum (FBS; Pan Biotech, Wimborne, UK), and 100 U/mL penicillin and 100 µg/mL streptomycin (Gibco™, Fisher Scientific, Loughborough, UK). GM was also supplemented with 5 µg/mL amphotericin B (Gibco™, Fisher Scientific) at this stage. Muscle-derived cells (MDCs) were isolated using the explant technique as previously described (Lewis et al. 2000). In brief, muscle tissue was finely minced in GM and plated into gelatin-coated 25-cm2 flasks (Nunc™, Fisher Scientific), and incubated at 37 °C and 5% CO2. MDCs migrated from the tissue explants over the ensuing days and were detached from the surface of the flask using accutase® (Sigma Aldrich). The remaining explant tissue was discarded and the MDCs were sub-cultured for experimentation as described below.
Cell culture and experimental details
MDCs were cultured in gelatin-coated 80-cm2 flasks (Nunc™, Fisher Scientific) in GM. Once cells reached 80% confluency, they were detached from the cell culture plastic using accutase® (Sigma Aldrich) and sub-cultured across serial passages to increase cell numbers. All experiments were conducted between passages 4 and 5, which was typically less than 30 days from the time of muscle biopsy.
In total, 50,000 cells were seeded into six-well plates and cultured in GM with media replenishment every 48 h. Once cells reached 90% confluence, myotube cultures were generated by replacing GM with differentiation media (DM) consisting of high-glucose DMEM supplemented with 2% horse serum (Sigma-Aldrich) and 100 U/mL penicillin and 100 µg/mL streptomycin (Gibco™, Fisher Scientific). Cells were maintained in DM for 5 d with the media completely replenished after 3 d and a sub-set of experimental cells were fixed for immunocytochemistry at this point. The remaining myotube cultures were washed 2 × with PBS and incubated for 6 h in amino acid free DMEM (US Biologicals, Salem, MA) in the absence of serum, and were subsequently re-fed with a combination of amino acids (see supplementary table 1) prepared in amino acid free media and of the same relative composition as a standard whey protein isolate drink typically consumed in human protein metabolism studies (UltraWhey 90; Volac, Hertfordshire, UK). For analysis of mTORC1 signalling, myotube cultures were lysed following 6 h of amino acid withdrawal, and after 0.5, 1, and 3 h of re-stimulation. For measurements of protein synthesis, we utilised the SUnSET assay which relies upon incorporation of the antibiotic and tyrosyl-tRNA analogue into nascent proteins and detection via immunoblotting (Schmidt et al. 2009). Puromycin was added to the culture media for the final 3 h of amino acid withdrawal or the entire 3 h of amino acid re-stimulation at which points cells were lysed for immunoblotting. We chose to include puromycin for the duration of the amino acid restimulation period to ensure that any temporal differences in protein synthesis rates between participants over the 3-h period were captured in the analysis.
Blood analysis
EDTA blood tubes were immediately centrifuged at 1750 × g for 15 min at 4 °C to obtain plasma samples. Blood samples in serum separator tubes were left to clot at room temperature before centrifugation as described above. Plasma and serum samples were stored at − 20 °C until analysis. Plasma samples were analysed for fasting glucose concentrations with a semiautomated analyser (Pentra 400; Horiba Medical, Northampton, UK), and fasting serum insulin was determined using a commercially available ELISA kit (DRG Instruments GmbH, Marburg, Germany). The homeostatic model of insulin resistance was calculated as previously described (Hulston et al. 2018).
Immunostaining
For muscle tissue immunohistochemistry, serial transverse (8 µm) muscle sections were cut, placed on poly-lysine coated microscope slides (Fisher Scientific), and fixed for 10 min in 3.7% formaldehyde. Tissue was then blocked for 1 h at room temperature in tris buffered saline (TBS) containing 5% goat serum (Abcam, Cambridge, UK), 2% bovine serum albumin (BSA, Fisher Scientific), and 0.2% triton X-100 (Sigma Aldrich). Following 3 × TBS washes, sections were incubated for 1 h with myosin heavy chain type I primary antibody (A4.951 was deposited to the DSHB by Blau, H.M.) diluted in blocking solution. Slides were washed 3 × in TBS before incubation for 2 h with goat anti-mouse AlexaFluor® 488 conjugated IgG secondary antibody (Invitrogen, ThermoFisher, Paisley, UK) and AlexaFluor® 350 conjugated wheat germ agglutinin (Invitrogen), diluted in blocking solution. Coverslips were mounted to slides using Fluoromount™ aqueous mounting medium (Sigma Aldrich).
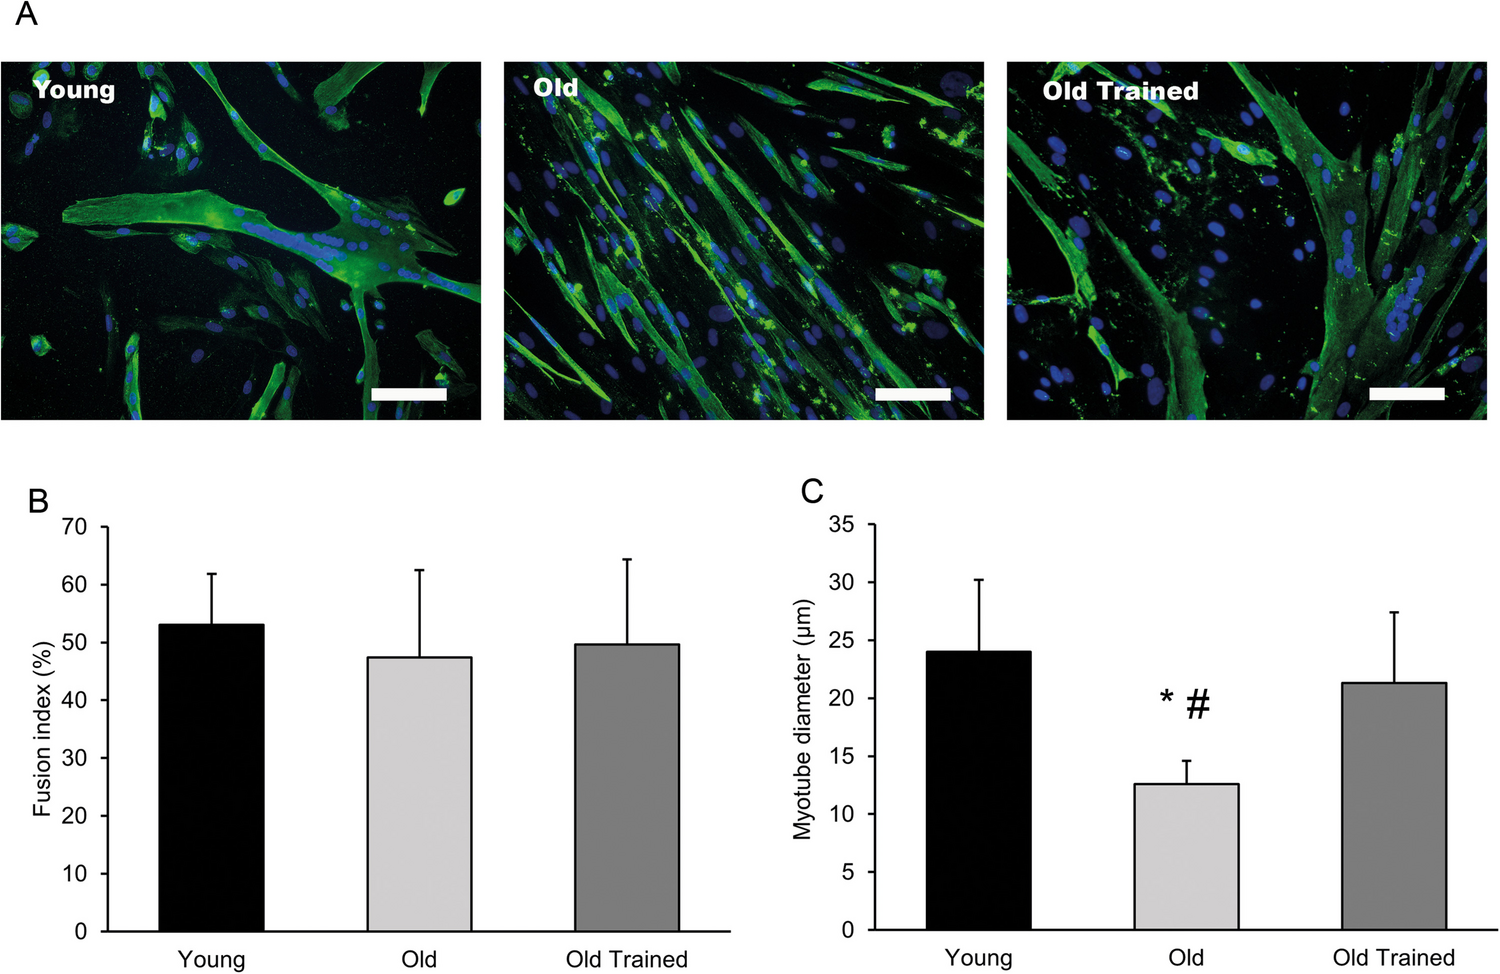
For muscle cell immunocytochemistry, cells were washed twice in PBS, fixed in ice-cold methanol and acetone, and then blocked for 1 h at room temperature in TBS containing 0.2% Triton-X 100 (Sigma Aldrich) and 5% normal goat serum (Abcam). After 3 × TBS washes, cells were incubated for 2 h with monoclonal desmin antibody (Clone D33, Dako, Clostrup, Denmark) diluted 1:100 in TBS containing 0.2% Triton X-100 and 2% normal goat serum. Following three further washes, cells were incubated for 2 h with AlexaFluor® 488 conjugated goat anti-mouse IgG1 secondary antibody (Invitrogen) diluted 1:200 in TBS containing 0.2% Triton X-100 and 2% normal goat serum. 4′,6-Diamidino-2-phenylindole (DAPI) was included in the secondary antibody solution at a dilution of 1:1000, to counterstain nuclei. Coverslips were mounted onto glass microscope slides using Fluoromount™.
All images were captured using a Leica DM2500 fluorescent microscope (Leica, Wetzlar, Germany). Muscle fibre cross-sectional area and myotube diameter were measured using Fiji image analysis software (Schindelin et al. 2012). Cross-sectional areas were defined by the wheat germ agglutinin stained muscle fibre boundary. Fusion index was calculated as the number of desmin-positive cells in a myotube as a percentage of the total number of desmin-positive cells per image.
Immunoblotting
Myotube cultures were washed twice with ice cold PBS and lysed in 200 µL of RIPA buffer (Fisher Scientific) containing a protease and phosphatase inhibitors. In total, 10 µg of protein was loaded into 4–15% Mini-PROTEAN precast gels (Bio-Rad, Hemel Hempstead, UK) and separated by SDS-PAGE at 150 V. The separated proteins were transferred onto 0.2-µm polyvinylidene difluoride (PVDF) membranes (Bio-Rad) at a constant current of 0.25A, and were then washed 3 × in TBS containing 0.1% Tween20 (TBST) and blocked in either 5% non-fat milk (Bio-Rad) or 5% bovine serum albumin (BSA; Fisher Scientific) diluted in TBST for 60 min at 4 °C. After three further TBST washes, the membranes were incubated overnight at 4 °C with primary antibodies against phospho-mTORSer2448 (1:2000 in 2% BSA; Cell Signaling Technology, Danvers, MA, #5536), phospho-rpS6Ser235/236 (1:2000 in 2% milk; Cell Signaling Technology, #2211), phospho-4E-BP1Thr37/46 (1:2000 in 2% milk; Cell Signaling Technology, #2855), or anti-puromycin (1:5000 in 1% BSA; Merck, Watford, UK, #MABE343). Membranes were then washed three times with TBST and incubated for 1 h at room temperature in anti-rabbit IgG HRP-conjugated secondary antibody (Cell Signaling Technology) at a concentration of 1:2000 in either 2% milk or 2% BSA, consistent with the primary antibody dilution, before detection using chemiluminescence. Signals were captured and quantified within the linear range of detection on the Chemidoc XRS system (Bio-Rad) using Quantity One image software (Version 4.6.8, Bio-Rad). Protein phosphorylation was normalised to protein loading through Coomassie blue staining and subsequent selection of a protein band (Bass et al. 2017).
Statistical analysis
All statistical tests were performed using IBM SPSS Statistics version 29 (IBM SPSS Inc., Chicago, IL). Data were checked for normality using Shapiro–Wilk tests, and for homogeneity of variance using Levene’s test or Mauchly’s test of Sphericity as appropriate. Participant characteristics and myotube morphology were assessed using one-way ANOVA with Tukey post hoc analyses when appropriate, or Kruskal–Wallis tests with pairwise Mann–Whitney tests where data was not normally distributed. mTORC1 signalling and puromycin incorporation analyses were assessed using mixed-measures ANOVA with multiple comparisons undertaken with Bonferroni adjustment as required. All data are presented as mean ± standard deviation (SD) unless stated otherwise, and statistical significance was set at p < 0.05.


Comments (0)