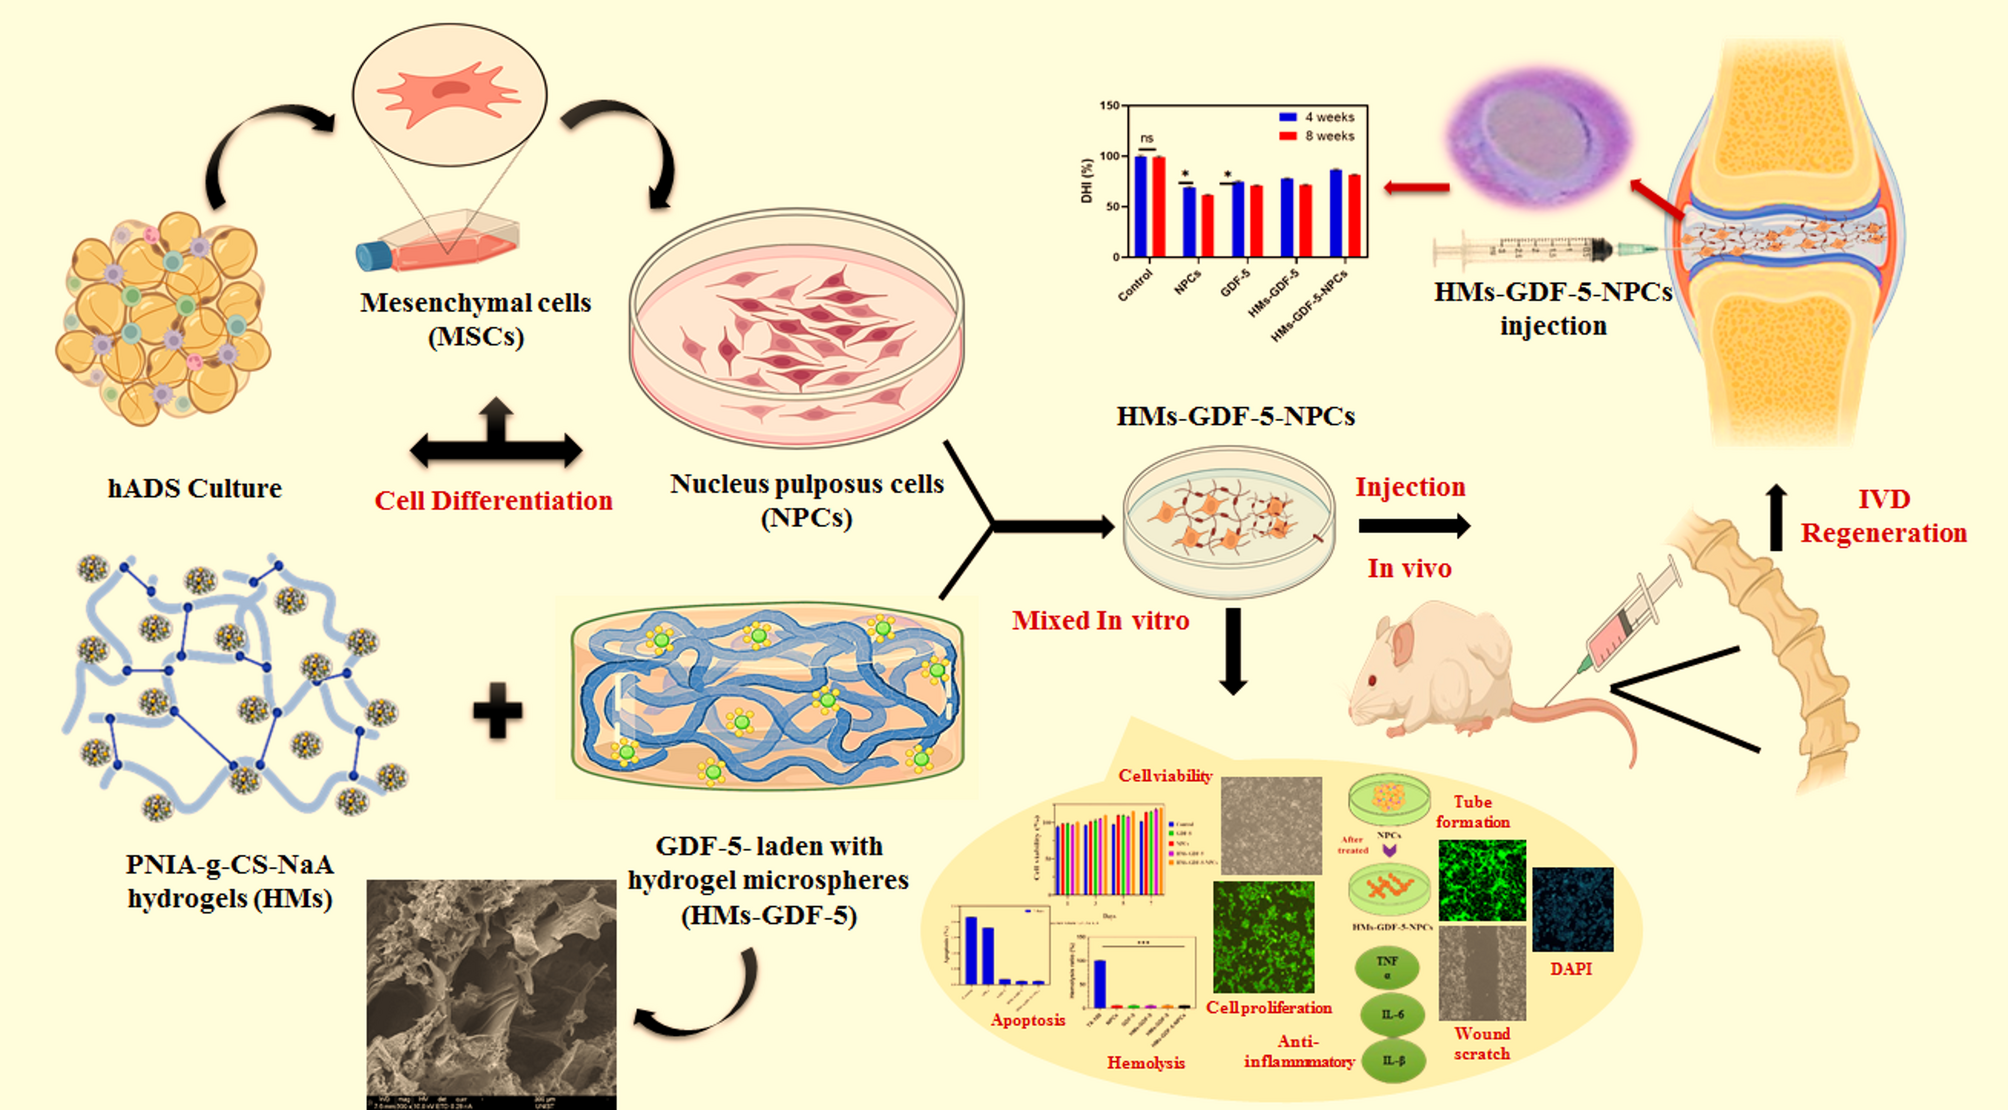
Synthesis of PNIA-g-CS
PNIA-g-CS was synthesized via free radical polymerization, which aligns with the methodology reported elsewhere [20]. N-isopropylacrylamide (NIPAM) and methacrylate chondroitin sulfate (CS) were purified before synthesis for grafting. In brief, NIPAM (10 g) was dissolved in 400 mL of n-hexane at 60 °C by stirring. The monomer was transferred to a Buchner funnel and vacuum filtered to remove any leftover n-hexane, then stored at -20 °C for 24 h. In another reaction, 2.0 g of CS was dissolved in 8.0 mL of DI water with a pH of 10, and 0.298 mL of methacrylate was added while stirring and refluxing at 60 °C for 24 h. Slowly, 400 mL of cold acetone (-20 °C) was added after 24 h. Allowed the precipitate to evaporate under vacuum for 24 h to eliminate the remaining acetone. In the next step, 10 g of pure NIPAM and 2.209 g of CS were dissolved together in DI water, and the nitrogen gas was purged for 15 min. The tetramethylethylenediamine (0.974 ml) was added to this previous mixture in the presence of nitrogen purging. The purging was stopped, and 97.6 mg of ammonium persulfate (APS) was added to the mixture and allowed to polymerize under fluorescent light for 24 h at 37 °C, and the formed viscous polymer solution was kept in a refrigerator at 8 to 10 °C for the subsequent steps. For characterization purposes, the polymer was lyophilized at − 70 °C, ground into a fine powder, and stored in a 4 °C refrigerator.
Fabrication of sodium alginate microsphere (NaA Ms)
The NaA Ms were synthesized using a water-oil emulsion method [21]. In a nutshell, a surfactant called Tween 20 and an alginate solution that was 2% (v/v) and 1% (w/v), respectively, were mixed in a vegetable oil phase. The size of the alginate and oil droplets was changed by varying the stir speeds, leading to large Ms diameters and small microparticulate diameters, respectively. To make the alginate crosslink, a 2% (w/v) CaCl2 solution was dropped into the emulsion in small amounts. Centrifugation at 500 g for 5 min, alternated with washing stages utilizing 70% (v/v) isopropanol and deionized water to remove residual oil from crosslinked microspheres. The freeze-dried NaA Ms were stored at 4 °C for eventual usage.
Preparation of PNIA-g-CS-NaA hydrogels
Hydrogels were produced from PNIA-g-CS with NaA Ms as the precursor. PNIA-g-CS and NaA Ms were dissolved in PBS separately in a usual process to get the precursor solution. The precursor solutions were thoroughly mixed until a homogeneous composite was obtained, leading to the formation of a hydrogel. The solid content factor was determined by mixing PNIA-g-CS and NaA Ms solutions at a volume ratio of 1/1. The concentrations of the two solutions ranged from 3 w/v% to 7 w/v%. To evaluate the effect of molar ratio, PNIA-g-CS and NaA microsphere (Ms) solutions, each at a concentration of 7% (w/v), were mixed at varying volume ratios of 9:1, 7:3, 5:5, 3:7, and 1:9, respectively. The hydrogel’s gelation time was measured using a rheometer and vial tilting methods. For future use, the PNIA-g-CS-NaA microsphere (HMs) composites were stored at 4 °C.
Hydrogel characterizations
The HMs were subjected to overnight freezing at -80 °C followed by a freeze-drying process at -40 °C. After applying a thin layer of gold plating (SC7620-Quorum Tech, UK), the surface of the sample was inspected under an SEM (Hitachi Ltd, Kyoto, Japan). The FTIR spectrometer was used to analyze the functional groups of PNIA, CS, NaA, and PNIA-g-CS-NaA (HMs) in the 500–4000 cm− 1 scanning range with KBr pellets.
Determination of the low critical solution temperature
The LCST was measured with a DSC Calorimeter (TA Instruments). Between 5%(w/v) and 15% (w/v) of PINA-g-CS polymer was tested per test, all in hermetically sealed aluminum dishes that had been pre-weighed. The temperature was ramped up from 0 to 50 °C at a rate of 10 °C per minute. The LCST was calculated by finding the endothermic peak on the DSC thermogram and taking the minimum of this peak.
Rheological and compression testing
A rheometer (HAAKE, RS6000, Germany) with a 35 mm clamp diameter and a coaxial double parallel plate type was used to examine all rheological representations. At 25°C, the initial viscosity experiments were carried out using shear rates between 0.1–100 s− 1. The moduli of G’ (Shear storage) and G” (loss) were estimated at 1 Hz with a range of 0.1 to 100 Pa. In the compression test, the HMs were made with 8 mm and immersed in PBS solution overnight. Using a mechanical testing instrument (Hengyi Precision Instrument, Shanghai, China), hydrogel compression moduli were measured at a 20% strain rate.
Water retention analysis
Following freeze drying, the lyophilized HMs’ weight was reported as W0. After soaking the HMs in a PBS solution for the night, they were weighed again to record their weight at W1. At various time points, the HMs’ weight after water absorption was recorded as Wt, and it was then allowed to cool to room temperature (25 °C). Applying the formula, the water retention rate (WR) was recorded over time: WR =Wt - W0/W1 × 100%.
Gelation time by vial tilting and rheometer methods
Vial tilting methods were used to record the gelation time of HMs. The gel state was determined by inverting the vial and waiting one minute for no flow. A range of concentrations was used to assess the hydrogels’ behavior with the solid-to-volume ratio. In addition, the hydrogels’ gelation time was characterized via the rheometer method (MCR302, Austria) in which constant tension of 0.5 Pa and a set frequency of 1/s were used in oscillation mode for temperature sweep studies. The temperature ranged from 20 to 50 °C at an inflation rate of 1 °C/min, and complex viscosity (η*), elastic modulus (G′), and viscous modulus (G′′) were measured. At the point when G′ = G′′ (the crossover point), the viscosity rapidly intensified, and this equated with the gelation temperature. At 37 °C, η*, G′, and G′′ were continuously monitored in proportion to the time sweep. At 1% strain and 1 Hz, the hydrogels were measured within the linear viscoelastic range (LVR), and the gelation time was recorded as the point where G′ exceeded G′′.
Equilibrium swelling ratio
Following their quick-freeze in liquid nitrogen and lyophilization, the produced HMs were measured for the swelling test. After freeze-drying, HMs were immersed in DMEM/F12 and PBS for 2 days at 37 °C until swelling equilibrium was attained. In the instant following the absorption of surface excess water by filter paper, the weight of completely inflated HMs was observed. At varying concentrations, HMs’ solid content and volume ratio functions were investigated. Applying the following formula: Ws–Wd/Wd. Where Ws (swelled weight) & Wd (dry weight) of the HMs (mg), the swelling ratio was calculated. Triplicate experiments were done.
Degradation of HMs
The HMs degradation was investigated in terms of weight loss in PBS at 37 °C for 6 weeks. After determining the initial weight of the freeze-dried HMs (W0), certain time intervals were used to extract, lyophilize, and weigh (Wt) the HMs. PBS was then added to each sample. With varying concentrations, the HMs’ function was tested for solid contents and volume ratio. The weight loss ratio was estimated as (W0-Wt)/W0 × 100%. The weight remaining ratio was estimated as 1- (W0- Wt)/W0 × 100%.
Preparation of GDF-5-loaded HMs
HMs loaded with GDF5 were synthesized by solvent evaporation from a water-oil emulsion. On dissolving 150 mg of HMs in 2 mL of methylene chloride and 50 µg/mL of GDF-5 was added. After that, the homogenizer was used to emulsify the mixture at 8000 rpm for 30 s while the mixture was submerged in an ice bath. The emulsion was then homogenized at 4000 x g for 2 min after polyvinyl alcohol (50 mL solution) was added to it. The remaining methylene chloride was subsequently evaporated by magnetic stirring for over 3 h after adding 50 mL of deionized water to the final product. After that, the HMs were gathered by spinning them at 8000 x g for 10 min, then rinsed thrice with distilled H2O to get rid of any unspherical particles. Then the mixture was lyophilized and kept at -20 °C until needed. Using SEM, the morphology of HMs-GDF-5 was studied. A DLS analyzer was utilized in order to determine the particle size of HMs.
In vitro release of GDF-5 from HMs
Composite HMs-GDF-5 were placed in a 5-mL centrifuge tube with 2 mL of PBS, and agitated at 150 rpm at 37 °C on a temperature-controlled shaker. The supernatant was aspirated at 0, 5, 10, 15, 20, and 30 days. The supernatant was aspirated once every 3 days for 30 days, and the cumulative release of GDF-5 was quantified using the BCA assay.
Degradation detection of HMs-GDF-5
The HMs were submerged in PBS solution and rinsed with ultrapure water after swelling equilibrium at 0–24 days (d). HMs were freeze-dried, and the residual weight (%) was computed using the formula = Wt/W0 × 100%, where W0 is the weight before degradation and Wt is the weight after degradation over time.
Stem cell culture and differentiation
The Adipose-Derived Mesenchymal Stem Cells (ADMSCs) culture was obtained from Sciencell and expanded using basal Medium by STEM Cell Technologies. The cells that were extracted from the pellet were cultivated at 37 °C with 5% CO2 in DMEM/F12 (Sigma-Aldrich, St. Louis, MO, USA) supplemented with 10% FBS (Sigma-Aldrich), 1% penicillin, and 1% streptomycin (Beyotime Biotech, Haimen, China). After 4–6 days of passage, the cells were extracted for further studies, and the medium was changed every 2 days. In order to differentiate the cultured ADMSCs into NPCs, they were first differentiated into MSCs. On day 0, ADMSCs were seeded in a six-well plate, and the medium was replaced daily for 8 days with DMEM comprising BSA (1.25 mg/ml), 1x ITS, dexamethasone (0.1 µM), α-Ketopropionic acid sodium salt (1 mM), 2-Phospho-L-ascorbic acid trisodium salt (0.17 mM), and proline (40 µg/mL) (Sigma-Aldrich). To differentiate into NPCs, the cells were grown in NP differentiation media for 21 days after morphological changes.
Cytoviability of HMs-GDF-5
In this test, GDF-5, HMs-GDF-5, and HMs-GDF-5-NPCs cell seeding and growth were measured. 1 mg sample and 1 × 10⁶ NPCs cultured in a centrifuge tube (15 mL) for 3 days. Cells were stained with DiD (1 µl; 10 mg/mL, Invitrogen™, 20 min, 37 °C) for tracking and Acridine Orange (5 µg/mL, 5 min, RT) for viability. Live cells emitted green fluorescence, while dead cells showed red fluorescence (~ 650 nm). Fluorescence microscopy (DiD: 644/655–665 nm, AO: 488/525 nm) was used for imaging, and viability was assessed via green/red fluorescence ratio using ImageJ. Also, viewed by a phase contrast microscope. The % of viability of NPCs was estimated = Abs of sample– Abs of (+) control / Abs– Abs of (-) control x 100. At each time point, the lactate dehydrogenase (LDH) level in the supernatant was assessed using an LDH assay kit from Sigma-Aldrich. It was subsequently measured at an absorption of 440 nm. Statistical analysis was performed using one-way ANOVA or t-test (p < 0.05).
Cell proliferation
Proliferation of cells was assessed after 3–7 days of co-cultivation with NPC samples at a dose of 1 mg/mL. The culture media was supplemented with 200 µL of CCK-8 test kit solution (Dojindo Molecular Technologies, Japan) for every time point, and then incubated at 37° C for four hr. A 96-well plate was used to test absorbance after 150 µL of supernatant was added. The absorbance was measured at 450 nm. Following that, the NPCs were washed with cold PBS, fixed with 4% formaldehyde for 15 min at room temperature, and labeled with 1 mg/mL acridine orange. After 10 min of incubation, the cell growth was visually examined using a fluorescence microscope (Olympus Optical, Tokyo, Japan) at 40x mag.
Flow cytometric analysis
We used flow cytometry to determine the effects of GDF-5, HMs-GDF-5, and HMs-GDF-5-NPCs on cell death after labeling NPCs with Annexin V/FITC and propidium iodide. 1 × 10⁶ NPCs were centrifuged after being exposed to substances for 24 h. Afterward, 200 µL of trypsin was added to separate them, and they were rinsed twice with cold PBS before receiving a final washing. Apoptosis Staining Kit (Abcam), Annexin V-FITC was used to meticulously collect the cells after a 24 h period, and stained. The cell suspension was supplemented with 5 µL of Annexin V-FITC so that the cells could be analyzed using flow cytometry, which is manufactured by Millipore Corporation in Billerica, MA, USA. 10 µL of PI was added after the cells had been incubated for fifteen minutes in the dark.
Cell differentiation assay
Multi-differentiated NPCs can be osteogenic, chondrogenic, or adipogenic. In short, 6 × 10³ cells/mL of NPCs were transferred into 6-well plates. After 80% cell confluence, differentiated medium was introduced for three weeks. After that, the cells were rinsed with PBS before being fixed with 4% PFA for half an hour. Then, to assess the Protein concentration assay of chondrogenic and adipogenic differentiation, an ELISA was used [22]. A microplate reader (100 µL solution) was used to measure the cell differentiation by absorbing at 540 nm.
Cell injectability assay
The injectability of these HMs-GDF-5-NPCs was examined at the eighth week. The injection performance of the complex was evaluated in comparison to that of Betolvex TM, a commercially available oily injection. A 5 µL syringe was loaded with one µL of the substance under examination using a 19-gauge needle. A syringe was attached to an air pump. To determine injectability, an air compressor was used to apply pressure to the intricate surface. Using a sphygmomanometer, the pressure was continually maintained at 100 mmHg. The measurement was taken in mmHg. We recorded the flow rate (mL/min) and the time it took for the 1 mL gel to be released.
Cell migration assay
The wound scratch experiment was used to test the migratory capacity of NPC. For both the 0 and 7-day incubation periods, the cells (3 × 10⁶) were spread out in 60 mm culture dishes. Once the cells reached confluence, a sterile pipette tip was used to create a wound in the monolayer. Each cell was then treated with 1 mg/mL of the samples individually. Photographs of wound-invading cells were captured at the specified intervals (0–72 h) using fluorescence microscopy.
Tube formation assay
A tube formation experiment using Matrigel was carried out according to the previously detailed procedure [23]. Each 24-well plate was coated with 100 µL of GFR Matrigel and polymerized for 30 min at 37 °C. After that, 5 × 10⁴ cells/well of NPCs were seeded into the coated wells and cultivated alongside the samples. Images of the tube formation were obtained at a magnification of 40x following an 8-h incubation period at 37 °C with 5% CO2.
Anti-inflammatory assay
NPCs were seeded at a density of 1 × 10⁴ cells per well in a 96-well plate for cell propagation. The cells were treated with a 20 µL solution of SI containing 1 mg/mL and allowed to sit for 24 h. Twenty-µl of the sample was supplied to each of the subsequent treatment groups. Following the manufacturer’s instructions, inflammatory cytokines (TNFα, IL1β, IL6) were measured in the cell supernatant medium at 3–7 days using sandwich ELISA (e-Biosciences, USA).
In vitro antioxidant ability of ROS by DCFH-DA assay
DCFH-DA produces dichlorofluorescein (DCF), a green fluorescent chemical, when it reacts with reactive oxygen inside the cell to assess ROS. A DCFH-DA stock solution (10 mM) was prepared in methanol and diluted with growth medium to 100 µM. For periods of 3 and 7 days, NPC cells were given samples at a concentration of 100 µg/ml. Additionally, NPCs were treated with N-acetyl cysteine (NAC), a ROS scavenger, washed with cold HBSS, and then treated with 100 µM of DCFH-DA at 37 °C for 30 min. After being treated with alkaline solutions, the lysed cells were examined under a fluorescent microscope.
Hemolysis assay
Hematocytes were extracted from rat whole blood by rinsing it with PBS many times to eliminate plasma. Using 0.1% Triton X as a reference, samples were subjected to blood cells at 37 °C for minutes. To measure the hemolysis ratio, a microplate reader was used to measure the absorption of 100 µL of solution in each group at 540 nm. The incubation solution was changed every two days after lyophilization, and samples were weighed.
Preparation of an in vivo IVD model
Sprague-Dawley rats weighing approximately 150 g were selected as the IVD model. The surgical procedure is outlined below [24]. In a nutshell, subsequent anesthesia, X-ray was used to confirm the positions of the 20-G needle percutaneous punctures made in the center of the caudal vertebrae at 7/8 (Co7/8) and 8/9 (Co8/9). Spin the needle around in a circle while holding it motionless for 30 s. The trial was conducted two weeks after the operation. The fifty rats were randomly assigned to 5 groups: Group 1- Control (no puncture); Group 2- NPCs; Group 3- GDF-5; Group 4- HMs-GDF-5; Group 5- HMS-GDF-5-NPCs. A 10 µL volume of hydrogel was injected into each IVD, and it was healed using UV light directed via an optical fiber. A sterile setting was maintained for the whole testing process.
X-ray imaging and disc height measurement
The rat coccyx was imaged using X-ray imaging at 4 and 8 weeks to measure the height of the IVD. After anesthesia, the rats were placed in the prone posture with their tails straight. Disc height index (DHI%) was estimated from Image J X-ray pictures using the formula: DHI% % = DHI after puncture/DHI before puncture x 100%. DHI% % (DHI post−injection/ DHI pre−injection) was employed to explain variations in IVD disc height.
Histological analysis of IVD
An IP injection of pentobarbital was given to the rats at 4 and 8 weeks to kill them. All of the vertebral segments and the whole IVD were taken. Using a 10% ethylenediaminetetraacetic acid solution, the specimens were decalcified and then preserved with paraformaldehyde. H&E staining was applied to the sections before being photographed under a microscope.
Immunofluorescence assay
To prepare the cells for immunofluorescence detection, cells were rinsed three times with PBS, fixed with 4% paraformaldehyde (PFA), and permeabilized using 0.3% Triton X-100. Afterward, the cells were blocked with 5% BSA for 30 min at room temperature under ambient humidity. The corresponding primary antibodies, COL2 (1:400, Abcam) and ACAN (1:250, Abcam), were then used to incubate them at 4 °C overnight. Following that day, cells were incubated with an Equine anti-mouse 2° antibody labeled with DAPI (1:200) and examined via a fluorescence microscope.
Gene expression
Eight weeks following injection, the mRNA expression levels of ACAN and COL-2 were quantified using RT-PCR. Total RNA was extracted using TRI reagent (Invitrogen), and reverse transcription was performed with the PrimerScript RT kit (Vazyme Biotech, China) according to the manufacturer’s instructions. They were utilized for reverse RNA to cDNA transcription and cDNA amplification, as directed. The levels of COLL-2 and ACAN mRNA expression were evaluated using the Ct technique. The primer sequences are detailed in the Supplement Table 1.
Statistical analysis
All experimental data are presented as mean ± SD. GraphPad Prism 6.0 was used for statistical analysis, followed by single-factor or two-factor ANOVA and Tukey paired comparisons. Statistical significance was determined at P < 0.05.


Comments (0)