
Remember me


Male or female wild-type mice (C57BL/6J background) were bred in-house, purchased from the Jackson Laboratory (JAX000664; WT) or provided by the National Institute of Health/National Institute of Aging. Mice were housed in a temperature and humidity-controlled environment with a 12-hour light/dark cycle. They were provided with food and water ad libitum. Mice were used for experiments at 2–3 months (young) or 20–24 months (old) as described below. All mice were wild-type, and thus no backcrossing was performed. All mice were habituated for at least 72 h in the animal facility before the start of experimentation. All experimental comparisons with young (2–3 month old) mice were made using littermate controls. Aged mice (20–24 month old) were received from the National Institute of Health/National Institute of Aging and compared to young mice received from the Jackson Laboratory. Mice were housed in a temperature- and humidity-controlled environment with a 12 h light/dark cycle (7:00 am–7:00 pm) and were provided with regular rodent chow and sterilized water ad libitum. Unless stated otherwise, mice were tested at 2–3 months of age (young mice) or 20–24 months of age (old mice). Sample sizes were chosen on the basis of a power analysis using estimates from previously published experiments [16, 36]. All experiments were approved by the Animal Ethics Committee at the University of Auckland, or the Institutional Animal Care and Use Committee of Washington University in St. Louis.
Intra-cisterna magna injectionsMice were anesthetized via intraperitoneal (IP) ketamine (75 mg/kg) and medetomidine (1 mg/kg). The fur from the head and neck regions was removed with depilatory cream and the underlying skin was disinfected with 2% chlorhexidine with 70% ethanol. To prevent drying, an ophthalmic solution was applied to the eyes, and the head was securely fixed in a stereotaxic frame. Mice then received a subcutaneous injection of 2 mg/kg Bupivacaine for post-operative analgesia overlying the intended incision site. A small incision in the neck was made and the muscle layers were retracted with fine surgical hooks exposing the CSF-filled cisterna magna. Using a Hamilton syringe coupled to a 33-gauge needle, injections of 3 μL AAV9-CMV-mTGFRβ1, 3 μL of AAV9-CMV-GFP control (both at 1013 genome copies per mL in sterile PBS), or 2.5 μL of ovalbumin conjugated to Alexa Fluor 594 (OVA-A594; 1 mg/mL in sterile PBS) were administered into the CSF via an intra-cisterna magna injection at a controlled rate of 1 μL/min, with an additional 2-minute retention to prevent backflow. The syringe was carefully retracted, and the incision site was closed with Leukosan Adhesive Skin Glue. Following AAV injections, mice were subcutaneously administered 2.5 mg/kg Atipamezole hydrochloride for anaesthesia reversal and allowed to recover on a heat pad until fully awake.
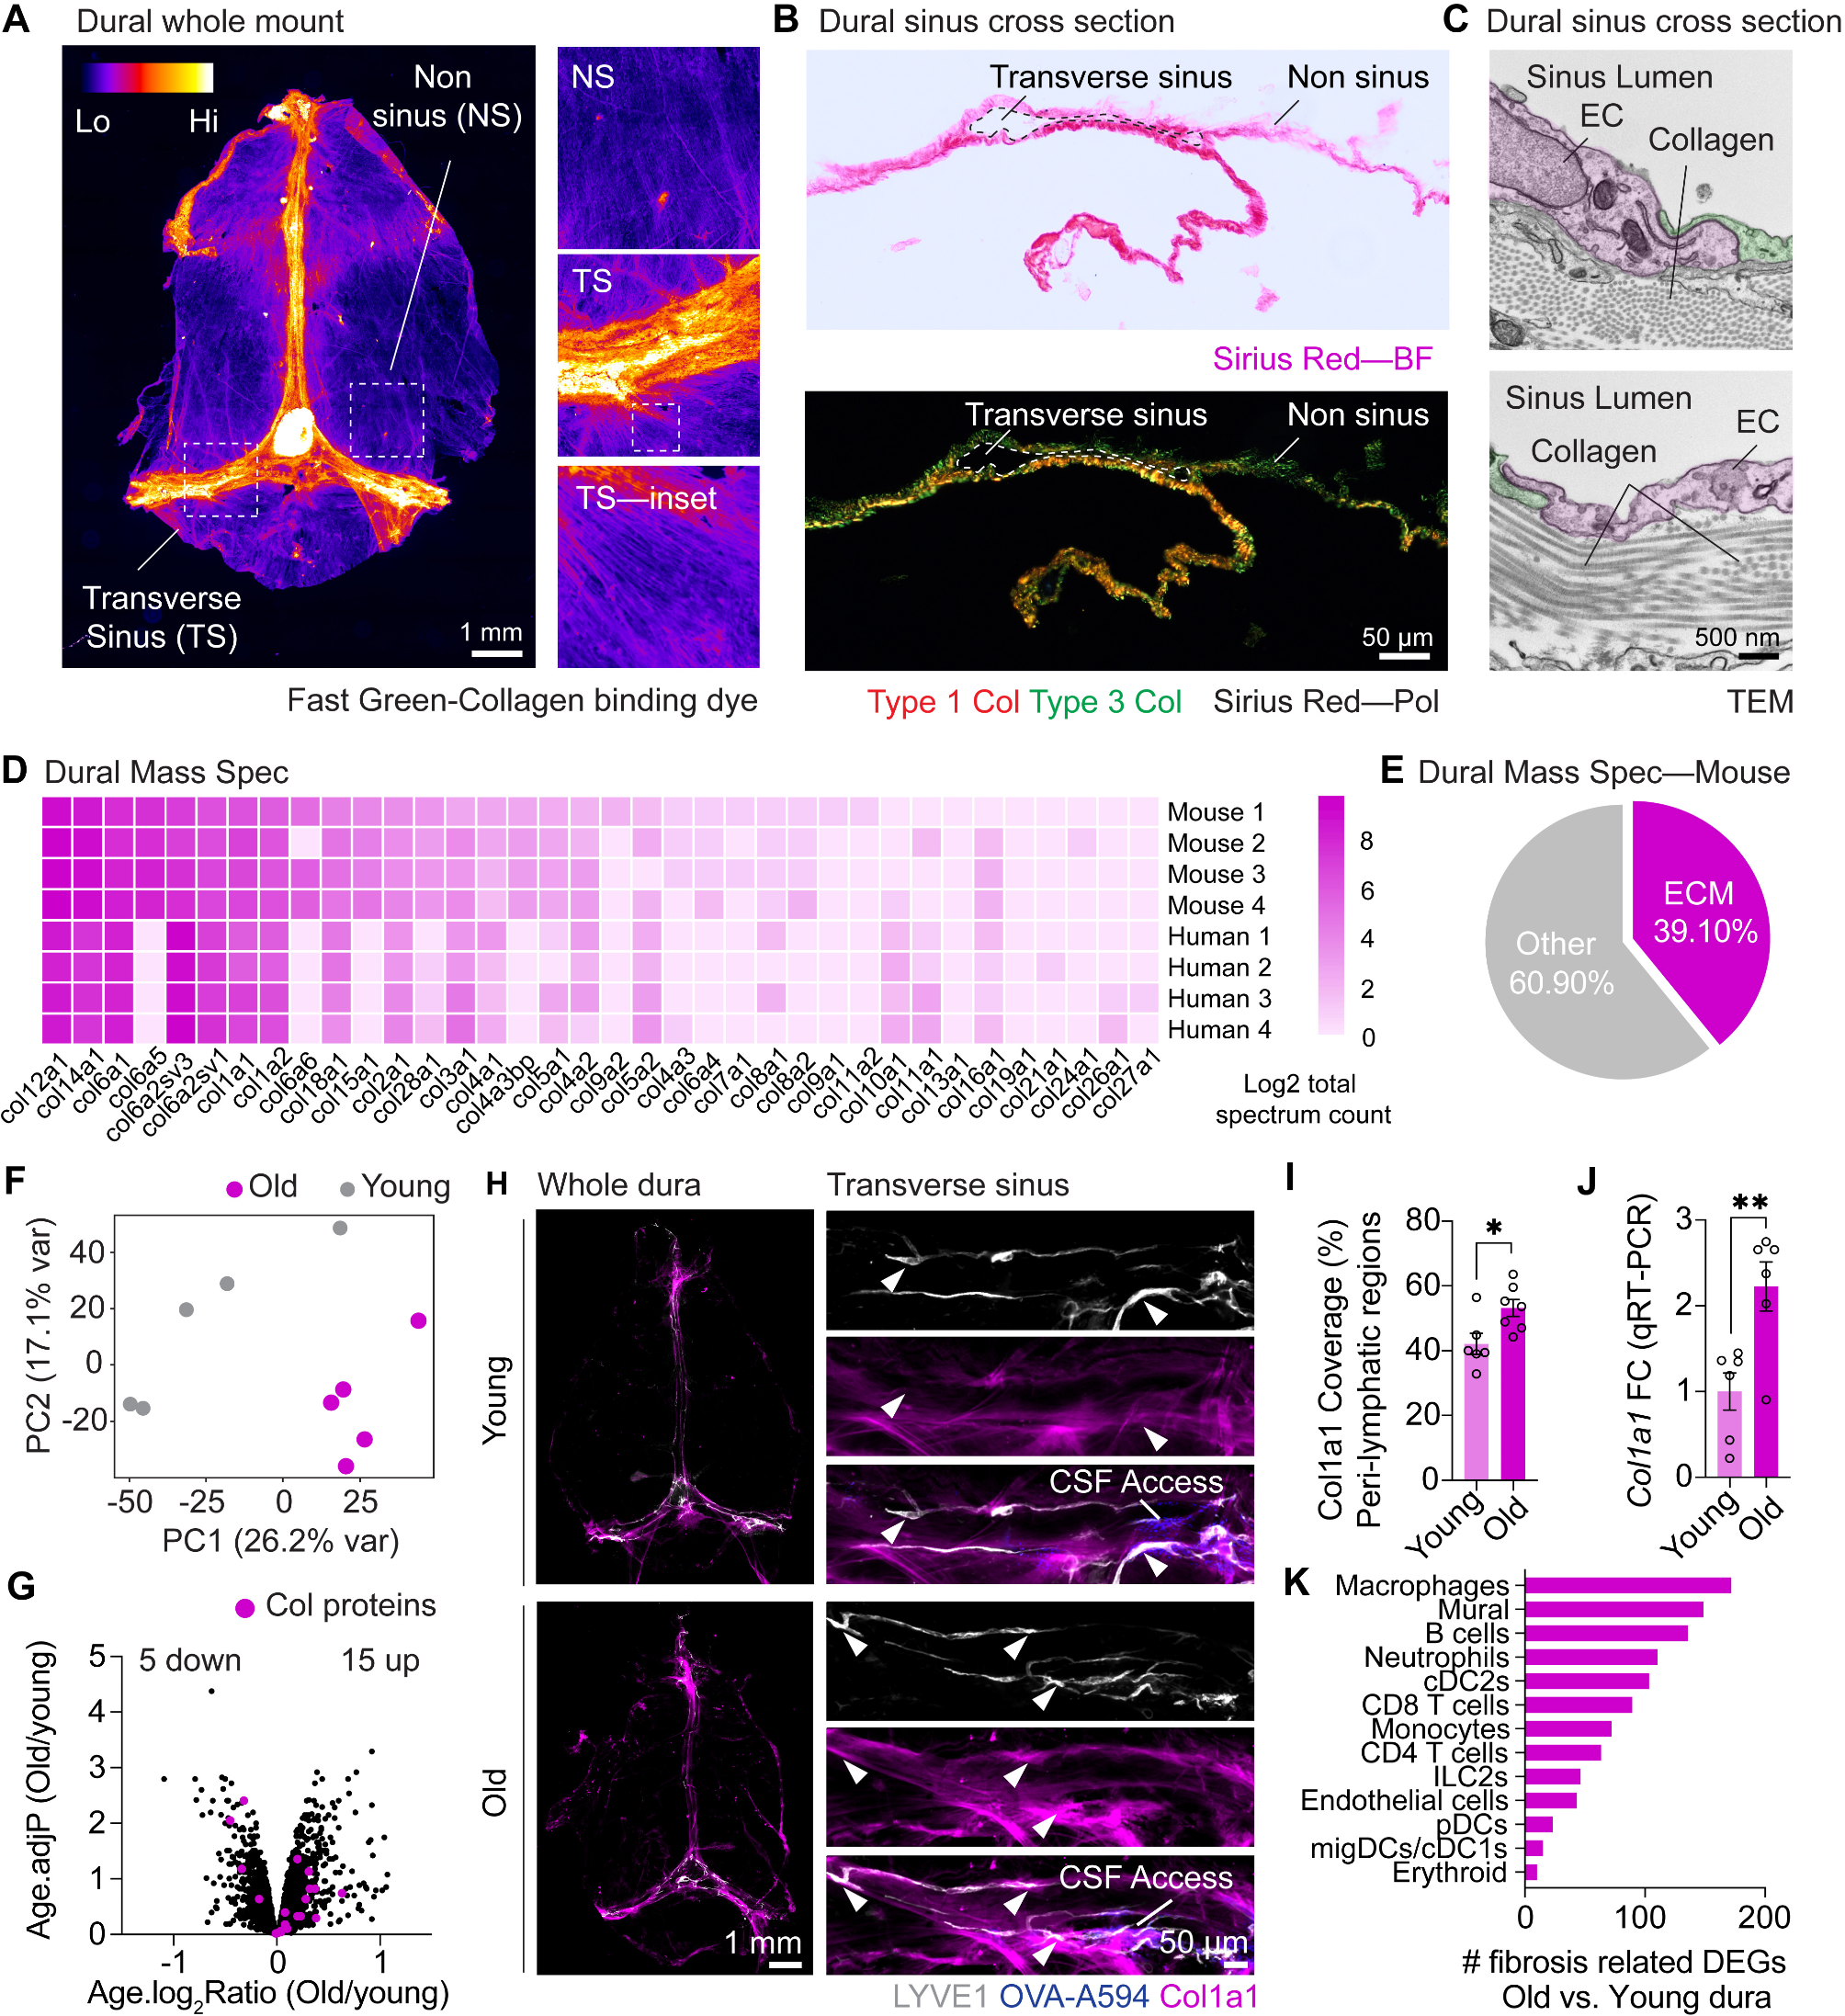
ImmunohistochemistryMice were euthanized using a lethal dose of 150 mg/kg Pentobarbitone via IP injection and then transcardially perfused with ice cold heparin (10 U/mL) in PBS for exsanguination. For lymph node collections, mice were positioned supine and dCLNs were collected via gentle retraction of the submandibular glands and collection laterally either side of the trachea with fine surgical forceps. Subsequently, mice were decapitated just posterior to the occipital bone, and the overlying skin and muscle were removed from the skull. Using fine surgical scissors, the skull cap containing the skull bone and the attached dura mater was then carefully removed by clockwise incisions, beginning and ending at the occipital bone. The brain was then removed from the cavity. For ACE point analysis, mice were first perfused with ice cold heparin (10 U/mL) in PBS, then 4% PFA, and the skull caps, containing the dura, were collected as described but with gentle downwards pressure in the skull when collecting to ensure good bridging vein collection. Lymph nodes were then drop fixed in 4% PFA for 24 h at 4 °C and washed in PBS. The fixed nodes were placed in 30% sucrose for another 24 h at 4 °C before embedding in optimal cutting temperature (OCT) and rapid freezing over dry ice. Frozen lymph nodes were cut (30 μm thick sections) in a cryostat and collected onto Superfrost slides. Roughly 10–20 sections were cut for each node, spanning the entirety of the node. Skull caps containing meningeal whole mounts were drop fixed in 4% PFA for 2 h, and the dura mater was gently peeled from the inner surface of the skull using fine surgical forceps and then placed in PBS until further use. Brains were drop fixed in 4% PFA for 48 h at 4 °C then placed in 30% sucrose in PBS until the brain had completely sunk, usually within 24–48 h, at 4 °C. The brains were then embedded in OCT reagent, and rapidly frozen over dry ice and stored at -20 °C. Coronal cryosections (40–100 μm thick sections) were cut using a cryostat and the resulting free-floating sections were preserved in PBS until ready for use. Free-floating brain sections and meningeal whole mounts were subjected to blocking and permeabilization for one hour at room temperature in 24-well plates, with continuous agitation, using donkey immunobuffer (PBS with 1% Donkey serum and 0.2% Tritton X-100) at room temperature. Slides containing lymph nodes were marked with the outline of a hydrophobic pen and blocked/permeabilized for 30 min with donkey immunobuffer at room temperature. Brains and meninges were then incubated with primary antibodies overnight at 4 °C with gentle agitation in 24-well plates, and lymph nodes on slides in a humidified chamber. The list of antibodies used can be found in (Table S1). The following day, all tissues were washed 3 times with PBS-T. Sections were then incubated with secondary antibodies and DAPI (1 μg/mL) at room temperature for 2 hours with agitation for brains and meninges, or on slides for lymph nodes. Finally, sections were washed with PBS-T and brains and meninges mounted on Superfrost Plus slides (Fisher Scientific) and coverslipped using Anti-Fade Fluorescence Mounting Medium.
Sirius red stainingFixed meningeal whole mounts were prepared as described above. Sections were placed in a mould containing OCT and tissue was flattened using fine paintbrushes. OCT blocks were frozen rapidly over dry ice, and 20 μm sections through the transverse sinus were cut using a cryostat and mounted directly on Superfrost slides. Sirius red was dissolved in saturated aqueous picric acid to produce a solution consisting of 0.1% Direct red. Tissue sections were covered with Sirius red solution for 1 hour at room temperature and then washed with deionized water to remove excess dye. Samples were then dehydrated through a graded series of ethanol (75%, 80%, 95% and 100%) for 5 min each and lastly cleared in xylene solutions, 10 min each. Tissue was coverslipped with DPX mounting medium.
Fast Green stainingCollagen staining using Fast Green dye was performed, with minor modifications, as described previously [56]. Whole mount meningeal preps were prepared as described above and mounted onto Superfrost glass slides and left for 2 hours at room temperature to dry onto the slide. Tissue was then dehydrated in a series of ethanol (30%, 50%, 70% and 100%) for 30 min each, and left for 1 hour in 100% methanol for an additional hour to ensure dehydration. Samples were then incubated on the slide with 2 μg/mL Fast Green for 2 hours at room temperature and washed with 100% methanol. Tissue was coverslipped with DPX mounting medium.
Imaging and analysisWidefield images were acquired using a Slideview VS200 slide scanner equipped with a 4x objective lens for macroscopic overview images and the 20 × (0.5 NA UPLFLN) objective lens was used for high resolution images. Confocal imaging was performed using the Leica LSM800 and 40x objective. Image analysis was performed using FIJI plugin for ImageJ (National Institutes of Health). Analysis of glymphatic influx was performed as described previously [36] using thresholded OVA-A594 coverage in brain sections as a percentage of overall brain-slice area. For each mouse, 8–12 brain sections (100 μm each) were analyzed and averaged to generate the value for a single mouse. Analysis of meningeal Lyve1, OVA, GFP or Col1a1 coverage was performed as described previously [36] using thresholded coverage as a percentage of the overall meningeal area. Peri-lymphatic Col1a1 was determined by generating a binary Lyve1 mask, expanding this by 10 μm, and then analyzing thresholded collagen coverage within this mask. Analysis of lymphatic drainage and Lyve1 coverage in lymph nodes was performed as described previously [36] using thresholded OVA or Lyve1 coverage as a percentage of overall lymph node area. For each mouse, 10–20 sections were analyzed from each lymph node and averaged to generate the value for a single mouse.
Single cell isolation and flow cytometryUnfixed dural meninges were removed from the skull cap using fine forceps and kept in ice-cold DMEM throughout the collection process. The meninges were digested for 15 min at 37 °C with constant agitation using 1 mL of pre-warmed digestion buffer (DMEM, 2% FBS, 1 mg/mL collagenase VIII, and 0.5 mg/mL DNase I). At completion, samples were triturated 5 times with a 1 mL pipette tip and filtered through a 70 μm cell strainer. Collagenase was then neutralized by the addition of 1 mL of DMEM containing 10% FBS. Following a centrifugation at 300 x g for 5 minutes, the samples were resuspended in ice-cold fluorescence-activated cell sorting (FACS) buffer (PBS with 1 mM EDTA and 1% BSA) and kept on ice until use. For surface staining, single cell suspensions were incubated in FACS buffer containing anti-CD16/32 (FC block), diluted 1:50 for 5 minutes, followed by the addition of fluorescently conjugated antibodies for 20 min at 4 °C. Subsequently, the samples were washed in FACS buffer and ran on a Cytek Aurora 5 laser system (School of Biological Sciences, UoA) and analyzed using FlowJo software (Tree Star). The list of antibodies used for flow cytometry can be found in (Table S1).
Liquid chromatography mass spectrometry (LC-MS)The methods for unlabelled LC-MS are detailed previously [16]. For TMT-labelled LC-MS, methods are described below.
Peptide preparationPeptides were prepared from solubilized mouse dura. Samples were digested as previously described [16]. Lysates were digested in 100 mM Tris-HCl buffer, pH 8, containing 4% sodium dodecyl sulfate, reduced with 100 mM dithiothreitol, and heated to 95 °C for 10 min. Nine μl of each sample was combined to make the reference pool sample. Reduced samples were mixed with 200 μl 100 mM Tris-HCL buffer, pH 8.5 containing 8 M urea (UA buffer) and transferred to the top of a 30,000 molecular weight cut-off filter and centrifuged at 10,000 x g for 10 min. An additional 300 μl of UA buffer was added and the filter was spun for another 10 min. The flow through was discarded and the proteins were alkylated using 100 μl of 50 mM iodoacetamide in UA buffer. Iodoacetamide in UA buffer was added to the top chamber of the filtration unit. The samples were gyrated at 550 rpm using a Thermomixer at room temperature for 30 min in the dark. The filter was spun at 10,000 x g for 10 min and the flow through discarded. Unreacted iodoacetamide was washed through the filter with two additions of 200 μl of UA buffer, and centrifugation at 10,000 x g for 10 min after each buffer addition. The UA buffer was exchanged with digestion buffer (50 mM ammonium bicarbonate buffer). Two sequential additions of digestion buffer with centrifugation after each addition to the top chamber was performed. The filters were transferred to a new collection tube and samples were digested with a combination of lysyl endopeptidase (1 mAU per filter) and sequencing grade modified trypsin in digestion buffer on top of the filter for 2 hours and overnight at 37 °C. The filters were spun at 14,000 x g for 15 min to collect the peptides in the flow through. The filter was washed with 100 mM ammonium bicarbonate buffer and the wash was collected with the peptides. In preparation for desalting, peptides were acidified to 1% (vol/vol) TFA final concentration. Peptides were desalted using two micro-tips on a Beckman robot (Biomek NX). The peptides were eluted with 60% (vol/vol) acetonitrile in 0.1% (vol/vol) TFA and dried in a Speed-Vac (Thermo Scientific, Model No. Savant DNA 120 concentrator). Samples were dissolved in 20 μl of 1% (vol/vol) MeCN in water. An aliquot (10%) was removed for quantification using the Pierce Quantitative Fluorometric Peptide Assay kit (Thermo Scientific). 1 μg total peptide from each sample and reference pool sample was aliquoted, lyophilized and stored at -80 ºC for TMT labelling.
Preparation of TMT-labelled peptidesThe lyophilized peptides (1 μg) from 5 bioreplicates of each condition and the reference pool sample were dissolved in 20 μl of HEPES buffer (100 mM, pH 8.5) and labelled according to the vendor protocol using the TMT-11 reagent kit (ThermoFisher Scientific). The labelled samples were combined, dried, and dissolved in 120 μl of 1% (vol/vol) formic acid (FA) in preparation for desalting. The TMT-11 labelled sample was desalted using PGC tips as described above.
Ultra-high performance liquid chromatography mass spectrometryThe labeled peptides were analyzed using high-resolution nano-liquid chromatography tandem mass spectrometry (LC-MS). Chromatography was performed with an Acclaim PepMap 1000 C18 RSLC column (75 μm i.d. × 50 cm) (Thermo-Fisher Scientific) on an EASY-nanoLC 1000 (Thermo Fisher Scientific). The column was equilibrated with 11 μl of solvent A (1% (vol/vol) FA) at 700 bar pressure. The samples in 1% (vol/vol) FA were loaded (2.5 μl) onto the column with 1% (vol/vol) FA at 700 bar. Peptide chromatography was initiated with mobile phase A (1% FA) containing 5% solvent B (100% ACN, 1% FA) for 1 min, then increased to 25% B over 195 min, to 35% B over 40 min, to 70% B over 6 min, to 95% B over 2 min and held at 95% B for 18 min, with a flow rate of 250 nL/min. Data were acquired in data-dependent mode. Full-scan mass spectra were acquired with the Orbitrap mass analyser using a scan range of m/z = 375 to 1500 and a mass resolving power set to 70,000. Twelve data-dependent high-energy collisional dissociations were performed with a mass resolving power at 35,000, a fixed lower value of m/z 100, an isolation width of 1.2 Da, and a normalized collision energy setting of 32. The maximum injection time was 60 ms for parent-ion analysis and 120 ms for product-ion analysis. Ions that were selected for MS/MS were dynamically excluded for 40 s. The automatic gain control was set at a target value of 3 × 10⁶ ions for full MS scans and 1 × 10⁵ ions for MS2.
Identification of and quantification of proteinsThe machine data from the LC-MS analysis of isobarically-labelled peptides, using the Q-Exactive mass spectrometer, were converted to peak lists using Proteome Discoverer (version 2.1.0.81, ThermoScientific). MS2 spectra with parent ion charge states of + 2, +3 and + 4 were analyzed using Mascot software (Matrix Science, ). The MS data were searched using Mascot software against a concatenated UniProt database mouse (17,033 entries) and common contaminant proteins (cRAP, 116 entries). Trypsin/P enzyme specificity with a maximum of 4 missed cleavages allowed was used. The searches were performed with a fragment ion mass tolerance of 20 ppm and a parent ion tolerance of 20 ppm for Q Exactive™ data. PSMs were filtered at 1% false-discovery rate by searching against a reversed database. A minimum of two peptides with unique sequences, not resulting from missed cleavages, was required for identification of a protein. The processing, quality assurance and analysis of LC-MS data were performed with proteoQ, Mzion enables deep and precise identification of peptides in data-dependent acquisition proteomics. The precursor intensities were converted to logarithmic ratios (base 2), relative to the average precursor intensity across all samples. Within each sample, Dixon’s outlier removals were carried out recursively for peptides with greater than two identifying PSM’s. The median of the ratios of PSM that could be assigned to the same peptide was first taken to represent the ratios of the incumbent peptide. The median of the ratios of peptides was then taken to represent the ratios of the inferred protein. To align protein ratios across samples, likelihood functions were first estimated for the log-ratios of proteins using finite mixture modelling, assuming two-component Gaussian mixtures. The ratio distributions were then aligned so that the maximum likelihood of log-ratios was centred at zero for each sample. Scaling normalization was performed to standardize the log-ratios of proteins across all samples. To reduce the influence of outliers from either log-ratios or reporter-ion intensities, the values between the 5th and 95th percentile of log-ratios and 5th and 95th percentile of intensity were used in the calculations of standard deviations.
Human dural fibroblast cultureBiopsy human dural specimens were acquired from Auckland City Hospital. Additional patient information is presented in (Table S2). Before dissection, tissue was washed with PBS and dissected into small explant cultures ∼ 1–5 mm in size, using a sterile blade. These explants were then transplanted into a 6-well tissue culture plate containing a low volume of Dulbecco’s modified Eagle medium (DMEM)/F12, supplemented with 10% FBS and 1% penicillin, streptomycin, glutamine (PSG), herein referred to as fibroblast media. The low volume of fibroblast media facilitates the attachment of the tissue explants. The tissue explants were incubated overnight at 37 °C with a 95% air/5% CO2 atmosphere. The following day, once the explants had attached to the surface, a small amount of fibroblast media was added to prevent dehydration. The growth rate of human dural fibroblasts is case dependent; however, it typically takes one week for cells to initiate growth and an additional two weeks to reach a confluent monolayer. After reaching 90% confluence, the explants were carefully removed and transferred onto a new 6-well plate. Subsequently, the cells were trypsinized (0.25% trypsin-1 mM ethylenediaminetetraacetic acid) (EDTA) at 37 °C for approximately 5 min to facilitate detachment and then transferred to a flask to promote cell expansion. Cell cultures were grown in fibroblast media and incubated at 37 °C, in an atmosphere containing 5% CO2. Prior to utilization, all solutions were pre-warmed to 37 °C. Every two days, half of the cell culture media was changed until cells reached 90% confluency. All work was done aseptically in a cell culture biosafety cabinet. To harvest cells for experimental procedures, the fibroblast media was removed and flasks containing cells were washed twice with PBS before trypsinization at 37 °C for 5 min. Subsequently, an equal volume of medium was introduced into the flask and gently mixed to dislodge any remaining adherent cells. The resulting suspension was then transferred to a Falcon tube and centrifuged at 300 x g for 5 min. The cell pellet was re-suspended in fibroblast media. Viable cell quantification was carried out by Trypan Blue exclusion with the aid of a haemocytometer. For a 96-well plate (Nunclon® delta, 0.33 cm2 per well) cells were seeded at a density of 10,000 cells per well. Cells were incubated overnight to allow attachment before experimental use. To establish a bank of dural fibroblast cells, cell expansion and cryopreservation was conducted by resuspending cell pellets in 90% FBS and 10% dimethyl sulfoxide (DMSO). The resulting cell suspension was aliquoted in vials, each containing 1 mL, at a final concentration of 1 million cells/mL. These vials were slowly cooled to -80 °C using a Mr. Frosty™ Freezing Container, before being transferred to liquid nitrogen for extended storage. When thawing, a cryovial was rapidly thawed in a 37 °C water bath. Subsequently, 10 mL of pre-warmed fibroblast media was gently added in a dropwise manner. The cell suspension was transferred to a T75 flask and incubated overnight at 37 °C to facilitate fibroblast attachment. The following day, a complete media change was carried out to remove non-adherent cells and to provide fresh media, enabling cell expansion and growth before using in future experiments.
Mouse dural fibroblast cultureAdult female/male wild-type mice (2–3 months old) were euthanized humanely by CO2 inhalation. Mice were decapitated just posterior to the occipital bone, and the overlying skin and muscle were removed from the skull. Using fine surgical scissors, the skull cap was then carefully removed by clockwise incisions, beginning and ending at the occipital bone. The dural mater of the meninges were isolated by carefully peeling away from the skull cap using fine forceps and washed in fibroblast media. All procedures were performed in cell culture biosafety cabinet. The meninges then underwent a 15-minute digestion at 37 °C using 1 mL of pre-warmed digestion buffer (DMEM/F12 with 2% FBS, 1 mg/mL collagenase VIII from Sigma Aldrich, and 0.5 mg/mL DNase I from Sigma Aldrich). The digested material was triturated 5 times with a 1 mL pipette then filtered through a 70 μm cell strainer, and the collagenase was neutralized with 1 mL of fibroblast media. The resulting cell suspension was centrifuged at 300 x g for 5 min, and the cell pellet was resuspended and plated into a 6-well plate, with one meninge per well, in fibroblast media. The culture medium was changed every 3–4 days, and after 2-2.5 weeks, confluent cultures were observed. For passage or plating, cells were washed with PBS, dissociated using 0.25% Trypsin-EDTA for 5–10 min at 37 °C. The trypsin was neutralized with twice the volume of fibroblast media and centrifuged at 300 x g for 5 min. The cell pellet was then resuspended in fibroblast media and cells were counted using a haemocytometer and Trypan Blue exclusion. The fibroblasts were seeded at a density of 10,000 cells per well in 96-well plates.
Fibroblast treatmentsDural fibroblasts were plated as aforementioned and allowed to reach 70–90% confluency before initiating treatments. Human dural fibroblasts were treated with cocktails containing 10 ng/mL of cytokines, as specified in (Table S3), for 48 h. The cytokines were reconstituted following the manufacturer’s instructions (Peprotech) and diluted in 0.1% bovine serum albumin (BSA). For mouse dural transduction, the AAV aliquots were thawed on ice, while confluent murine fibroblasts were trypsinized and plated following the aforementioned procedures. Once the cells were plated, the fibroblasts (still in suspension) were transduced with 1 × 10¹⁰ genome copies per mL (GC/mL) of the respective AAV (GFP or muT). Subsequently, the cells were incubated at 37 °C for one week.
Human iPSC linesThe human iPSC lines (Table S4) were purchased from the American Type Culture Collection (ATTC) or the Jackson Laboratory. The use of iPSCs in this project was covered under HSNO approval number GMD102459.
iPSC maintenanceiPSCs were maintained at 37 °C & 5% CO2 in StemFlex medium in Geltrex-coated plates (12.5 μg/cm2). The StemFlex medium was refreshed every two-three days. iPSC’s were passaged when ∼ 60–80% confluent. To passage, iPSCs were washed in PBS and brought to suspension with Versene. The iPSCs were gently triturated 3–5 times in the Versene solution until the cell suspension reached small clumps of ∼ 5–15 cells and iPSCs were split at a ratio of 1:6 − 1:40 depending on the line. StemFlex medium was refreshed the following day to remove Versene from the medium.
LEC differentiation protocolLECs were differentiated as described previously [35], but with minor modifications including adherent-based mesoderm induction [57] and the addition of IL-3 and Wnt5b in the LEC-induction media to drive PROX1 expression [58, 59]. When 60–80% confluent (day 0), iPSCs were brought into a single-cell suspension with Accutase. Accutase was inactivated with DMEM/F12 + 10% FBS (DMEM/F12 + 10% FBS), counted, and centrifuged at 200 x g for 4 min. iPSCs were resuspended in StemFlex medium + 10 μM ROCK inhibitor (Y-27632) and were seeded at 37,000 cells/cm2 into a Geltrex-coated 12- or 6-well plate and incubated at 37 °C & 5% CO2 for 24 h. On day 1, the StemFlex medium + Y-27,632 was replaced with Mesoderm Induction Media (MIM) (Table S5) for 3 days. On day 4, the cultures were placed in Lymphatic Induction Media (LIM) (Table S5). LIM was refreshed on day 5, generating a heterogenous cell culture on day 6, thus a magnetic-activated cell sorting (MACS)-based enrichment step was performed. On day 6, cells were brought into a single-cell suspension with Accutase, which was subsequently inactivated with DMEM/F12 + 10% FBS. The inactivated cell suspension was passed through a 70 μm cell strainer and washed through with an additional 2 mL of DMEM/F12. Cells were centrifuged at 200 x g for 4 min and the MACS enrichment was carried out using a MACS MultiStand, MidiMACS separator and a CD31 Microbead kit according to manufacturer’s instructions. Briefly, the supernatant was completely aspirated and the cell pellet was resuspended in 60 μL of DMEM/F12 followed by 20 μL of FcR Blocking reagent and 20 μL of CD31 Microbeads. The cell suspension was gently resuspended and was incubated at 4 °C for 15 min. Following the incubation, 1 mL of DMEM/F12 was added and the cell suspension was centrifuged at 200 x g for 4 min. During this process, an LS column was prepared by washing through 3 mL of DMEM/F12 in the magnetic field of a MidiMACS separator. The cell pellet was resuspended in 1 mL DMEM/F12 and was added to the prepared column. Once the solution had fully flowed through, the column was washed three times, each with 3 mL DMEM/F12. After the last wash, the LS column was removed from the separator, placed on top of a collection tube, and 5 mL of DMEM/F12 was added and immediately flushed through with a plunger. The CD31+ cell suspension was centrifuged at 200 x g for 4 min and resuspended in VEGF-C (100 ng/mL) supplemented endothelial media (sEM; ScienCell; Table S5). The CD31+ cells were plated in 0.1% gelatin coated plates at 150,000 cells/cm2.
iLEC passaging and maintenanceiLECs were maintained at 37 °C & 5% CO2 in sEM which was refreshed every 3–4 days. iLECs were passaged when ∼ 60–90% confluent. To passage, cells were brought into single-cell suspension with trypsin. Trypsin was neutralized with DMEM/F12 + 10% FBS and cells were centrifuged at 300 x g for 5 min. Viable cells were resuspended in sEM and plated into gelatin-coated plates at a ratio of 1:2 − 1:3 for further expansion, or seeded at specific cell densities for each experiment. Where not otherwise mentioned, iLECs were seeded at 10,000 cells/well in 96 well plates and 15,000 cells/well in 48 well plates. All iLECs used in experiments were between passages 2–5, as cell senescence was observed thereafter.
Cytosoft defined elasticity platesiLECs were plated at 10,000 cells/well on Collagen 1-coated plates, as per manufactures instructions. For collagen coating, 100 μg/mL Collagen 1 was added to wells, incubated at room temperature for 1 h, and washed with PBS before cell addition. iLECs were incubated on plates for 72 h at 37 °C & 5% CO2.
Microfluidic sprouting assaysidentX microfluidic chips (Aim Biotech) and 10 μL pipette tips were pre-cooled at at 4 °C to minimize premature gelling. Fibrin/thrombin gels were prepared by the addition of soft (5 mg/mL fibrinogen to 4 U/mL thrombin), medium (25 mg/mL fibrinogen to 10 U/mL thrombin) and stiff (50 mg/mL fibrinogen to 20 U/mL) all on ice. Collagen gels were generated as soft (1 mg/mL), medium (2 mg/mL) or stiff (4 mg/mL) gels by addition of NaOH, H2O and 10X PBS as per (Table S6). The central gel chamber of identX microfluidic chips were loaded with 10 μL of respective gels using cooled chips and pipette tips. Chips were incubated at 37 °C for 30 min to enable gelling. The media chamber destined for iLEC seeding was coated with 15 μL of 0.1% gelatin-based coating solution for 5 min at RT, and the other media channel was hydrated with 15 μL sEM. The gelatin-based coating solution was washed and removed by addition of 70 μL to one media port, and 50 μL to the opposite attached media port. This was repeated three times, each time removing excess media. Media ports were then hydrated with 70 μL of sEM in one port, and 50 μL of sEM in the opposite attached port. iLECs were seeded in the cell gelatin-coated chamber at 60,000 cells/well in 20 μL sEM and allowed to adhere overnight. The next day, sEM was removed from all ports, and the iLEC-containing media ports received non supplemented EM (50 μL one port, 30 μL the other port) containing only the based formulation without FBS or ECGS, while the opposite media ports received complete EM further supplemented with 100 ng/mL VEGFC, Ang1, HGF (70 μL one port, 50 μL the other port). This approach generates a concentration gradient of lymphangiogenic factors to promote sprouting, and a small pressure difference to generate interstitial flow. This approach was repeated daily for 7 days. Chips were stained with Actin Green (2 drops/mL) and DAPI (1 μg/mL) for 2 h at room temperature, then washed with PBS-T, all via addition of 50 μL one port, 30 μL the other port on one side, and 70 μL one port, 50 μL the other port on the other side to visualize lymphatic structures.
ImmunocytochemistryCell cultures were fixed with 4% PFA at room temperature for 15 min. This was followed by three washes with PBS-T to permeabilize the cells for subsequent staining. Primary antibodies were diluted accordingly in PBS containing 0.2% Triton X-100, 1% donkey serum, and 0.05% proclin (collectively referred to as donkey immunobuffer). Cells were incubated overnight at 4 °C with gentle agitation. The next day, cells were washed three times with PBS-T for a total of 15 min before addition of secondary antibodies. Secondary antibodies and nuclear stain DAPI (1 μg/mL) were diluted in donkey immunobuffer and were added for two hours at room temperature with gentle agitation. Antibodies used can be found in (Table S1).
Sirius red staining of cellsCell cultures were fixed as described above. Cells were treated with 0.1% Sirius red in saturated picric acid solution and incubated overnight at 4 °C with gentle agitation. The following day, cells were washed three times with PBS-T for a total of 15 min to remove unbound dye. Then, cells were treated with 1 M NaOH at room temperature for 15 min with gentle agitation to dissolve the collagen dye complex.
Image capture and analysisThe ImageXpress Micro® XLS high content screening system and Operetta® CLS high content screening system were used to capture fluorescent images of cultured cells in 96-well plates. The 20 × (0.45 NA) objective lens was used. The exposure times and focus were optimized for each plate to account for antibody efficiency. The quantitative analysis of image measurements was conducted with the FIJI package for ImageJ. For the coverage measurements of Col1a1, fibronectin and Sirius red data, positive signals were identified by thresholding of images, and quantified as area of signal/total area of site, resulting in a percentage area measurement. The same parameters were applied for across all groups during imaging and threshold settings, to mitigate experimental bias. The average percentage area for each condition was normalized relative to the average cell count, determined by the number of DAPI positive cells. Given the varied baseline expression of each parameter across individual cases, data was normalized based on the vehicle control within each respective case. Cell scoring analysis was carried out using the MetaXpress in-built cell scoring software (version 6.5.5). Briefly, images from the DAPI channel served as a reference and scoring was conducted in comparison to the corresponding FITC image. The GFP signal’s minimum and maximum width were adjusted to exclude any auto-fluorescent debris while ensuring cells were counted individually. Additionally, the intensity above background was optimized to minimize background noise. The same parameters were applied for across all groups within each case, to mitigate experimental bias.
RNA-sequencing bioinformatic analysisData Quality Control: After obtaining the raw data (fastq files), the quality of the original reads including sequencing error rate distribution and GC content distribution, was evaluated using FastQC. The original sequencing sequences contain low quality reads and adapter sequences. To ensure the quality of data analysis, raw reads were filtered to get clean reads, and the subsequent analysis was based on clean reads. Data filtering was carried out using fastp mainly including the removal of adapter sequences in the reads, the removal of reads with high proportion of N (N denotes the unascertained base information), and the removal of low-quality reads. Read Mapping to a Reference Genome: The reference genome index was created by the build-index function in HISAT2 software package with default options. Then the filtered clean reads were mapped to reference genome by HISAT2, and the position and gene characteristics were acquired. After the alignment, the generated SAM files were sorted to BAM files using samtools. Quantification and Differential Expression Analysis. FeatureCounts software of subread package was used to quantify transcripts and the gene expression levels using mapped reads’ positional information on the gene. The differential expression levels of the gene, as well as the expression level of each single gene were analyzed. DESeq2 was used to analyze the DEGs (differentially expressed genes). During the analysis, samples were grouped so that comparisons between groups as a control-treatment pairwise could be done later. During the process, Log Fold Change ≥ 1.5 and FDR < 0.05 are set as screening criteria. GO and KEGG Enrichment Analysis. Gene Ontology enrichment analysis is a set of the internationally standardized classification system of gene function description that attempts to identify GO terms that are significantly associated with differentially expressed protein coding genes. GO enrichment analysis (Biological Processes) for the differentially expressed genes were performed using the R package ClusterProfiler. GO terms with corrected P values less than 0.05 were considered significantly enriched for differentially expressed genes.
Statistical analysisTwo-tailed unpaired Student’s t-tests were used for pairwise comparisons between two groups. One-way ANOVA, accompanied by appropriate multiple-comparison tests (as specified in the figure legends), was utilized to assess differences among three distinct groups. For comparisons of multiple factors, two-way ANOVA with appropriate multiple comparisons tests (stated in figure captions) were used. Data was always presented as mean ± s.e.m. All statistical tests were conducted in using GraphPad Prism (GraphPad Software, v.9.0.2). For statistical analysis of LC-MS, metric multidimensional scaling and principal component analysis of protein log2-ratios was performed with the base R function stats: cmdscale and stats: prcomp, respectively. Heat-map visualisation of protein log2-ratios was performed with heatmap (pheatmap: Pretty Heatmaps. R package version 1.0.12). Linear modellings were performed using the contrast fit approach in limma to assess the statistical significance in protein abundance differences between groups. Adjustments of p-values for multiple comparison were performed with Benjamini-Hochberg correction. P-values were annotated as follows: NS, P > 0.05, *, P < 0.05, **, P < 0.01, ***, P < 0.001.
Comments (0)